

Utilization of “Visualization Indicators” (Part 188)
Use of "Visualization Indicators" (its188)
1. Further evolve the "28 Currency Pair List Indicator" into an indicator
"8CPVisualization Indicator"to chartNZDUSD.
There are versions of the "8 CP Visualization Indicator":Oceania edition,London edition,NewYork edition,AnyCP edition. This time, theOceania edition was used.
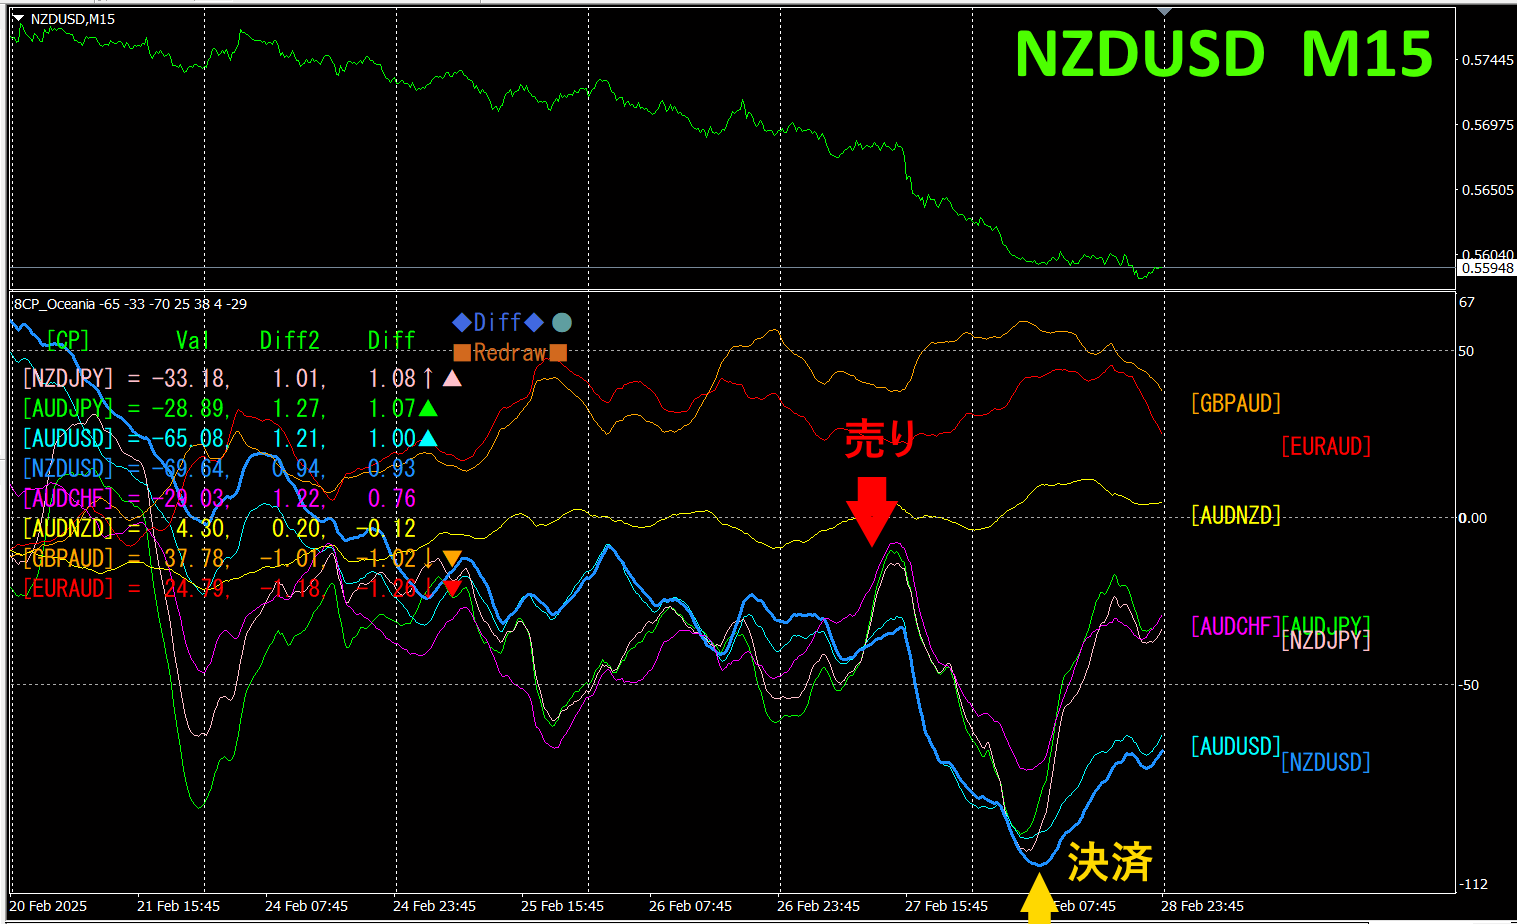
The top half is the 15-minute chart ofNZDUSD. The bottom half is from the "8CPVisualization Indicator"; the light blue bold line graph corresponds toNZDUSD.
On Thursday, I broke below the other chart groups, so I entered a sell. On Friday, I closed at the bottom, gaining about80pips of profit.
If you use the "TrendLine-EX", you can automate entries and exits when the trend line is broken diagonally. You can just leave it as is for easy trading. "TrendLine-EX" is a semi-automatic EA that can automatically sell on a break below the trend line and automatically close on a break above the trend line.
2. Best SelectIndicator to Try
The figure below is a screenshot fromFebruary,2025,28,10:35JST)
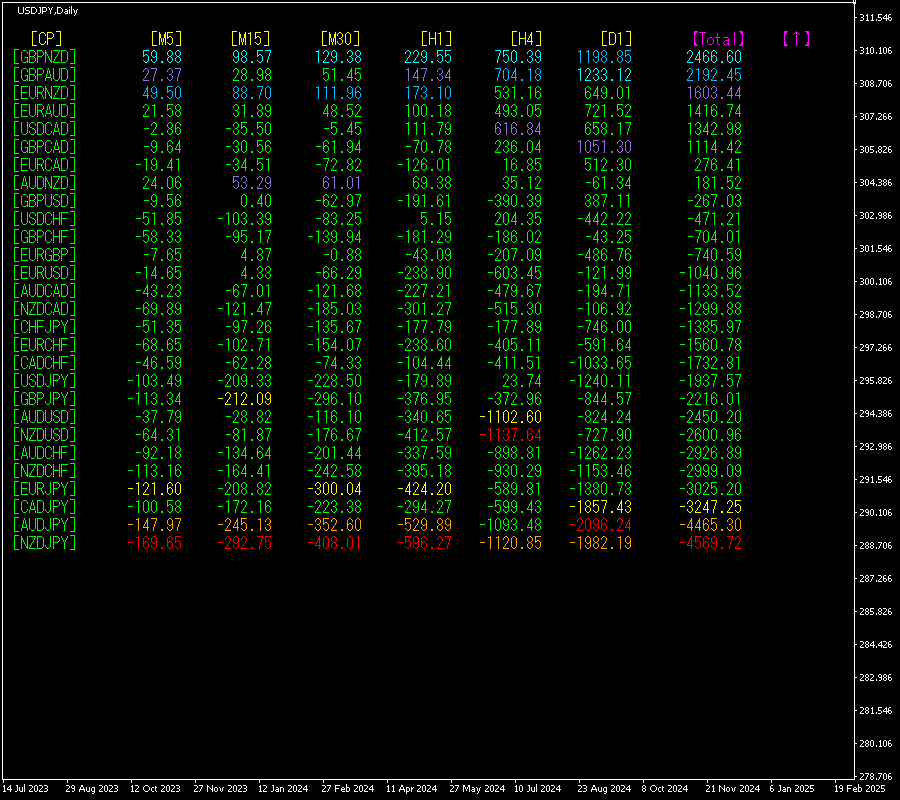
[Total]The numbers are arranged in descending order. At the bottom,NZDJPY shows red color across all timeframes. value is-4569.72, a large negative figure. indicates a downward trend is occurring.
Now, let's look at theNZDJPY chart.
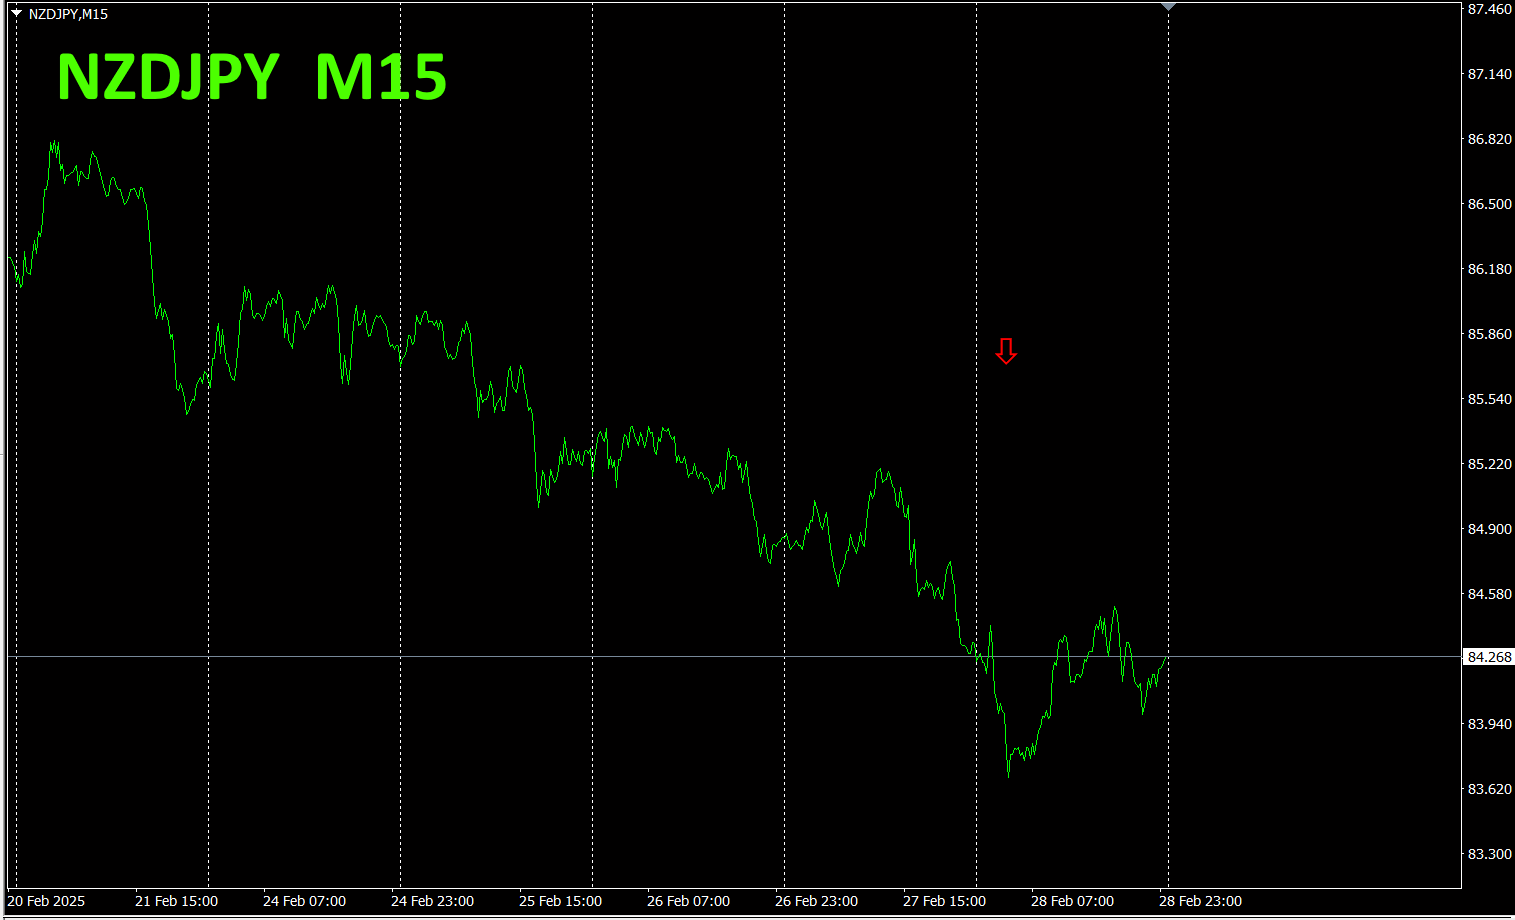
The red arrows indicate where the screenshot was taken. It captures a drop in the middle of a downtrend.
"28 currency pairsBest Select indicator"
"28 currency pairsBest Select indicator"

https://www.gogojungle.co.jp/tools/indicators/35128
3. 2021Year5monthhas trackedEURJPY
2021Year5monthEURJPY
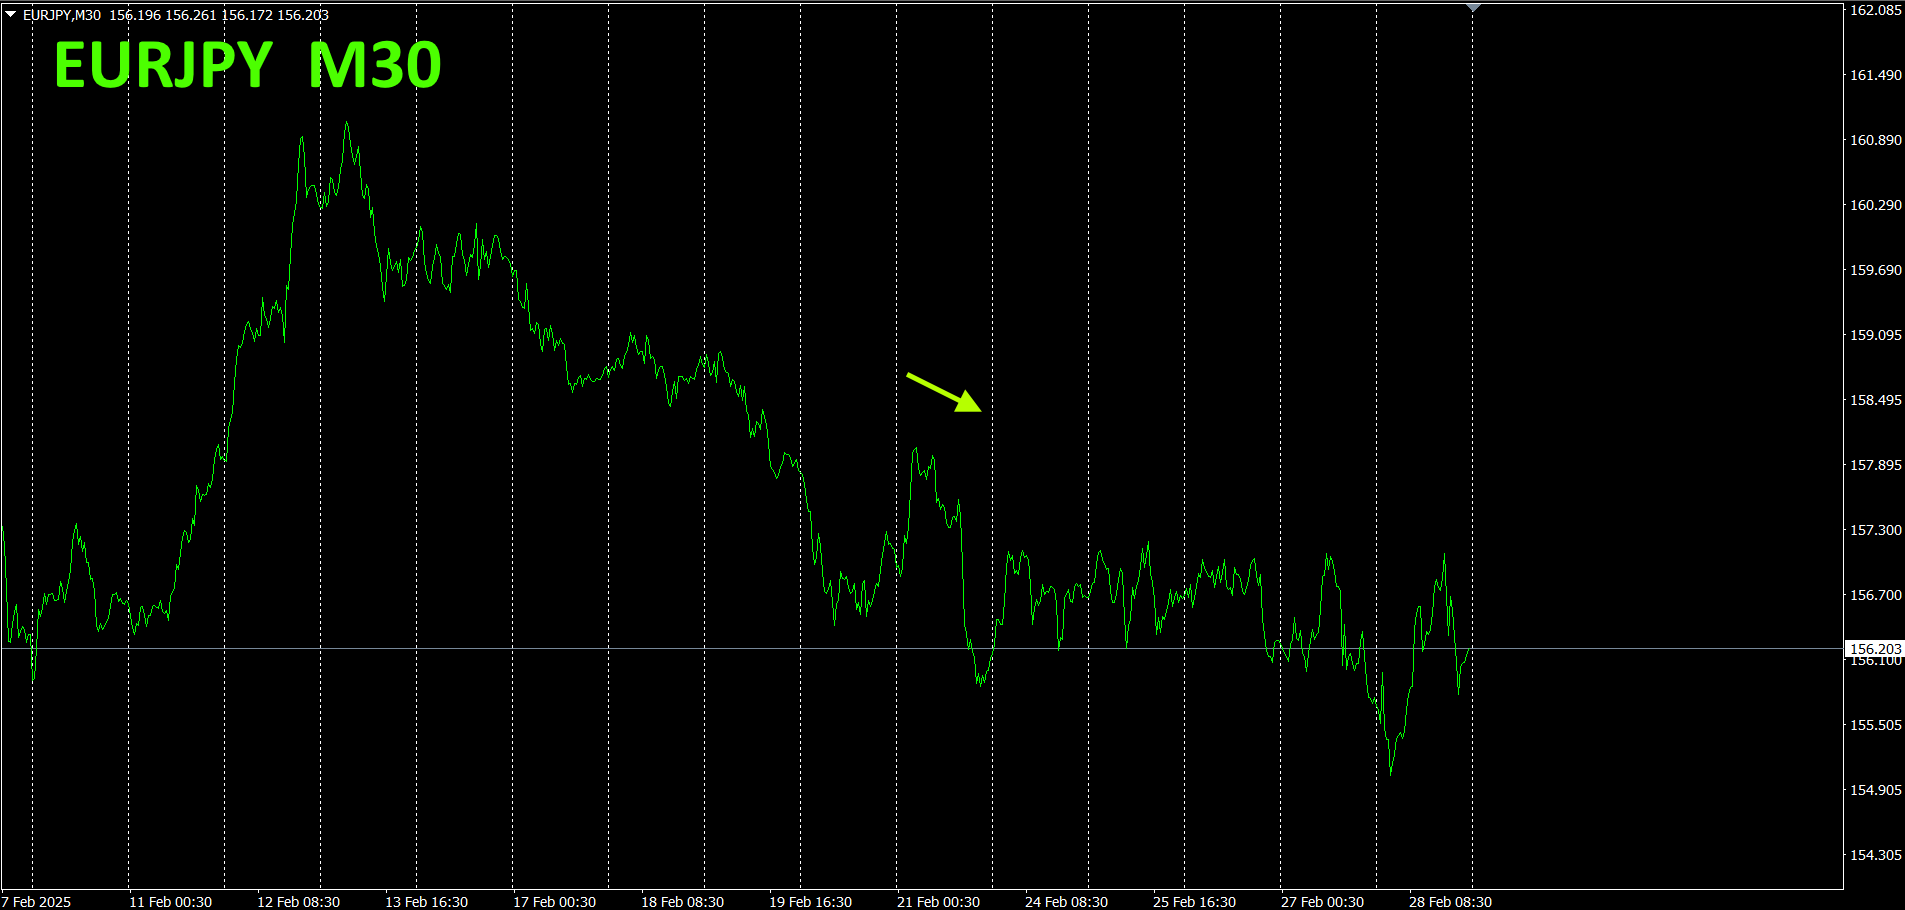
To view the overall trend, we plot approximately30 minutes of the most recent3 weeks.
Previously, I wrote the following:
Pink isEUR, green isJPY. In the currency strength chart, bothJPY andEUR are rising, but since the angle ofJPY is rising, EURJPY is expected to continue falling. However, if the currency strength chart forJPY hits a ceiling and reverses,EURJPY will rise.
Indeed, the upward movement is still heavy.
30 minutes currency strength chart.
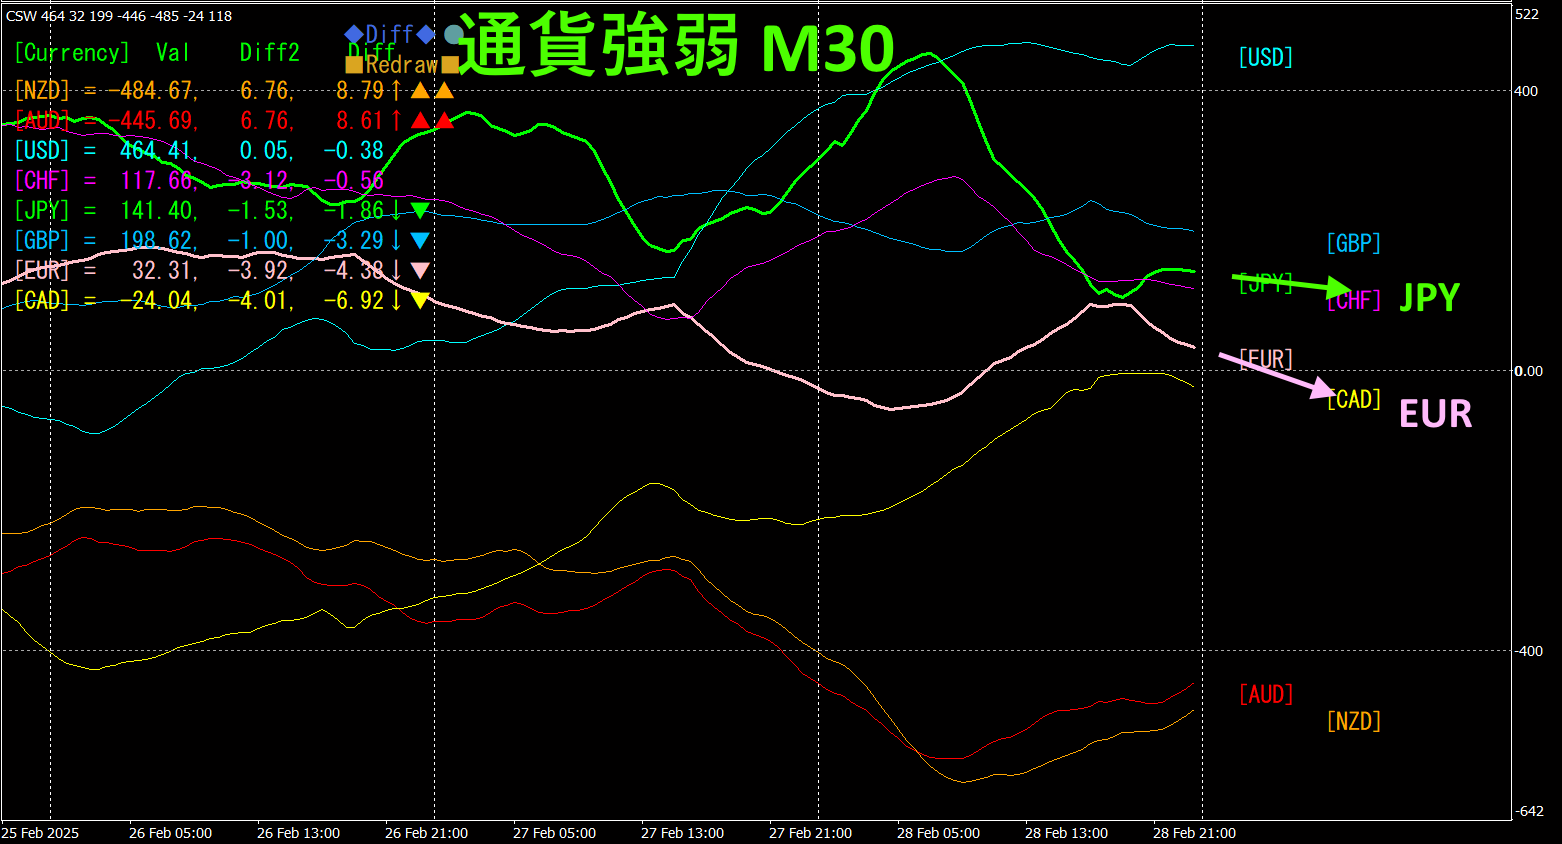
Pink isEUR, green isJPYJPY andEUR are downward, butJPYEUR, soEURJPY. In the currency strength chart, both is expected to continue downward.
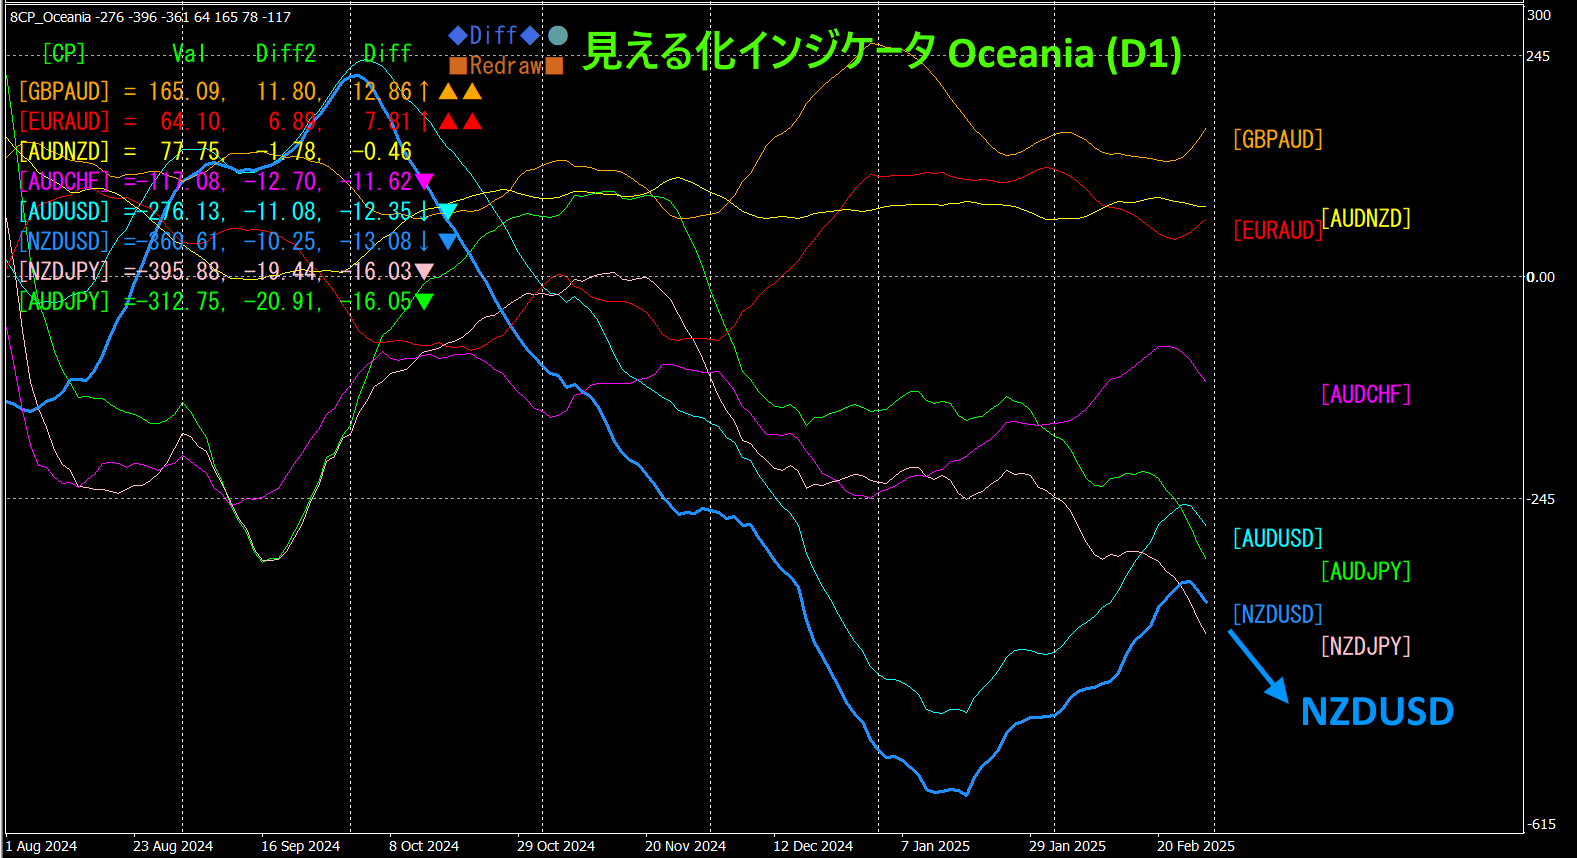
4. Use of "Visualization Indicator" on the daily chart
The figure below shows the daily chart display of the "8CP Visualization Indicator" Oceania edition.
NZDUSD has rebound from a bottom but has pulled back slightly. Going forward, it is expected to move upward in waves again, but those who hold long positions should close them for now and wait for another rise.
5. Recommended indicators
“Swap Target Indicator”

https://www.gogojungle.co.jp/tools/indicators/48183
“Toretore Indicator”
https://www.gogojungle.co.jp/tools/indicators/50115
“TrendLine-EX”
https://www.gogojungle.co.jp/tools/indicators/42257

“8C currency strength visualization indicator

MT4 version https://www.gogojungle.co.jp/tools/indicators/39150
MT5 version https://www.gogojungle.co.jp/tools/indicators/39159
【My listed products】


