USD/JPY near-term upside target (Elliott Wave - Point and Figure)
0.5 Yen Standard Frame P&F Chart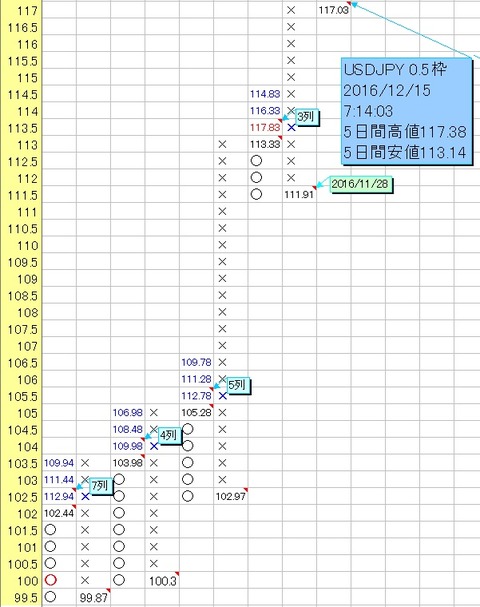
![]()
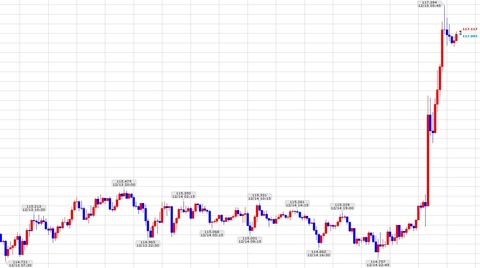
This morning, USD/JPY surged sharply.
From the 12/13 7:30 low of 114.721 yen as the starting point, we will calculate the upside target of the rising wave using the(values refer to the Platinum Chart on GMO Click Securities mentioned above).
If we take the 12/13 7:30 114.721 first wave start price, the 20:00 115.475 as the first wave high, and the 12/14 22:45 114.757 as the second wave low, the fifth wave target is calculated as 117.1609 yen ~ 117.9149 yen, and it already falls within the fifth wave target range.
Also, an upward signal has appeared on the USD/JPY 0.5 yen standard frame Point & Figure chart above, and the maximum target is calculated automatically by the tool as 117.83 yen.
From this, the near-term upside target seems to be around 117.83 yen.
For those who want to learn more about Elliott Wave Theory
Introduction to Points & Figures (Secret Chart) Screen
For those who want to learn more about Elliott Wave Theory
Introduction to Points & Figures (Secret Chart) Screen
For those who want to learn more about Points & Figures (Secret Chart)
InstaForex FX24 data can now generate time-frame and minute charts with MACD (YouTube video upload)
Multiple standard-frame Points & Figures (Secret Chart) can be generated at once (YouTube video upload)
Introduction and usage of the “Market Prediction Tool”