
[Very Important] How to Create a Trading Scenario
Hello everyone
This is Kuroshiba.
This time I would like to write about how to create a trade scenario that is essential for trading.
If you can't do this, you'll constantly need to watch the charts and won't be able to respond to unexpected moves, so it is very important.
Please read to the end.
Now, let's get started.

This is GOLD on the weekly chart.
The blue vertical zones mark the same month portions as the past and present—an indicator that helps identify them.
The weekly chart gives a rough grasp of the overall flow and trend.
For example, today is 2/26 and February is almost over.
At that time, after February ends, can't you see an upward tendency? (after the blue zone ends)
There is quite often this kind of tendency every year.
Just keeping that in mind can make you think a short position might be dangerous.
In the first place, such an upward trend makes it obvious to everyone that shorting is risky. Haha.
A weekly chart is fine to be roughly like this.
Generally, start by drawing recognizable structure and lines from the higher time frame.
Example) Weekly → Daily → 4-hour → 1-hour → 15-minute (I use 15-minute for trading timeframes)

Gold daily chart
On the daily, drop down from the weekly to check the rough direction and trend, and confirm lines and zones.
I only draw lines and zones on the daily and 4-hour charts (recommended).
This is really a part that should be consciously watched & support/resistance as well.
Most of you probably draw as in the picture.
After drawing the lines that are noticeable on the daily chart, drop to the 4-hour chart.
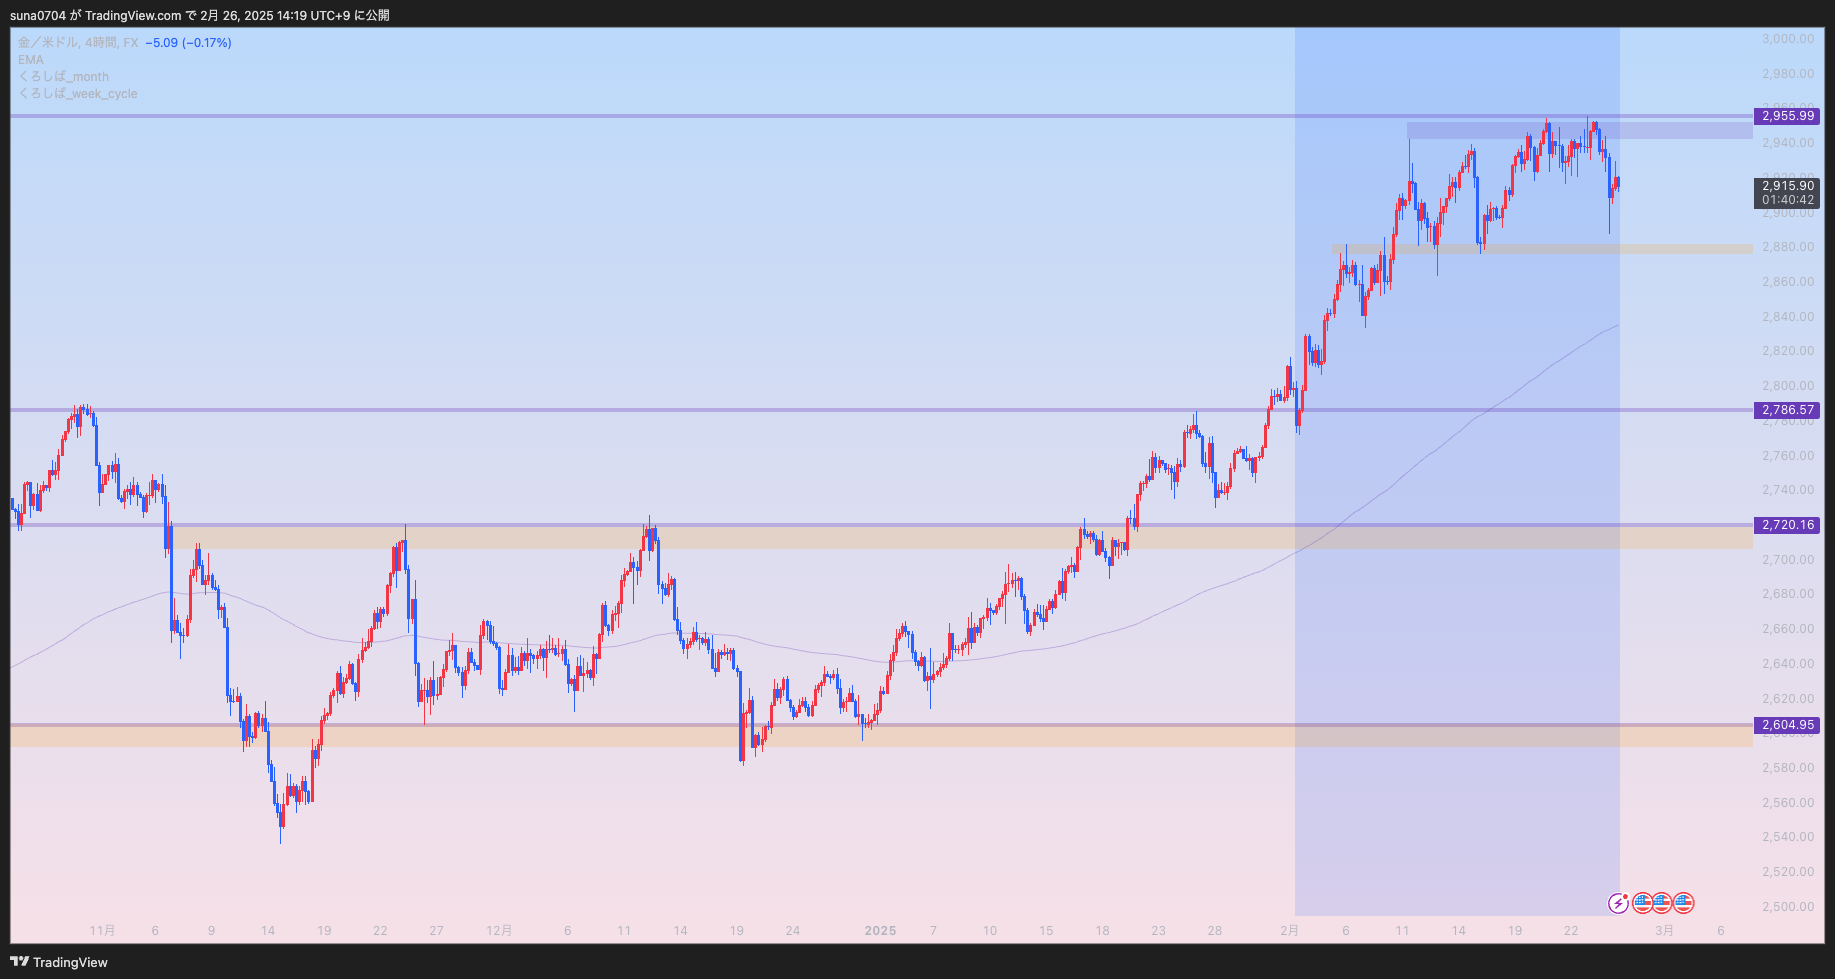
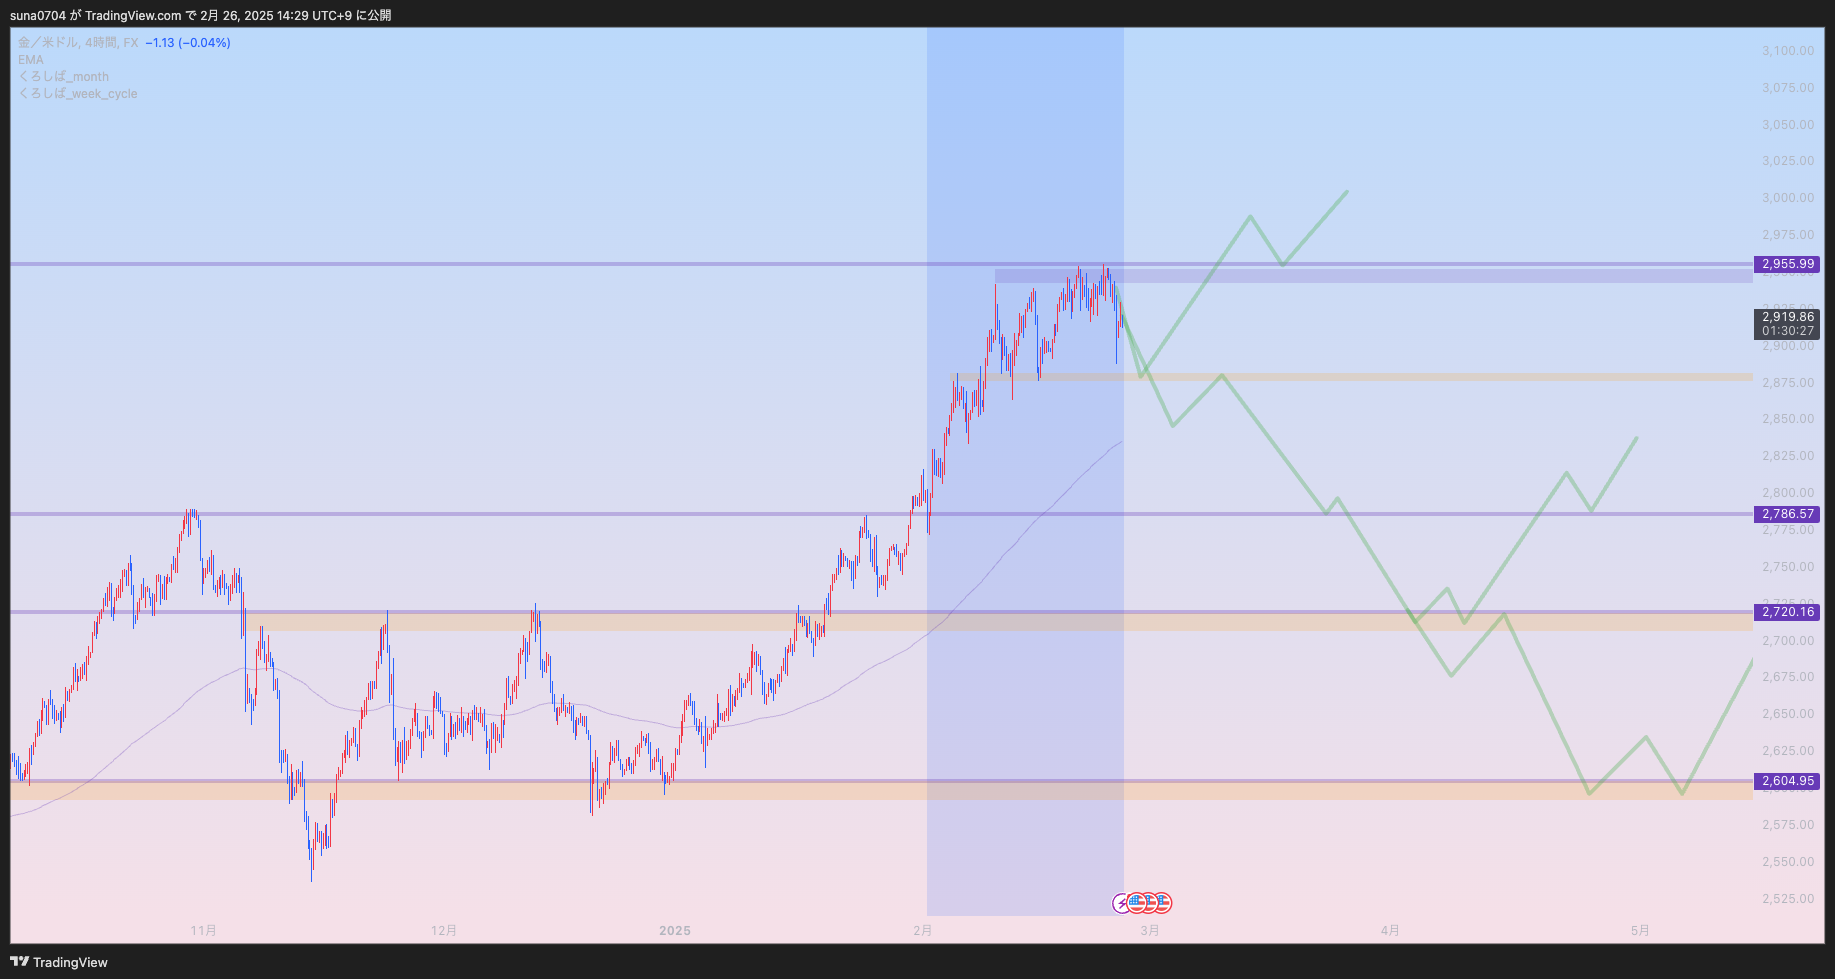
Yes, I drew zones on the 4-hour chart.
As for how to draw zones, the rough answer is to draw where the bodies and wicks cluster, but this area is
described in the text I have published, so please refer to it if you're curious.
As shown in the image, once the zones are drawn, it's easy thereafter.
Set alerts for each zone, and just watch the price action when it comes and buy.
I wrote the anticipated scenario with a green line.

Something like this, I think.
People might say, "Where will it stop? Guess it," but that's impossible.
Somethingprice movement when it comesIf you can't trade by watching that, you'll never win in the long run.
Here is the foreshadowing of the initial weekly environment recognition, but February is ending, you know.
And if there is a tendency to rise at the beginning of March, I think there isn't much time for it to drop to the two lower zones.
If GOLD remains strong, while continuing in the current range, I think it will form a horizontal axis at the top zone and rise.
If it breaks through, just wait for the next zoneSo, it is important to have a plan.
This is how I shared the method for trading scenarios.
If you have any questions, please ask in any form and I will answer!
I hope it is at least a little helpful.