

Usage of the “Visualization Indicator” (Part 187)
Usage of the "Visualization Indicator" (its187)
1. Evolving the "28 Currency Pair List Indicator" into a more advanced indicator
"8CPVisualization Indicator"to plotCADJPY.
"8CPVisualization Indicator" includesOceania版,London版,NewYork版,AnyCP版。今回はNewYork
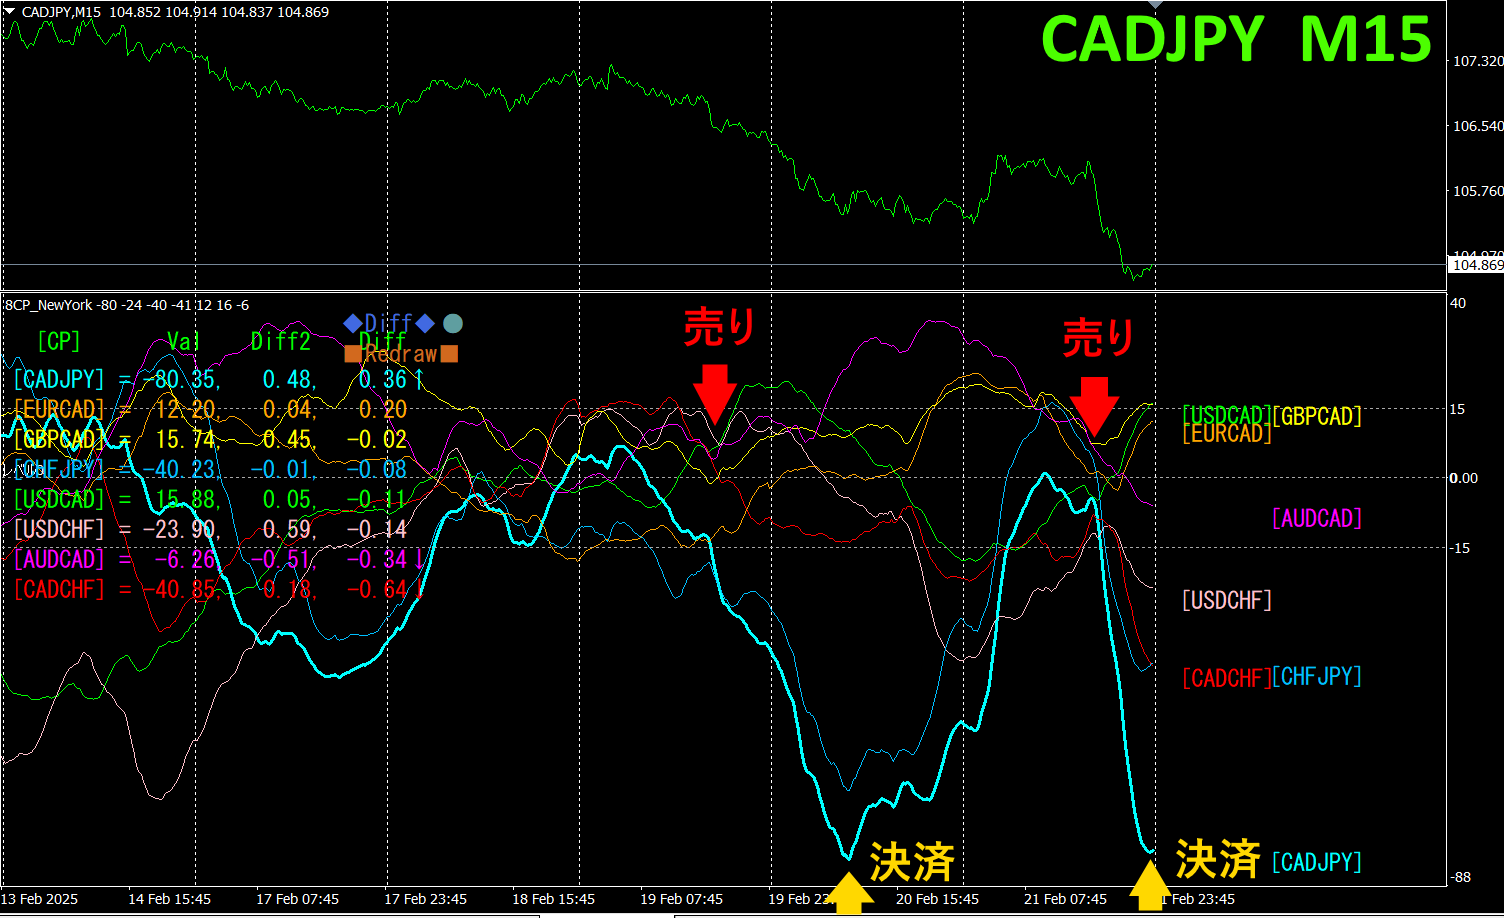
The upper half is CADJPY's15-minute chart. The lower half shows results from the "8CPVisualization Indicator"; the light-blue bold line graph corresponds to CADJPY.
There were two selling opportunities on Wednesday and Friday. Overall, the trend is downward, so focus on selling. Sell when the price breaks below the group of charts for other currency pairs, and close at the bottom. The first gain was about100pips, the second about90pips, totaling about190pipsprofit.
If you usedTrendLine-EX, entries and exits could be automated by breaking the trendline. You can leave it as is for easy trading. "TrendLine-EX" is a semi-automatic EA that can sell automatically on a downward break of the trendline and automatically close on an upward break.
2. Best SelectTry the indicator
The following figure is the screenshot taken on2025 year2月19日15:35(JST)
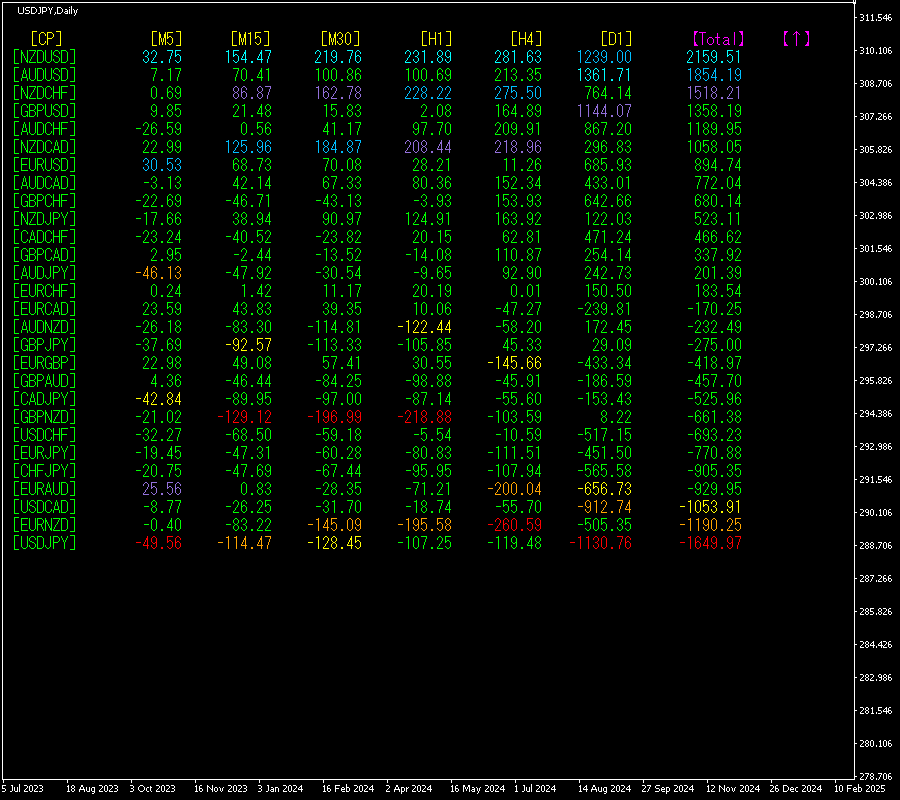
[Total]The numbers are arranged in descending order. At the very top,NZDUSD shows blue color across all timeframes.Total value is2159.51, a large positive figure. This suggests an uptrend forNZDUSD.
Now, let's look at theNZDUSD chart.
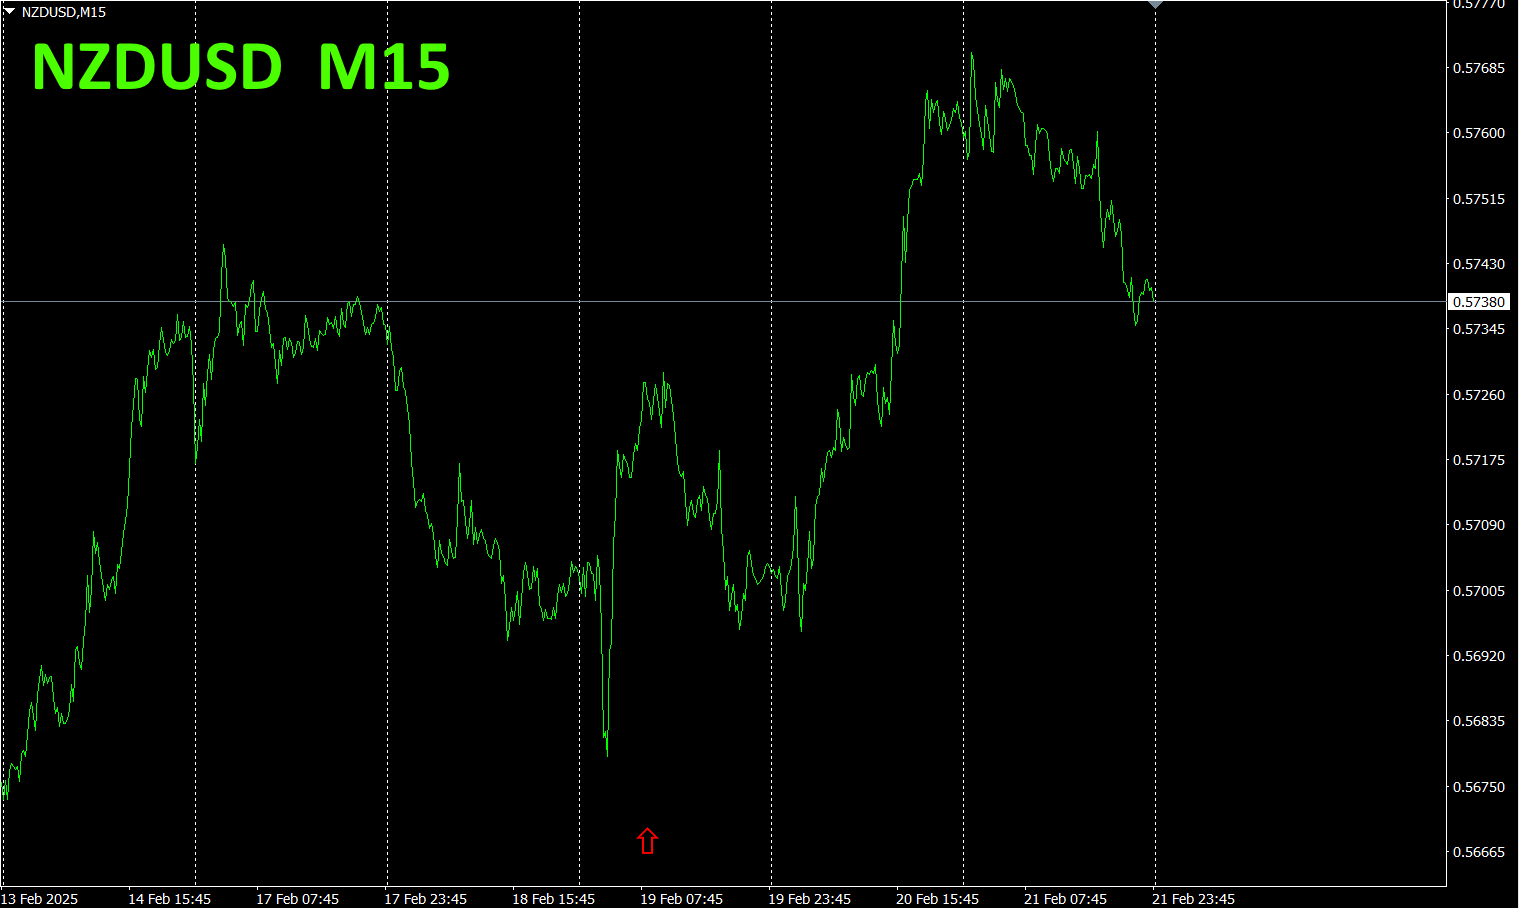
The red arrows mark where the screenshot was taken, accurately capturing the uptrend areas.
"28 Currency Pair Best Select Indicator" enables you to readily identify which currency among 28 pairs has the strongest trend. It also tells you whether to trade now using numerical and color cues. It allows you to judge all currency pairs at a glance, making it an excellent indicator.
"28 Currency Pair Best Select
https://www.gogojungle.co.jp/tools/indicators/35128

3. 2021年5月から追っているEURJPYの動きはどうなった?
From年5月、EURJPY
To get the overall trend, a30分足 chart shows about the last3 weeks.
Last time, it was written as follows.
Pink isEUR, green isJPY. In the currency strength chart,JPY is slightly up,EUR is slightly down, so the futureEURJPY is expected to move downward slightly.
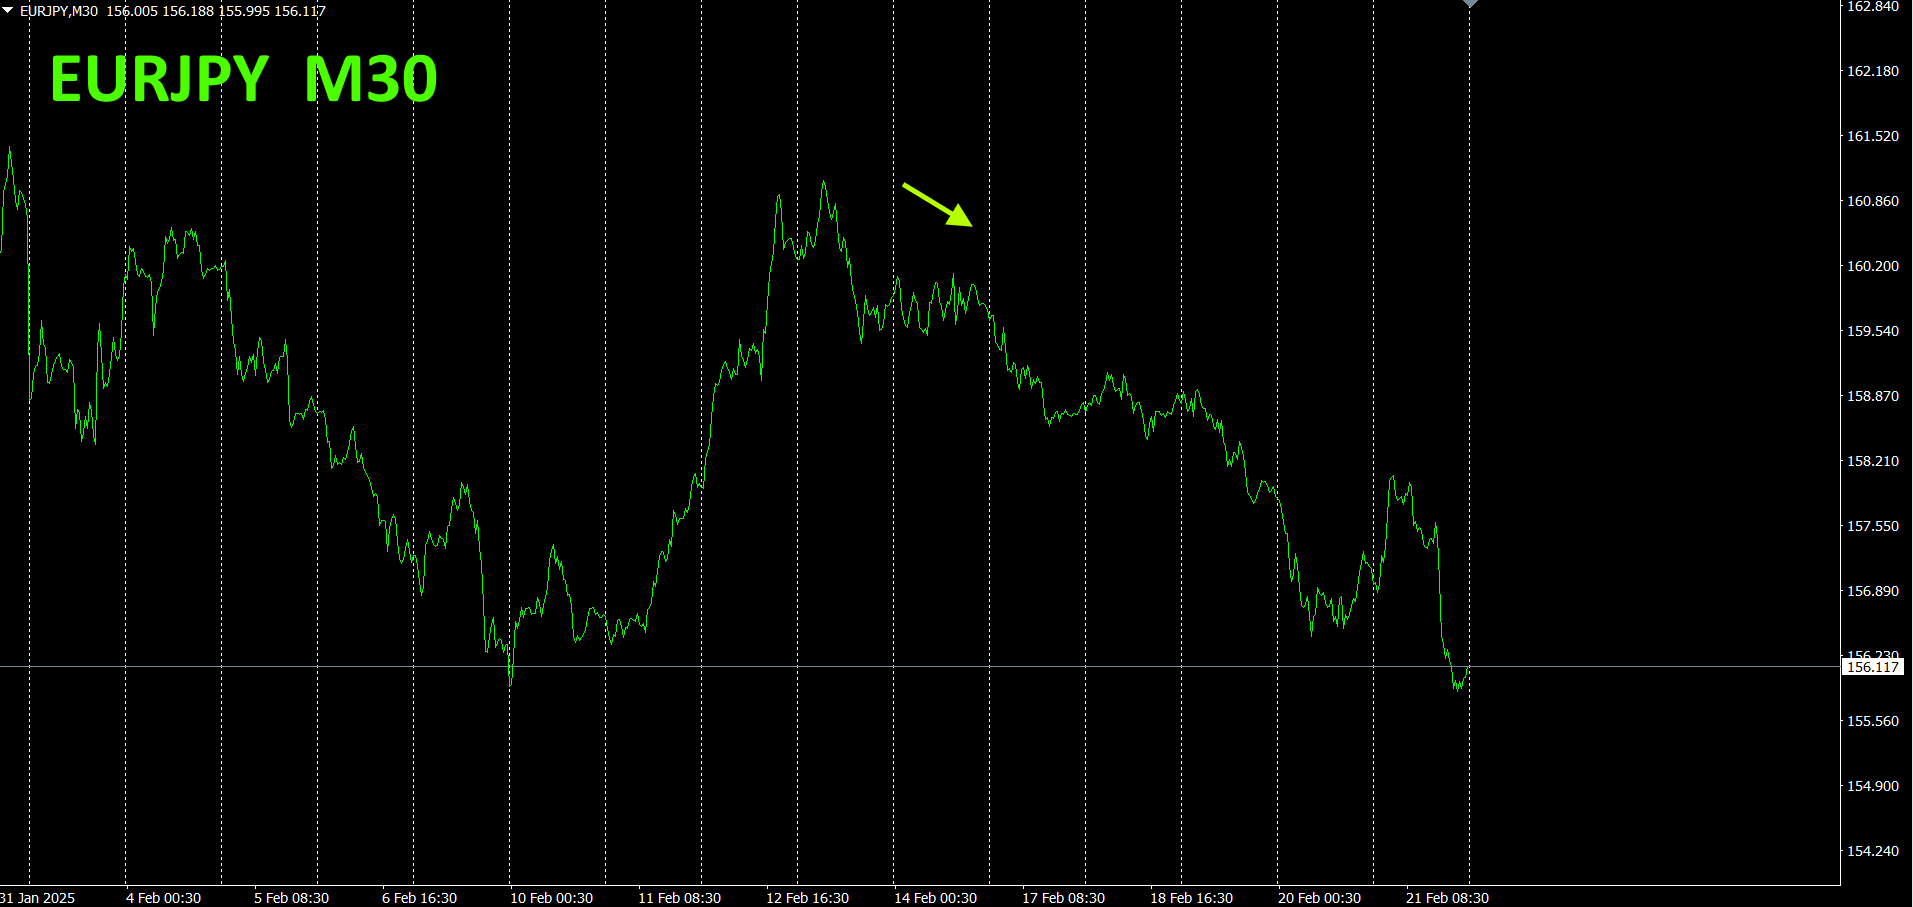
As predicted, it declined.
30-minute currency strength chart.
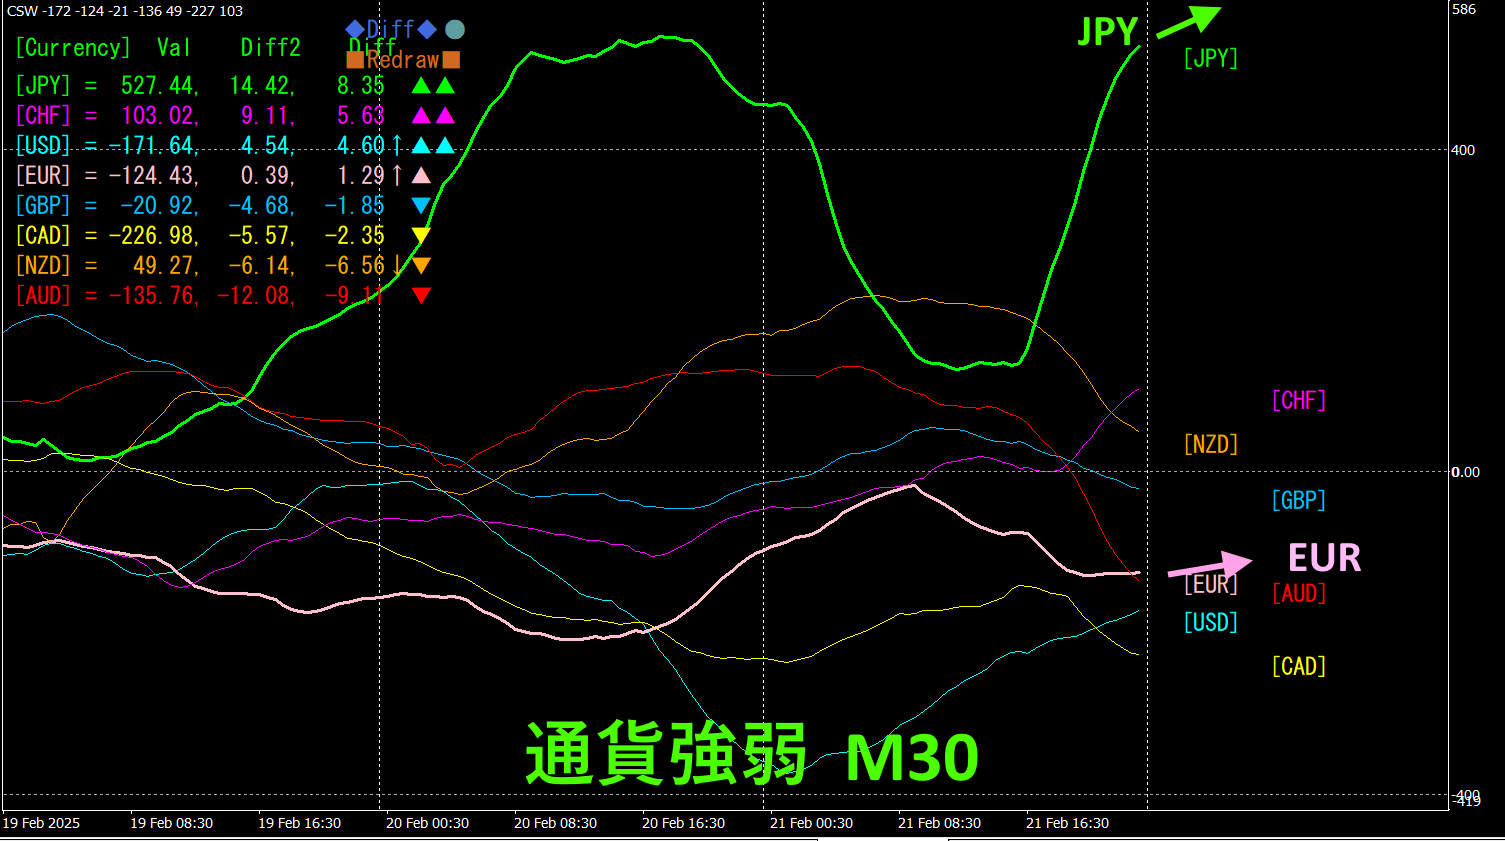
Pink isEUR, green isJPY. In the currency strength chart, bothJPY andEUR are rising, butJPY has a steeper ascent, soEURJPY is expected to continue downward. However, if the currency strength chart forJPY hits a ceiling and reverses,EURJPY may start rising.
4. Try using the Visualization Indicator on a daily chart
The image below shows the "8CP Visualization Indicator" Oceania版 on a daily chart.
Compared to last week,NZDUSD has risen further. Since this is a daily chart with a solid upturn, at least a return to the zero line is expected. For daily trades, hold for several months (more than a month and a half) to enjoy accumulated unrealized gains.
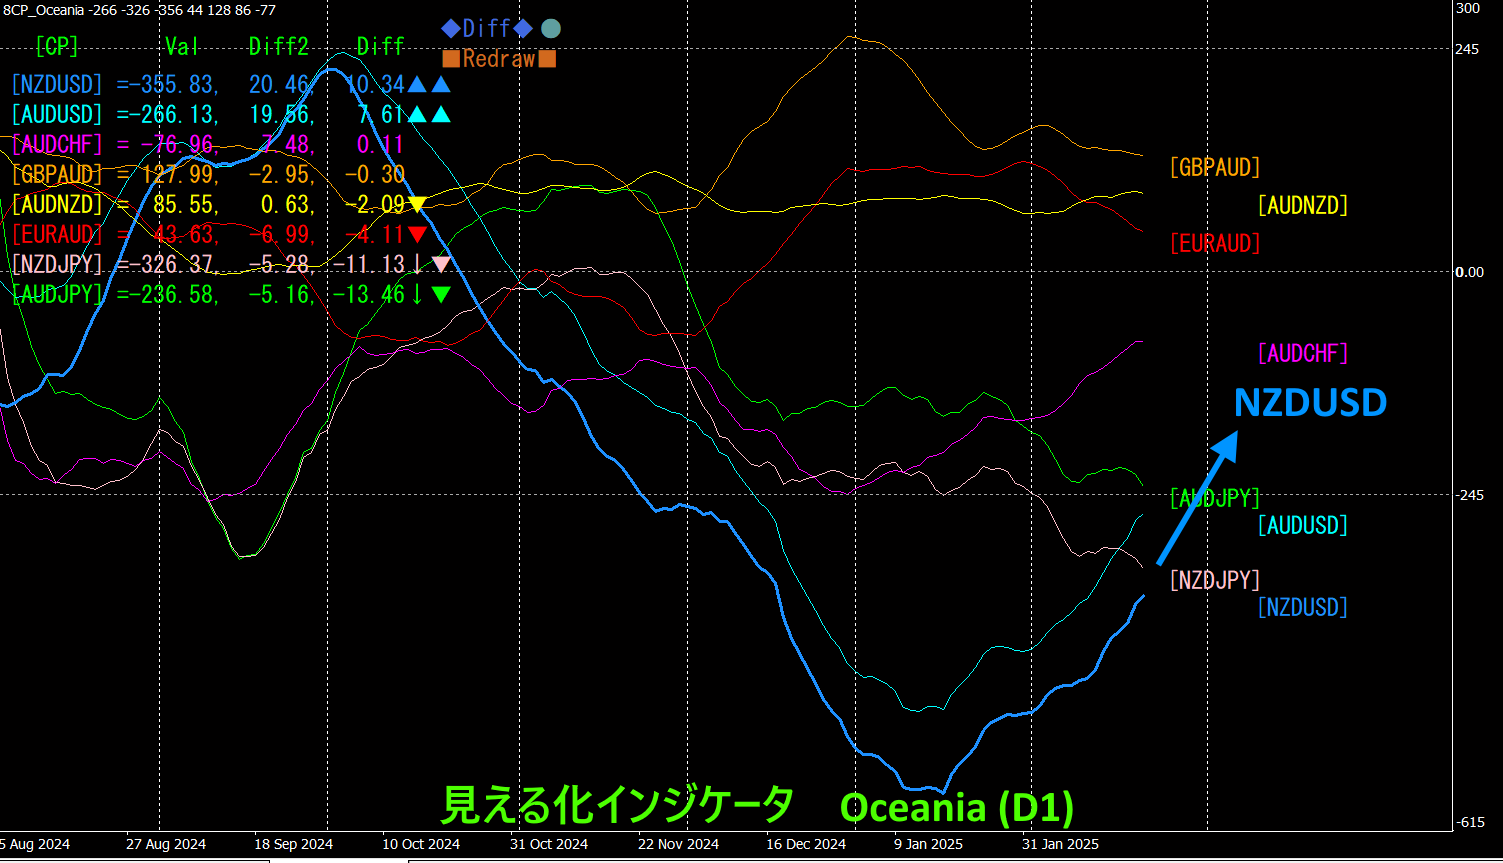
If bought near the bottom, unrealized gains exceed150pips already.
5. Recommended indicators
"Swap Targeting Indicator"

https://www.gogojungle.co.jp/tools/indicators/48183
"Toretore Indicator"
https://www.gogojungle.co.jp/tools/indicators/50115
"TrendLine-EX"

https://www.gogojungle.co.jp/tools/indicators/42257
"8Currency Strength Visualization Indicator" please refer to the following pages.

MT4版 https://www.gogojungle.co.jp/tools/indicators/39150
MT5版 https://www.gogojungle.co.jp/tools/indicators/39159
【My listed products】


