
A major trend reversal has occurred in the dollar/yen pair! What techniques work in this kind of market environment?
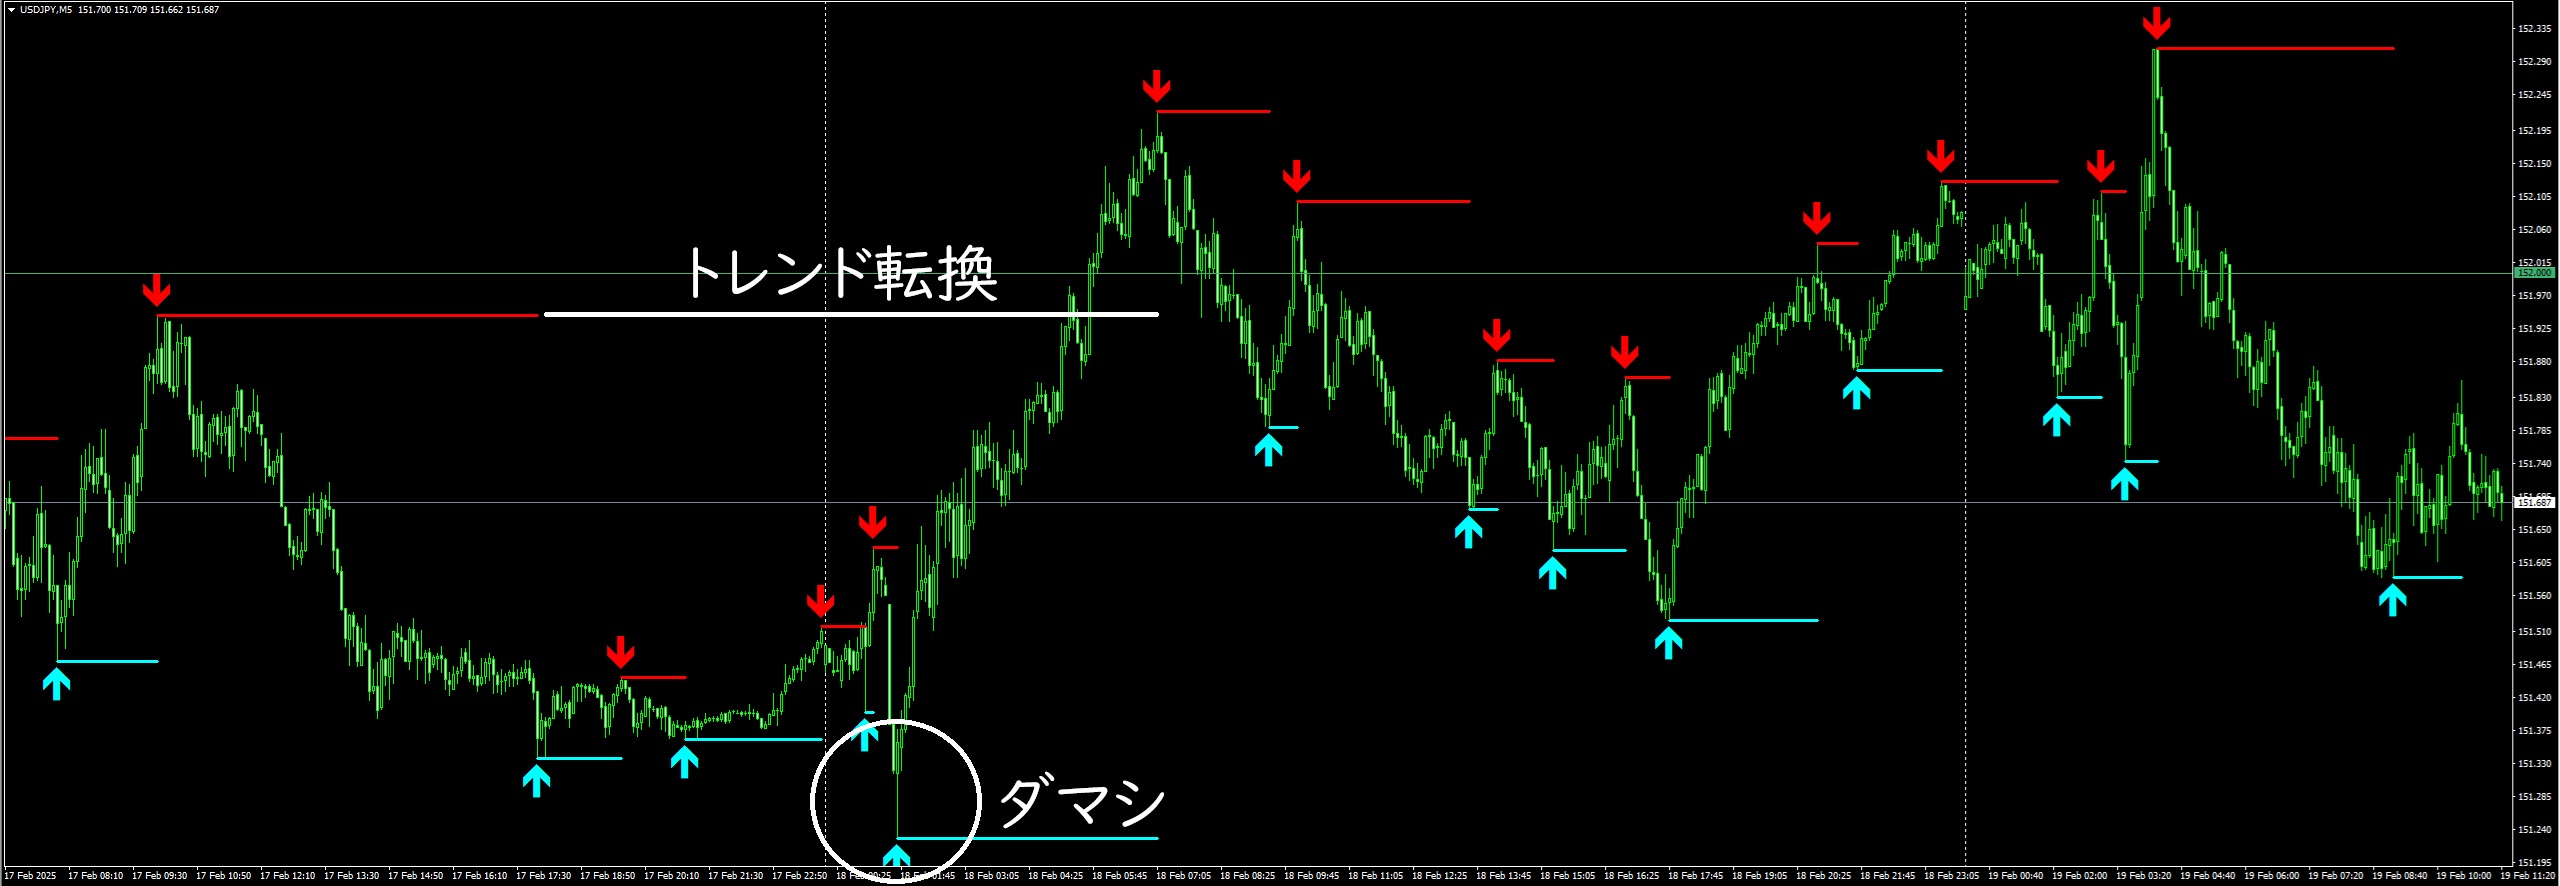
As of now (February 19, 2025, 18:30) the USD/JPY 5-minute chart. It’s unusually written in the evening.

As I mentioned in this morning's video, yesterday there was a trend reversal that involved a false move (fakeout).
This reversal can also be observed on 1–4 hour timeframes, so a period of choppy volatility is expected to continue for a while.
Needless to say, a trend reversal is a reversal phenomenon that overturns the previous flow.
That reversal requires energy. For example, imagine a ship changing direction.
The energy required and the time needed differ between a small fishing boat turning and the world's largest ship, the Knock Nevis (an oil tanker registered in Norway), turning, of course.
FX trend reversals are the same: whether it’s a 1-minute timeframe reversal or a 4-hour timeframe reversal affects the expectations and strength required, and the time until the next trend occurs also differs.
In the current 5-minute chart, the many arrows displayed are evidence of a loss of directional clarity.
In such a situation, the standard approach is to trade against the trend (counter-trend).
The original indicator I use can be downloaded for free.
↓ Download here