

Usage of the "Visualization Indicator" (Part 186)
Usage of "Visualization Indicator" (its186)
1. Further develop and evolve the "28 Currency Pairs List Indicator" into the indicator
"8CPVisualization Indicator" to drawGBPJPY.
The "8CPVisualization Indicator" includesOceania version,London version,NewYork version,AnyCP version. This time, I used theLondon version.
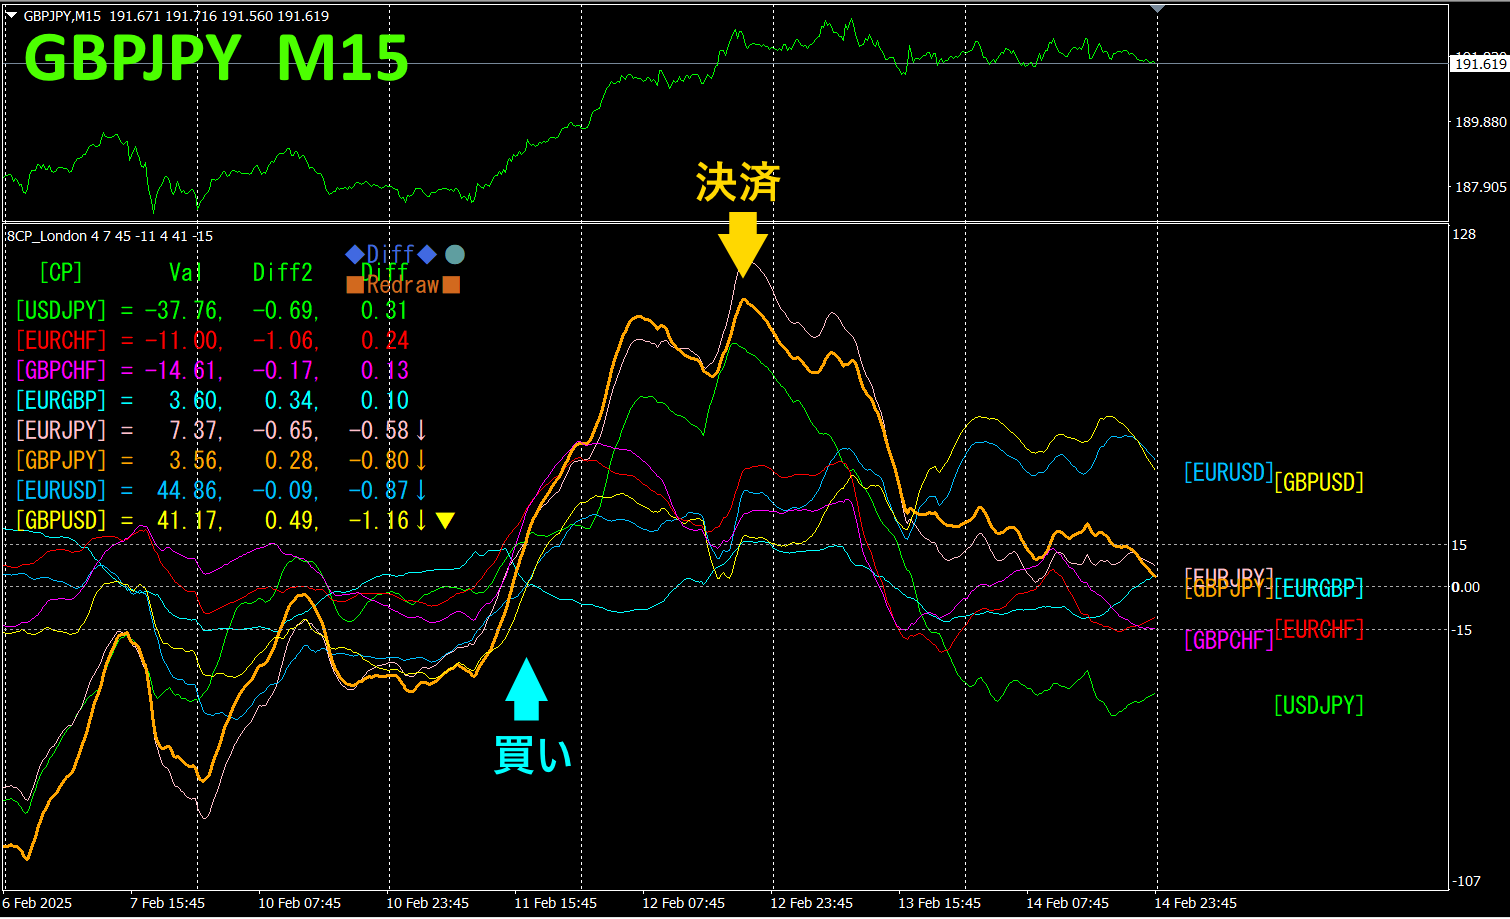
The top half is theGBPJPY 15-minute chart. The bottom half is from the “8CP Visualization Indicator”; the orange thick-line graph corresponds toGBPJPY.
Buying on Tuesday and closing on Wednesday yielded about360pips of profit.
If you use theTrendLine-EX, entering and exiting can be automated via a diagonal trendline break. Since you can just leave it be, it enables easy trading. TheTrendLine-EX is a semi-automated EA that sells automatically on a break below the trendline and closes automatically on a break above it.
2. Best Select Try the Indicator
The figure below is a screenshot taken on2025 year2 month14 day 00:34 (JST)
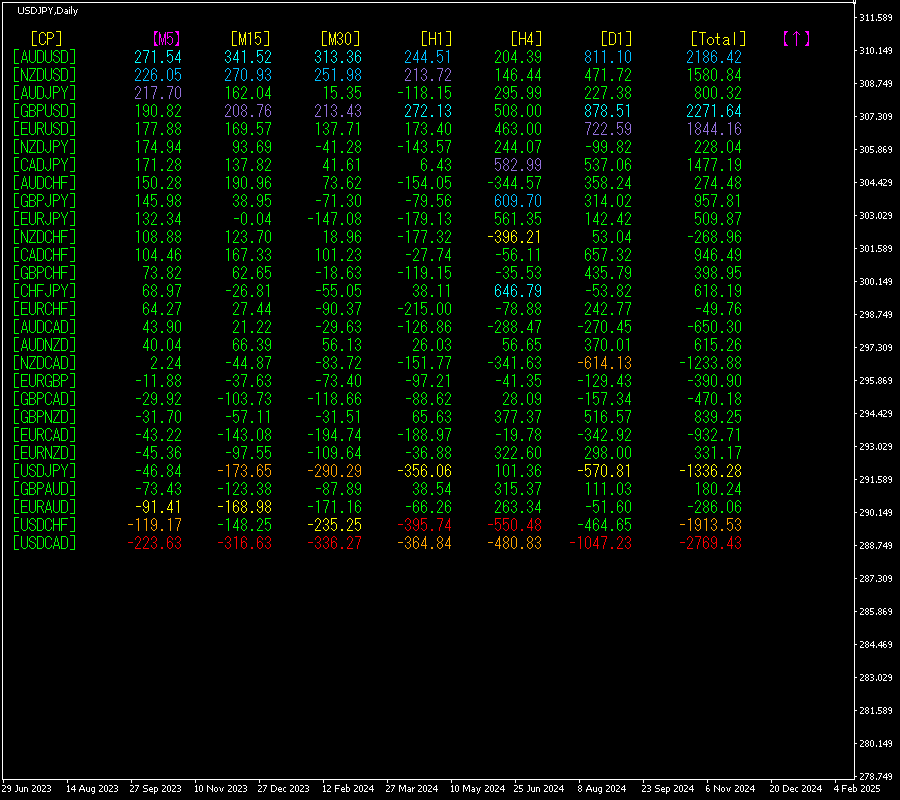
[M5]Values are ordered in descending order. At the bottom, USDCADis shown in red across all timeframes.Total value is-2769.43, a large negative number.USDCAD indicates a downtrend.
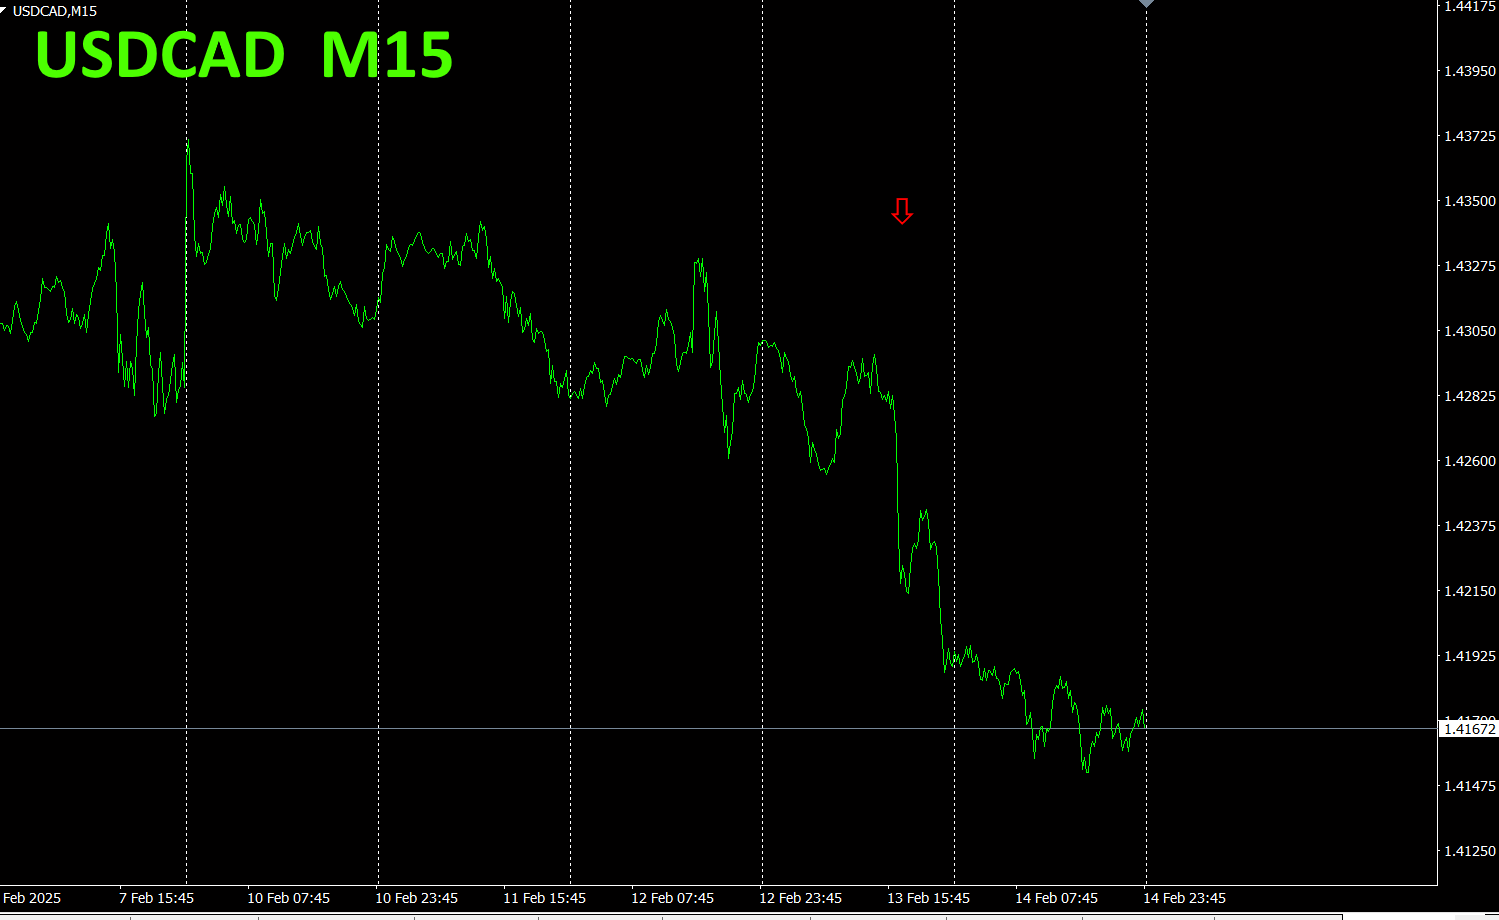
Now, let's look at theUSDCAD chart.
The red arrows mark where the screenshot was captured. It captures the final steep plunge of the downtrend.
“28 Currency Pairs Best Select Indicator allows you to easily identify which currency among 28 pairs is experiencing the strongest trend. It also tells you, with numbers and colors, whether you should trade now. It is an excellent indicator for quickly assessing all currency pairs at a glance.
“28 Currency Pairs Best Select

https://www.gogojungle.co.jp/tools/indicators/35128
3. 2021 year5 month onwards EURJPY movement?
From year2021 month5 EURJPY month, we have been tracking moves.
To view the overall trend,30-minute chart shows roughly the last3 weeks.
Last time, I wrote the following.
Pink isEUR, green is. In the currency strength chart,JPYJPY is the strongest currency,EUR is becoming the weakest. Therefore, future EURJPY is expected to move clearly downward.
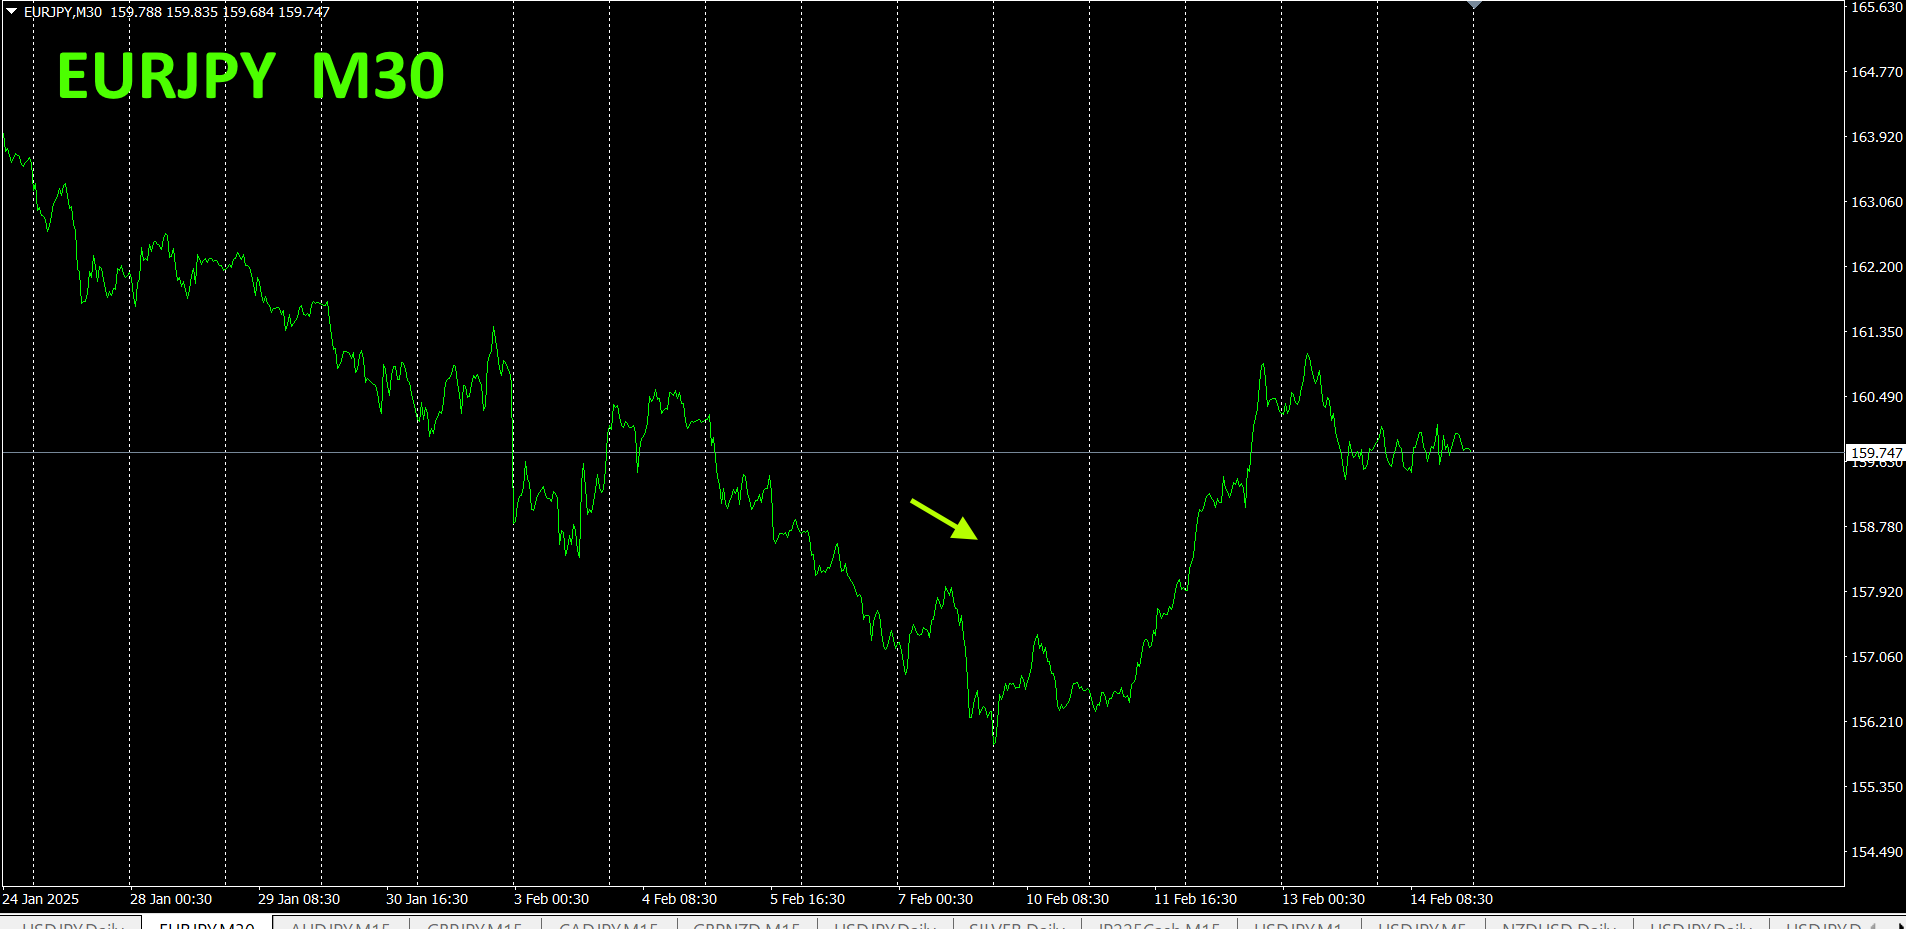
I expected a drop, but it halted and reversed upward.
30-minute currency strength chart.
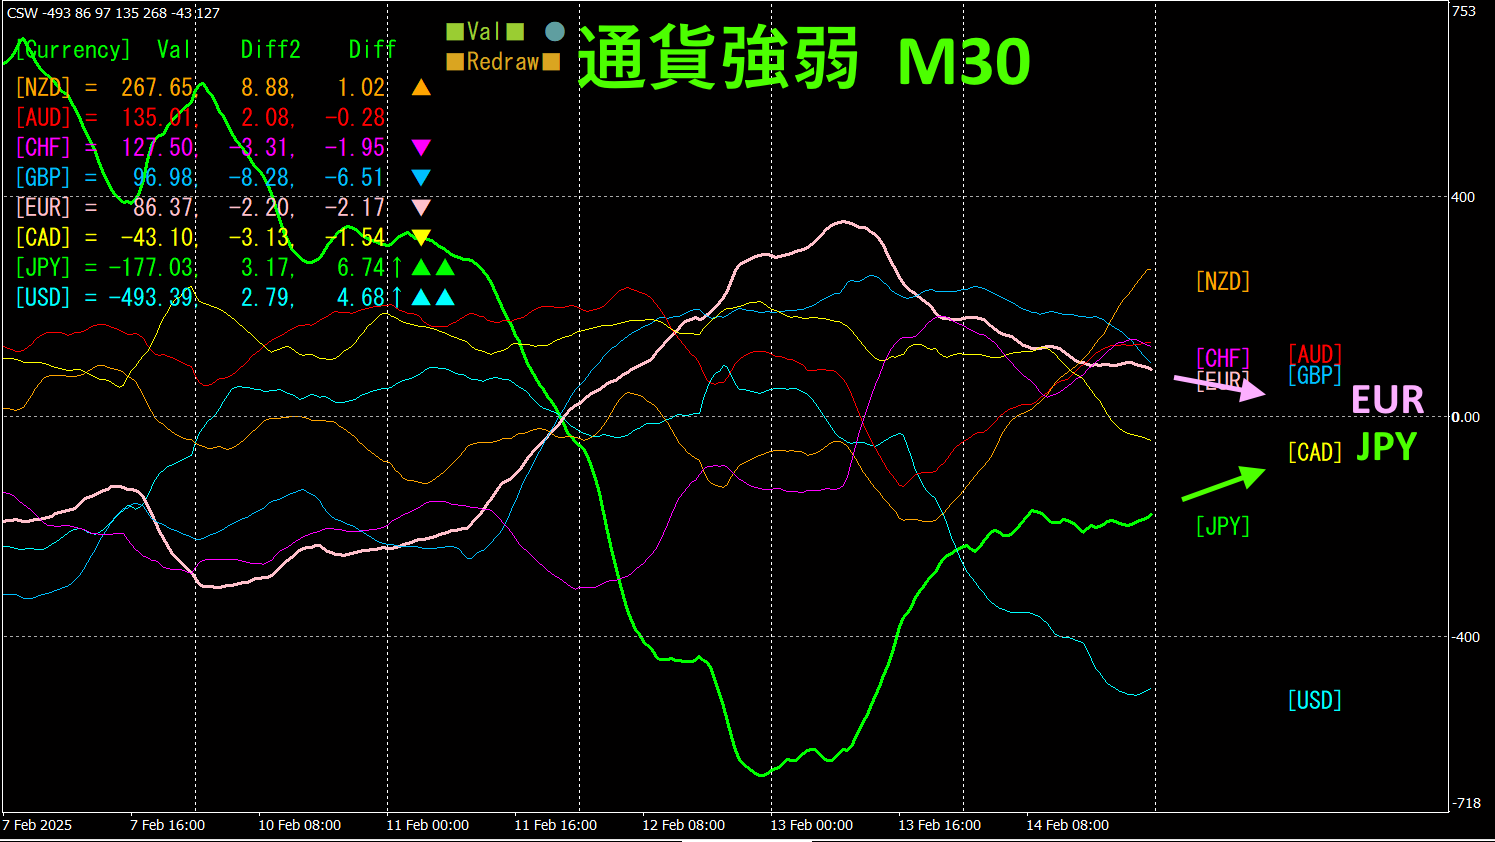
Pink isEUR, green isJPY. In the currency strength chart,JPY is slightly upward, is slightly downward, so futureEUR EURJPY is expected to trend slightly downward.
4. Using the Visualization Indicator on the Daily Chart
The figure below shows the daily display of the “8CP Visualization Indicator” Oceania version.
Compared with last week,NZDUSD has risen further. On a daily basis, it has clearly reversed upward, so further gains are expected.
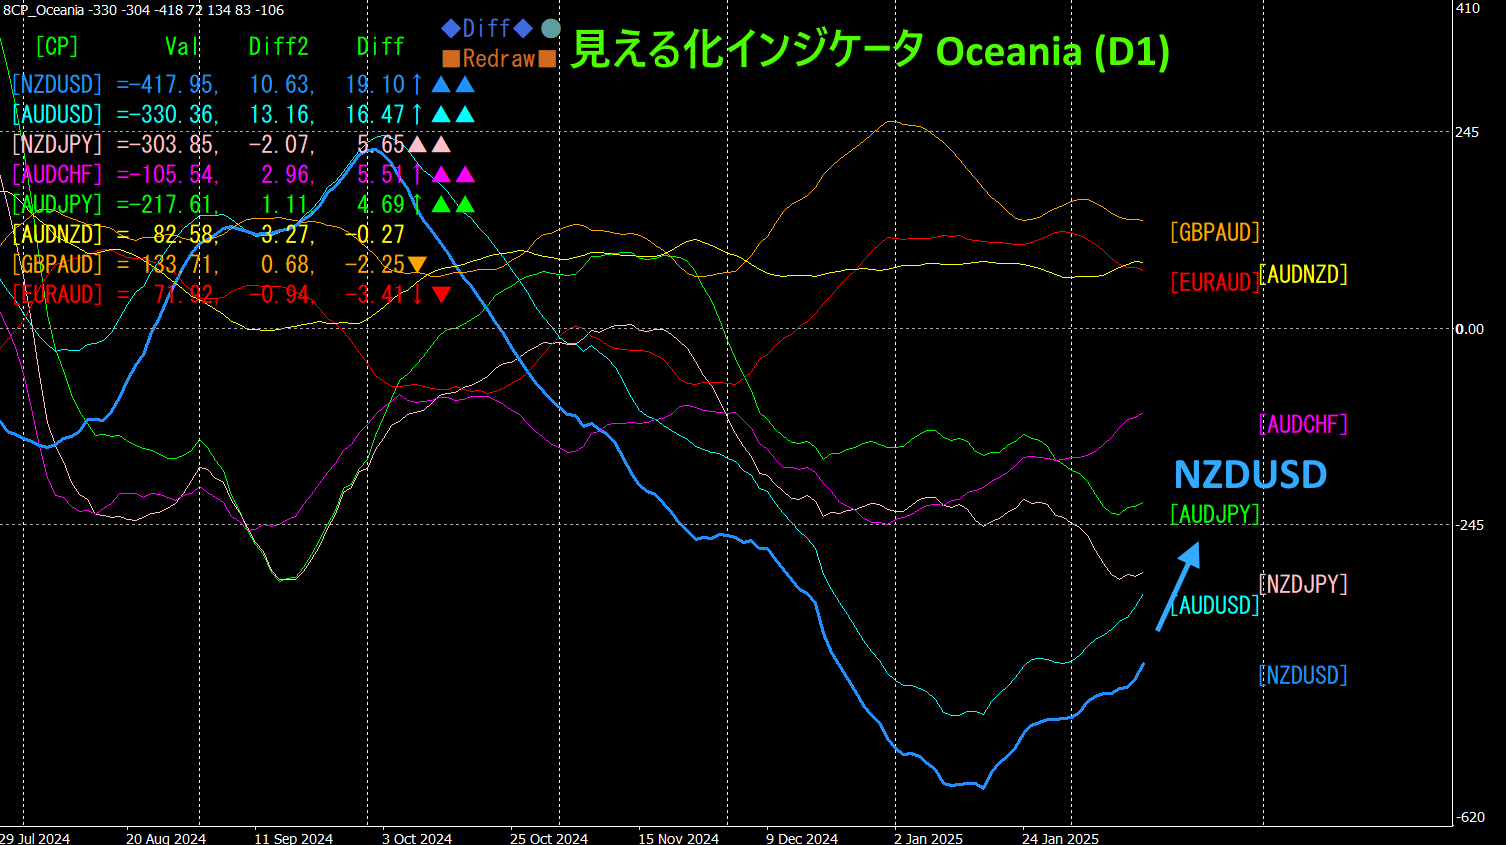
From now on, over the coming months, you can hold long positions inNZDUSD and trade while enjoying growing unrealized profits.
5. Recommended Indicators
“Swaptarget Indicator”

https://www.gogojungle.co.jp/tools/indicators/48183
“Toretore Indicator”
https://www.gogojungle.co.jp/tools/indicators/50115
“TrendLine-EX”

https://www.gogojungle.co.jp/tools/indicators/42257
“8C Currency Strength Visualization Indicator” please refer to the following page.

MT4 version https://www.gogojungle.co.jp/tools/indicators/39150
MT5 version https://www.gogojungle.co.jp/tools/indicators/39159
【My items for sale】


