Capture only the "winning shape" and enter! (February 10)
0
Today (2/10)
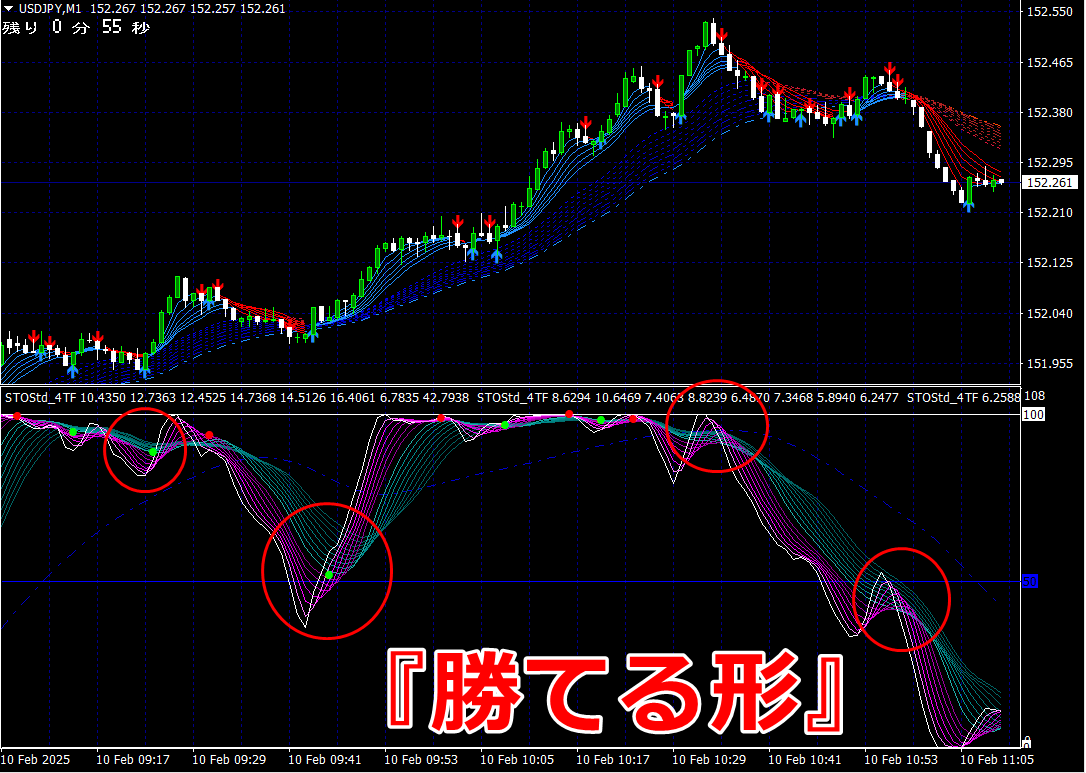
【Winning Pattern】Capture it and enter!
(USDJPY 1-minute chart)
【Winning Pattern】Capture it and enter!
(USDJPY 1-minute chart)
★After the signal lights up, the pink band rises up over the green band,
or, a shape that covers it forms then a guaranteed win entry!
★After the signal lights up, the pink band rises up over the green band,
or, a shape that covers it forms then a guaranteed win entry!
(Click the image to enlarge)
What is the “Winning Pattern”?
An indicator that lets you learn entry points by sight
Specialized for short-term trading in binary options and forexWe reveal a rock-solid entry method with a “1-minute chart indicator.”
<The entry steps are①②—easy!>
In an uptrend,

①Prepare to enter when the arrow signal lights up.
②While the arrow signal is lit,the pink band of the indicator rises from below to cover the green bandupwardshape,then enter on a high (call) option with a 1-minute or 3-minute timeframe just before the current candle closes or right after it closes.
※Signal lighting does not mean entry is automatic, so if the indicator does not rise to cover the green band, do not enter (signals to enter occur only a few times).(Frequency of entries at signal lighting is about once in a few times.)
※On a 1-minute chart, there are dozens to about 100 entry opportunities per day
“Capture only the Winning Pattern and enter!”
< The shape that rises to cover the green band=What is the Winning Pattern? >
Points where similar entries are possible exist, in the indicator shape like the image below.
What is the “Winning Pattern”?
An indicator that lets you learn entry points by sight
Specialized for short-term trading in binary options and forex
We reveal a rock-solid entry method with a “1-minute chart indicator.”
<The entry steps are①②—easy!>
In an uptrend,
①Prepare to enter when the arrow signal lights up.
②While the arrow signal is lit,the pink band of the indicator rises from below to cover the green bandupwardshape,then enter on a high (call) option with a 1-minute or 3-minute timeframe just before the current candle closes or right after it closes.
※Signal lighting does not mean entry is automatic, so if the indicator does not rise to cover the green band, do not enter (signals to enter occur only a few times).(Frequency of entries at signal lighting is about once in a few times.)
※On a 1-minute chart, there are dozens to about 100 entry opportunities per day
“Capture only the Winning Pattern and enter!”
< The shape that rises to cover the green band=What is the Winning Pattern? >
Points where similar entries are possible exist, in the indicator shape like the image below.
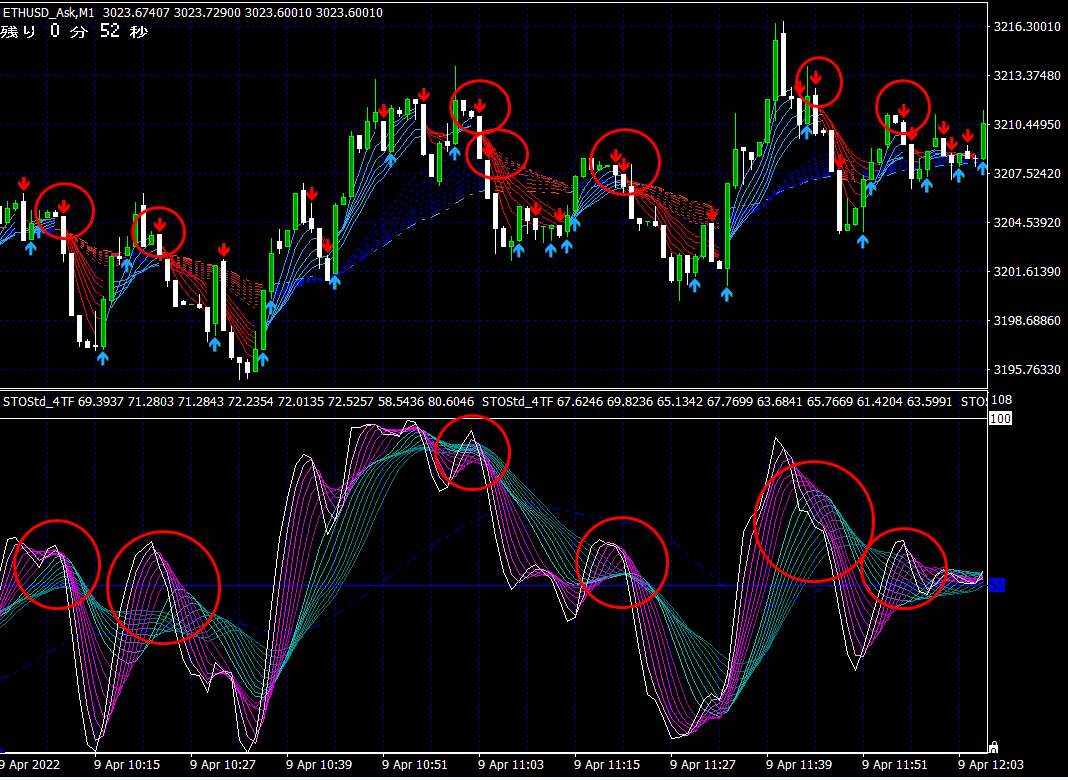
In a downtrend,
①Prepare to enter when the arrow signal lights up.
②While the arrow signal is lit,the pink band of the indicator covers the green bandover from abovedownward,then enter a low (put) option with a 1-minute or 3-minute timeframe just before the current candle closes or right after it closes.
※Signal lighting does not mean entry is automatic, so if the indicator does not cover the green band, do not enter (signals to enter occur only a few times).(Frequency of entries at signal lighting is about once in a few times.)
※On a 1-minute chart, there are dozens to about 100 entry opportunities per day
“Capture only the Winning Pattern and enter!”
< The shape that covers the green band=What is the Winning Pattern?>
Points where similar entries are possible are the indicator shapes shown in the image below.
For details and purchase of the indicator, click here!
1-minute indicator 3-layer, 3-color wave indicator


× ![]()