

Utilization of the "Visualization Indicator" (Part 185)
“Visualization Indicator” usage (part185)”
1. Further develop the “28 Currency Pair List Indicator” into an indicator
“8CPVisualization Indicator”to draw NZDUSDNZDUSD.
The “8CPVisualization Indicator” includesOceania version,London version,NewYork version,AnyCP version. This time, we used theOceania version.
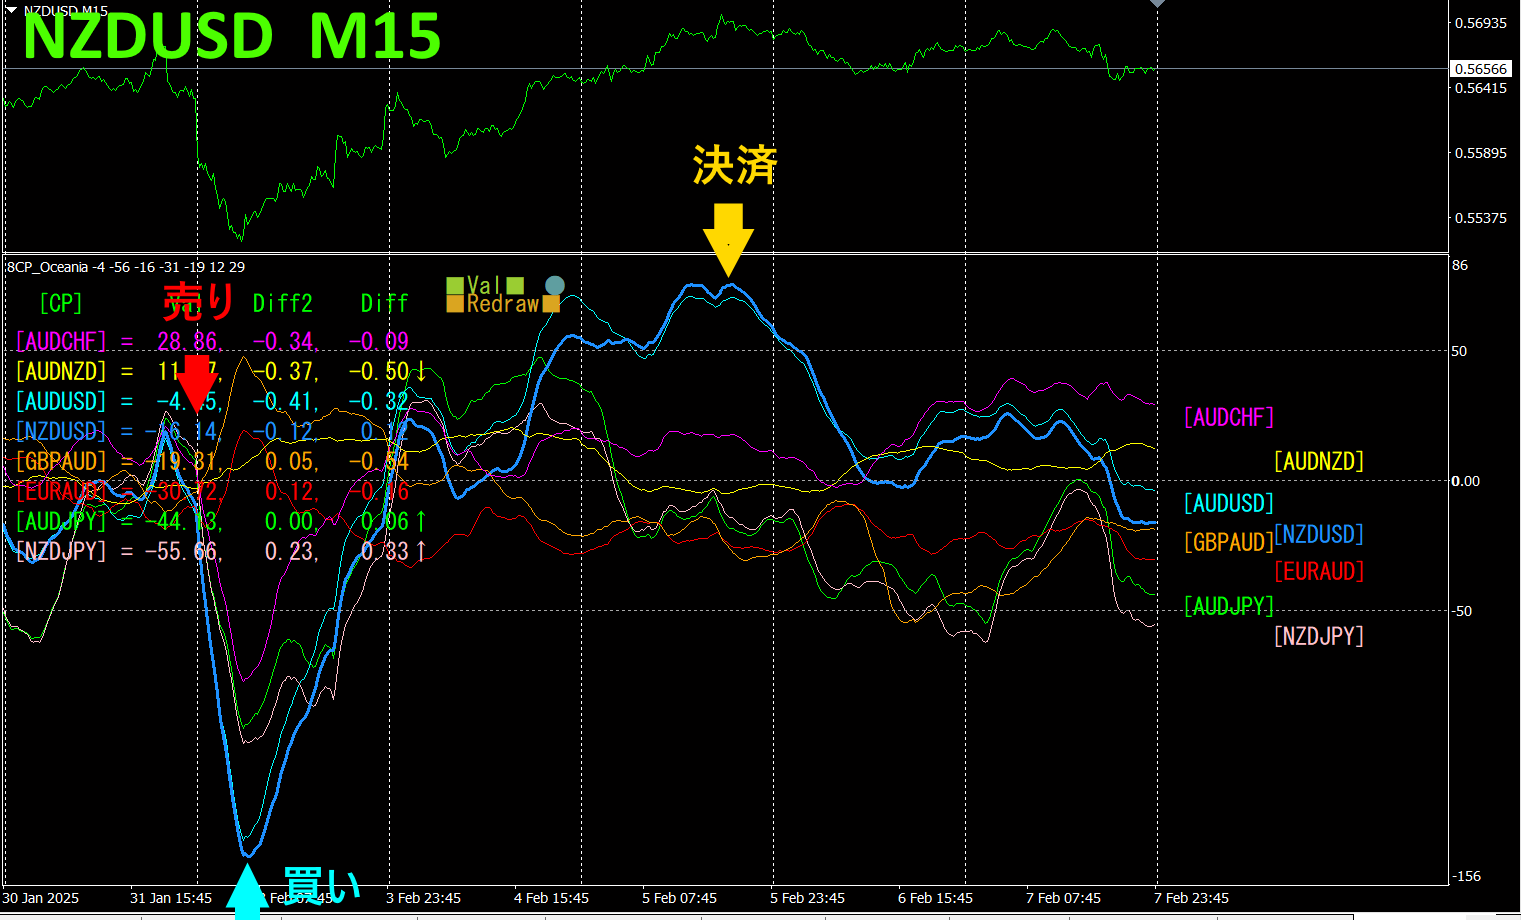
The upper half is the 15-minute chart forNZDUSD. The lower half shows the results from the “8CPNZDUSD.
On Monday morning we sell, close at the day's bottom, and reverse to buy. If you had closed at the Wednesday peak, you would have gained 60 pips from selling and 180 pips from buying, totaling about 240 pips of profit.
If you use the “TrendLine-EX,” you can automate entry and exit with diagonal trendline breaks. It can be left as is, enabling easy trading. The “TrendLine-EX is a semi-automatic EA that can do automatic selling on a trendline break below and automatic closing on a trendline break above.
2. Best SelectIndicator try
The diagram below is a screenshot taken on2025 year2 month7 day09:34 (JST) .
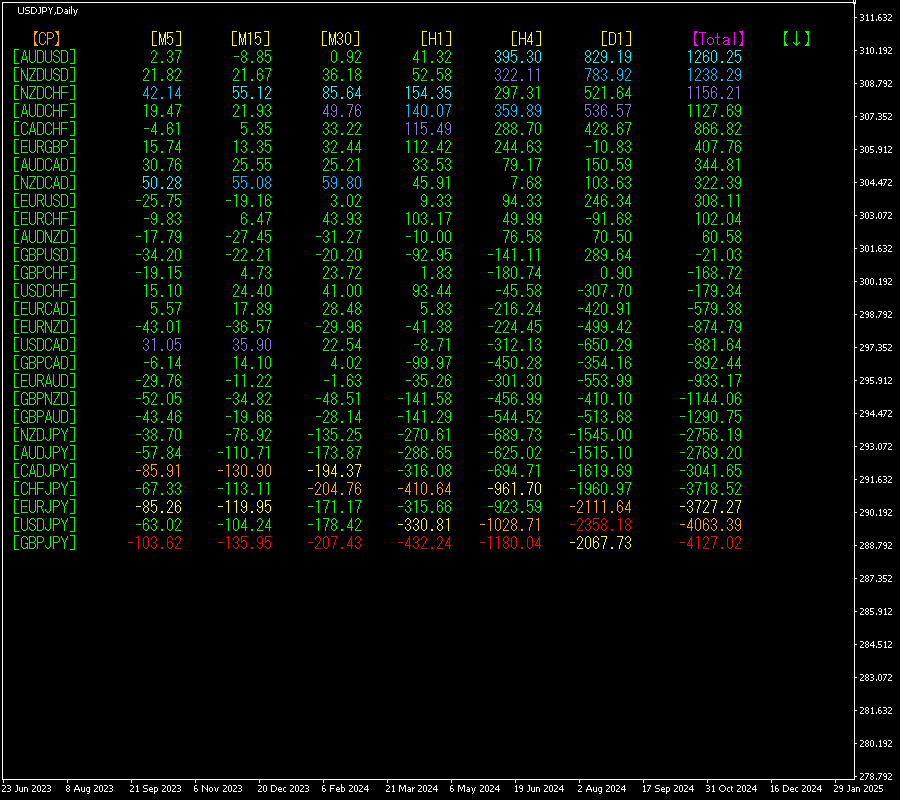
Total]values are arranged in descending order. At the bottom,GBPJPY appears with red hues across all timeframes. value is-4127.02, indicating a large negative figure. This suggests a pronounced downtrend forGBPJPY.
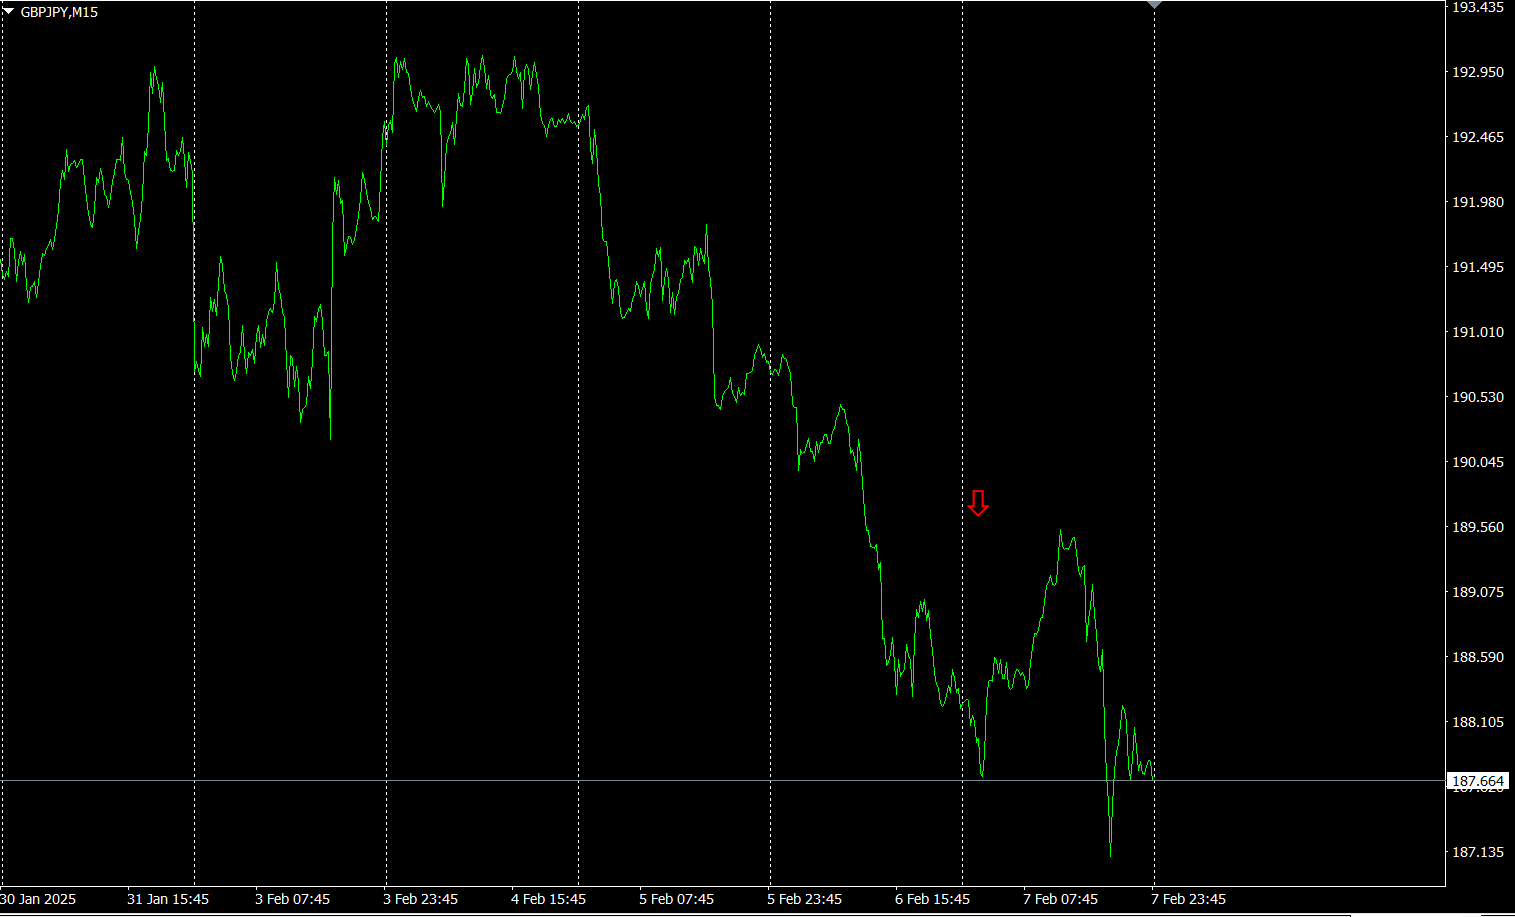
Now, let’s look at the chart ofGBPJPY.
The red arrows indicate where the screenshot was captured. It captures the final drop of the downtrend.
The “28 currency pair Best Select indicator can easily identify which currency among the 28 pairs is showing the strongest trend. It also tells you with numbers and colors whether you should trade now. It allows you to judge the overall movement of all currency pairs at a glance.
The “28 currency pairs indicator Best Select

https://www.gogojungle.co.jp/tools/indicators/35128
3. 2021 year5 month onward trackingEURJPY
Since 2021 year5 monthEURJPY has been tracked.
To view the overall trend, we depict approximately30 minutes of the latest about3 weeks.
Previously I wrote the following.
Pink isEUR, green isJPY. EUR appears slightly downward, whileJPY is slightly upward from a horizontal level. Therefore,EURJPY seems likely to move slightly downward.
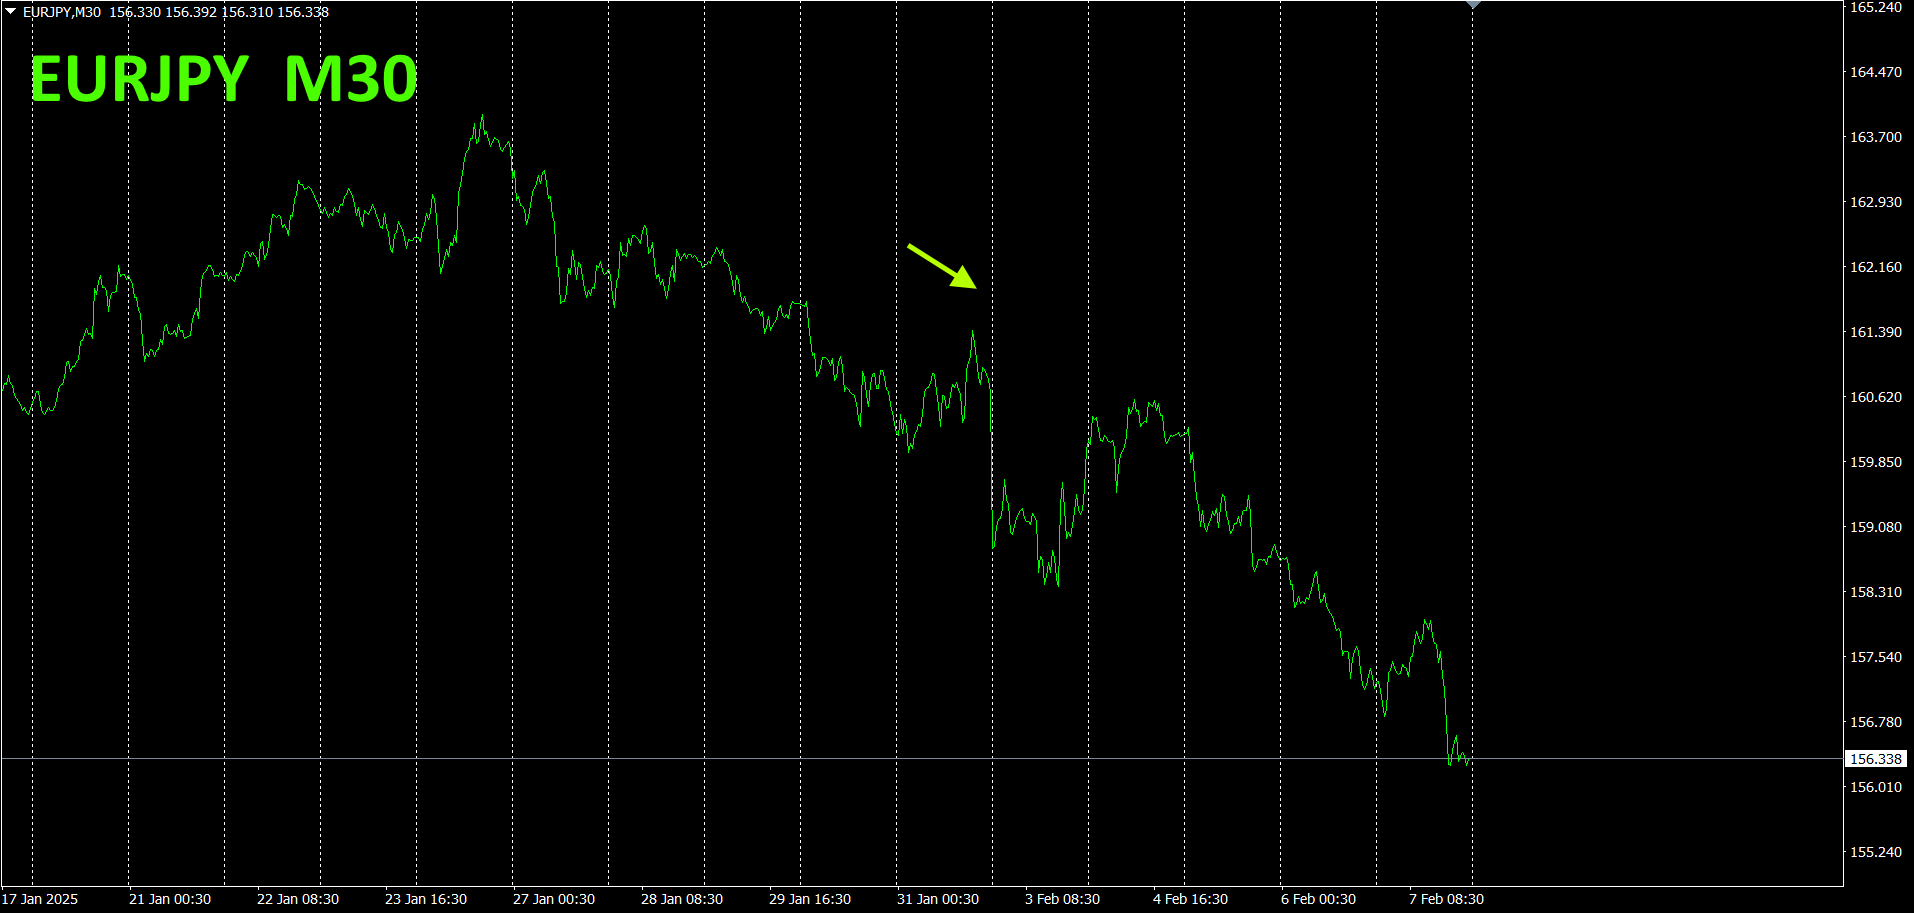
As expected, it clearly moved downward.
30-minute currency strength chart.
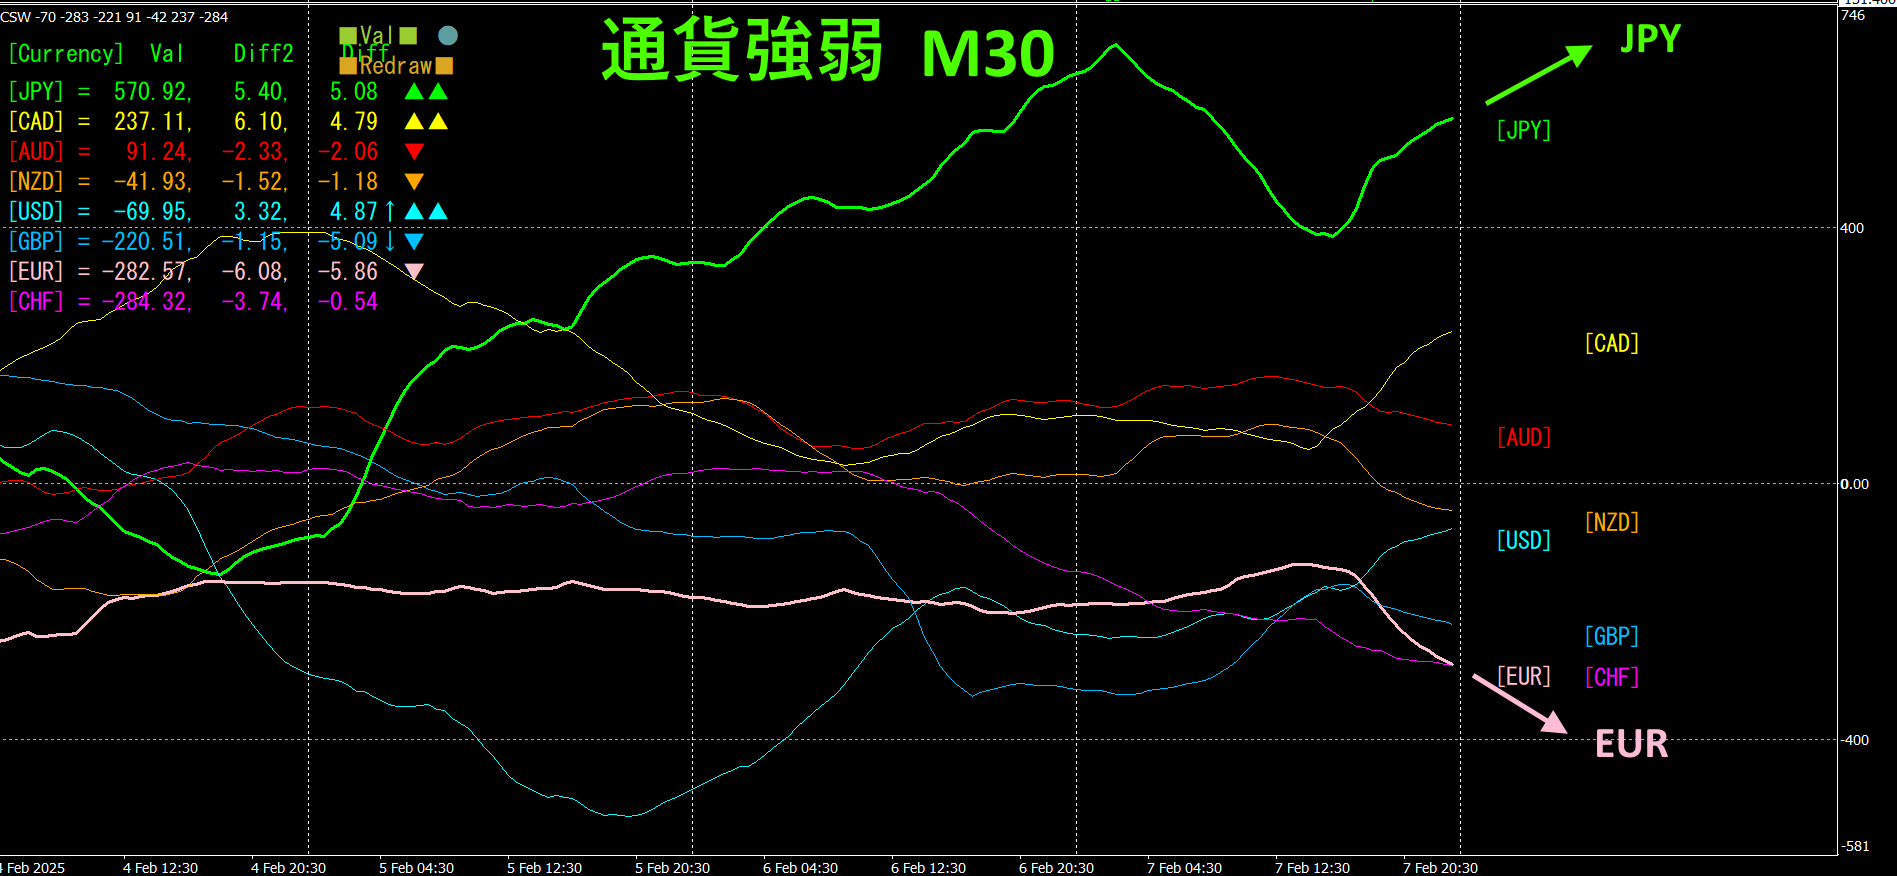
Pink isEUR, green isJPY. In the currency strength chart, is the strongest currency, is becoming the weakest. Therefore, future movement of is expected to proceed downward decisively.
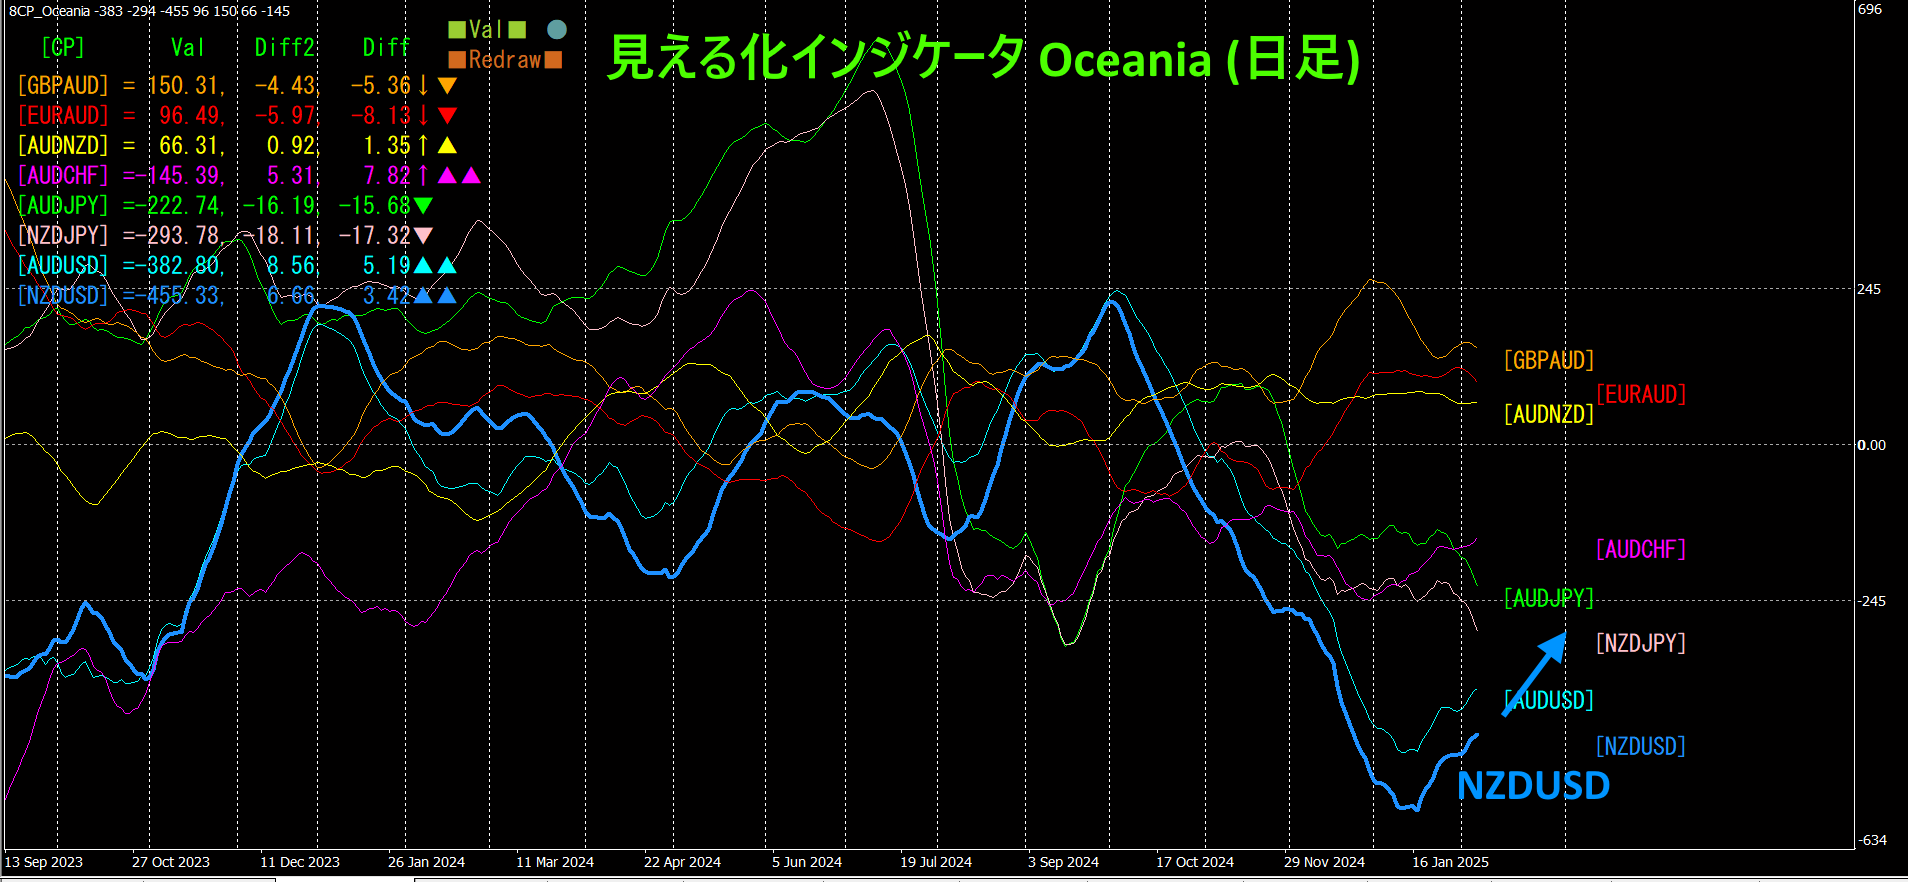
4. Using the Visualization Indicator on the daily chart
The diagram below shows the “8CP Visualization Indicator Oceania version on the daily chart.
NZDUSD has rebounded from a major trough and is rising. Since this is a daily-based reversal, the potential upside may be considerable.
In the previous section, “Utilizing the Visualization Indicator” (part184),
SL (stop loss) could be set at the most recent low, allowing a safe long-term trade to be kept open.
However, it hit a long lower wick and stopped out. Trades can have such outcomes, so I reset and re-entered a long position. In the long run, profits should come, so I view this loss as a necessary expense.
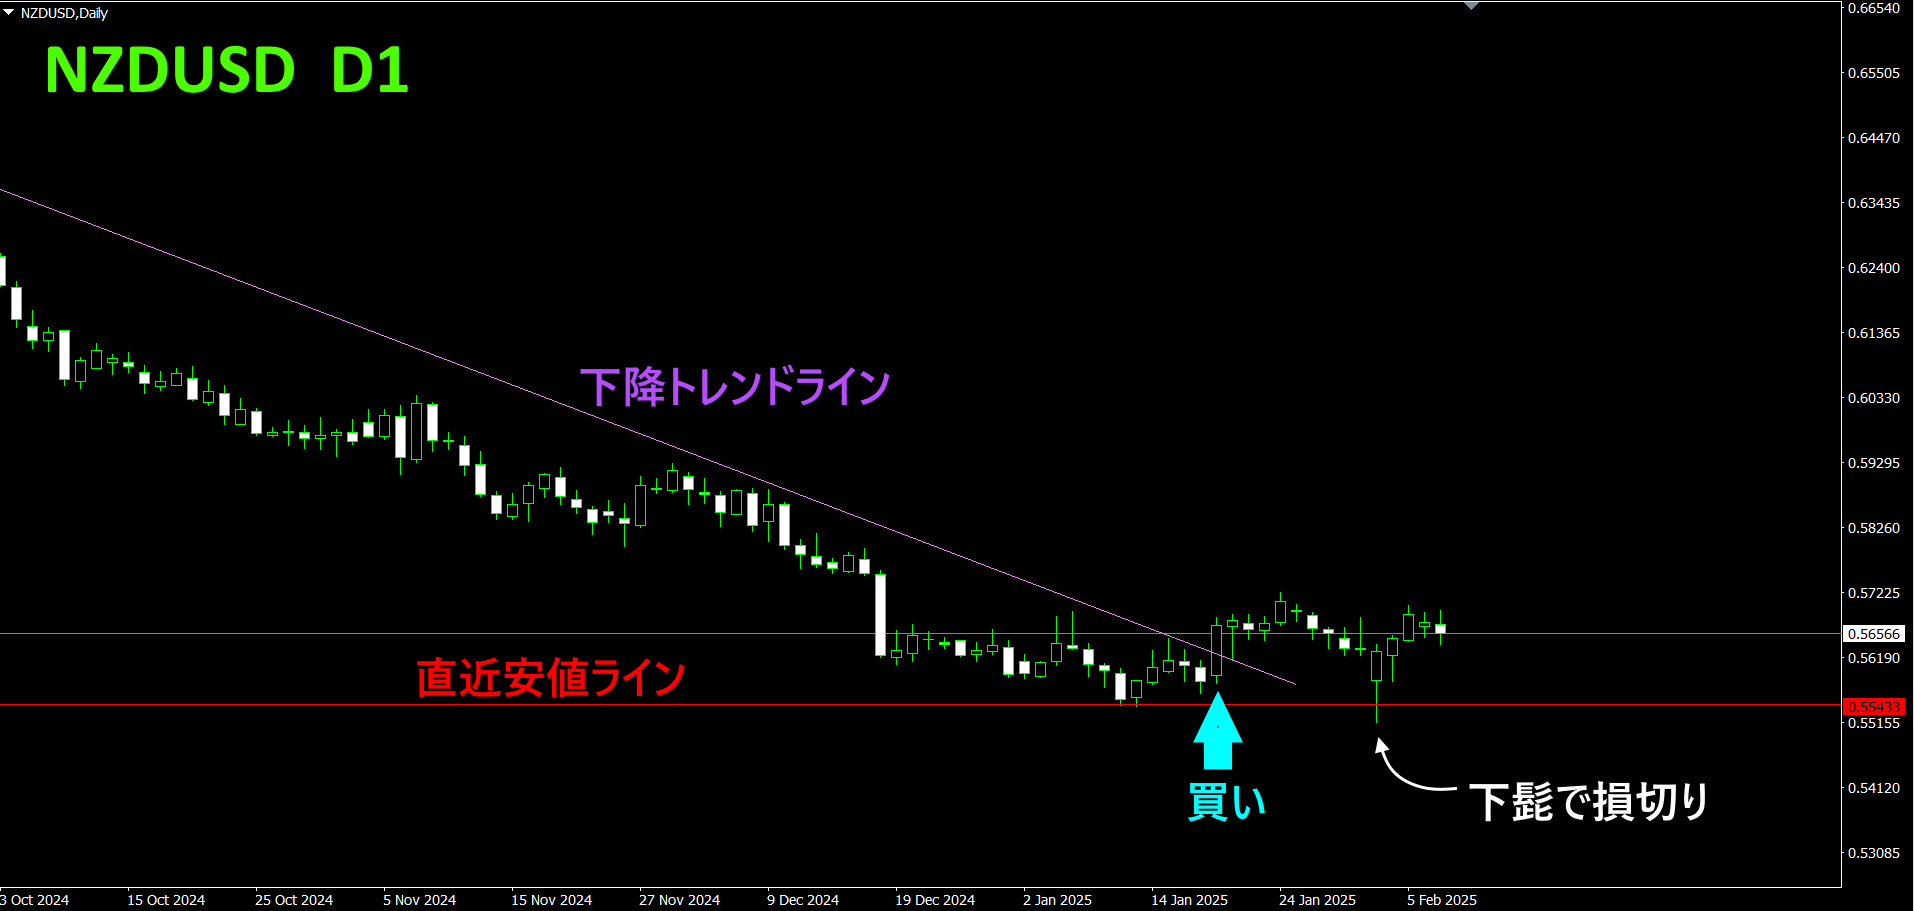
From now on, over the coming months we will patiently wait forNZDUSD to rise.
5. Recommended indicators
“Swap

https://www.gogojungle.co.jp/tools/indicators/48183
“Toretore Indicator”
https://www.gogojungle.co.jp/tools/indicators/50115
“TrendLine-EX”
https://www.gogojungle.co.jp/tools/indicators/42257

“8C Currency Strength Visualization Indicator” please refer to the following pages.

MT4 version https://www.gogojungle.co.jp/tools/indicators/39150
MT5 version https://www.gogojungle.co.jp/tools/indicators/39159
【My items for sale】


