

What are the tips for FX environment recognition? Master these six essential points!
"I have no idea about the tips, steps, or methods for environmental recognition at all..."
Everyone has certainly felt overwhelmed in front of a computer screen at least once in their life.
In FX, environmental recognition can be read to some extent from a single time frame using theories like Dow Theory or Elliott Wave, but as soon as you integrate multiple time frames, it becomes a completely different level of difficulty, which is understandably perplexing.
And when you enter a trade without firmly establishing the steps and methods of environmental recognition, you end up with a painful, damaging trade—that’s a common scenario, isn’t it?
In this article, for those who can’t quite grasp the tips, steps, and methods of environmental recognition, we will thoroughly explain the importance and necessity of environmental recognition first, then cover the essential points to grasp the tips, steps, and methods, so please use this as a reference.
Now, let's get started.
What are the tips, steps, and methods for FX environmental recognition? Before that, a crucial point
Before diving into the tips of FX environmental recognition, I will discuss a very important point—the significance and necessity you should understand.
Importance of environmental recognition
There are many analogies for environmental recognition, but essentially it means that in everyday life you are constantly recognizing the environment for everything you do.
For a farmer, even if you sow seeds in your gravel just because you want to, you cannot expect a fruitful harvest.
To achieve the goal with a high probability, you check whether the soil is suitable for the seed, adjust it if needed, wait for the right time to sow, manage growth, and harvest at the appropriate time.

The judgments to choose each of these actions are all established by environmental recognition, which is easy to understand.FX environmental recognition is exactly the same, to strictly determine whether your method will work and whether there is an advantageous situation for trading.
Necessity of environmental recognition
Next, regarding the necessity of environmental recognition, the fact that the market is composed of multiple time frames tells the whole story.

In other words,even if the overall scaling differs, the structure and nature are almost the same, but because larger time frames contain smaller time frames, the smaller time frames inevitably are influenced by the larger time frames.
What this means in practical trading is that even Dow Theory or horizontal lines that seem to work on a single time frame can be formed with movements you did not intend due to the influence of higher-time-frame environmental conditions.This is the reality you must face.To eliminate these risks thoroughly, you need appropriate environmental recognition through multi-time-frame analysis.
Conversely, if you lack understanding of the fractal market structure and multi-time-frame analysis, your thinking will be governed by popular probabilistic notions like “this method has a 〇〇% win rate…,” and you’ll chase the demon phrase “a universally high-winning method” forever.
FX environmental recognition tips, steps, and methods? Six essential points
Now that you clearly understand the importance and necessity of FX environmental recognition, I will share six essential points to grasp the tips, steps, and methods.
- Fix your monitoring time frame
- Determine whether it is in an uptrend or a range
- Fix the monitoring time frame according to your trading style
- Set horizontal lines on time frames higher than the execution time frame
- Do not change indicator settings
- Image the formation track of the daily chart
Essential Point ① Fix the monitoring time frame
You often see phrases like “It’s better not to look at too many time frames because it confuses judgment,” but taking this at face value is very dangerous.
In other words, the issue isn’t looking at many time frames, but the problem is that you constantly change the monitoring time frame, which prevents you from developing a consistent analytical perspective.Therefore, first, it is important to
fix the monitoring time frame.
Instead, determine whether the main battlefield monitoring time frame has a favorable pattern, and judge accordingly.
Also, for part-time traders who want to trade intraday, if you want to improve intraday accuracy, stop constantly checking charts in your spare time.
Most importantly, the more you look, the more every movement seems like an entry opportunity, and by the time you finish work and can face the chart calmly, your decision-making ability will be worn out.
From here, a crucial point: create a rule to check the chart for a fixed period—“10 minutes for the 5 minutes before and after the 1-hour confirmation”.
This1-hour confirmation is a milestone that many market participants are aware of, so it often becomes an important moment.
I am a full-time trader, and rather than being glued to the screen all the time, I highly value checking this 1-hour confirmation milestone as the market opens in each session.
If you are a part-time trader and find yourself constantly curious about charts during work, first focus on the 1-hour confirmation before and after the 5 minutes after the New York market opens.
Essential Point ② Determine whether it is a trend or a range
Determining trend vs. range naturally decides your strategy, so first determine the market condition on the execution time frame.
The strategic concepts are:
- Uptrend: identify points where highs are new and lows are higher
- Downtrend: identify points where lows are new and highs are lower
- Range: identify the reference highs and lows and wait until they are reached
First, ensure you can determine this on your execution time frame with high precision.
Then, for example, in a pullback-buy scenario, clearly know what constitutes the rising low before which you face the chart.
Also, price movement is formed by buy and sell orders, and according to the law of supply and demand, the conclusion is “buy low, sell high,” but few people can practically apply this while facing a real chart.This is the essence of trading.In daily life, if a regular beef bowl that costs 500 yen is discounted to 380 yen, you feel a huge thrill.
In FX trading, you must translate this concept into actionable practice.
- Currency pair USDJPY
- Uptrend continues
- Pullback formation
- Yesterday's close at 100 yen
- Price at 101 yen with high common recognition
- Price reaches 98 yen within monitoring time
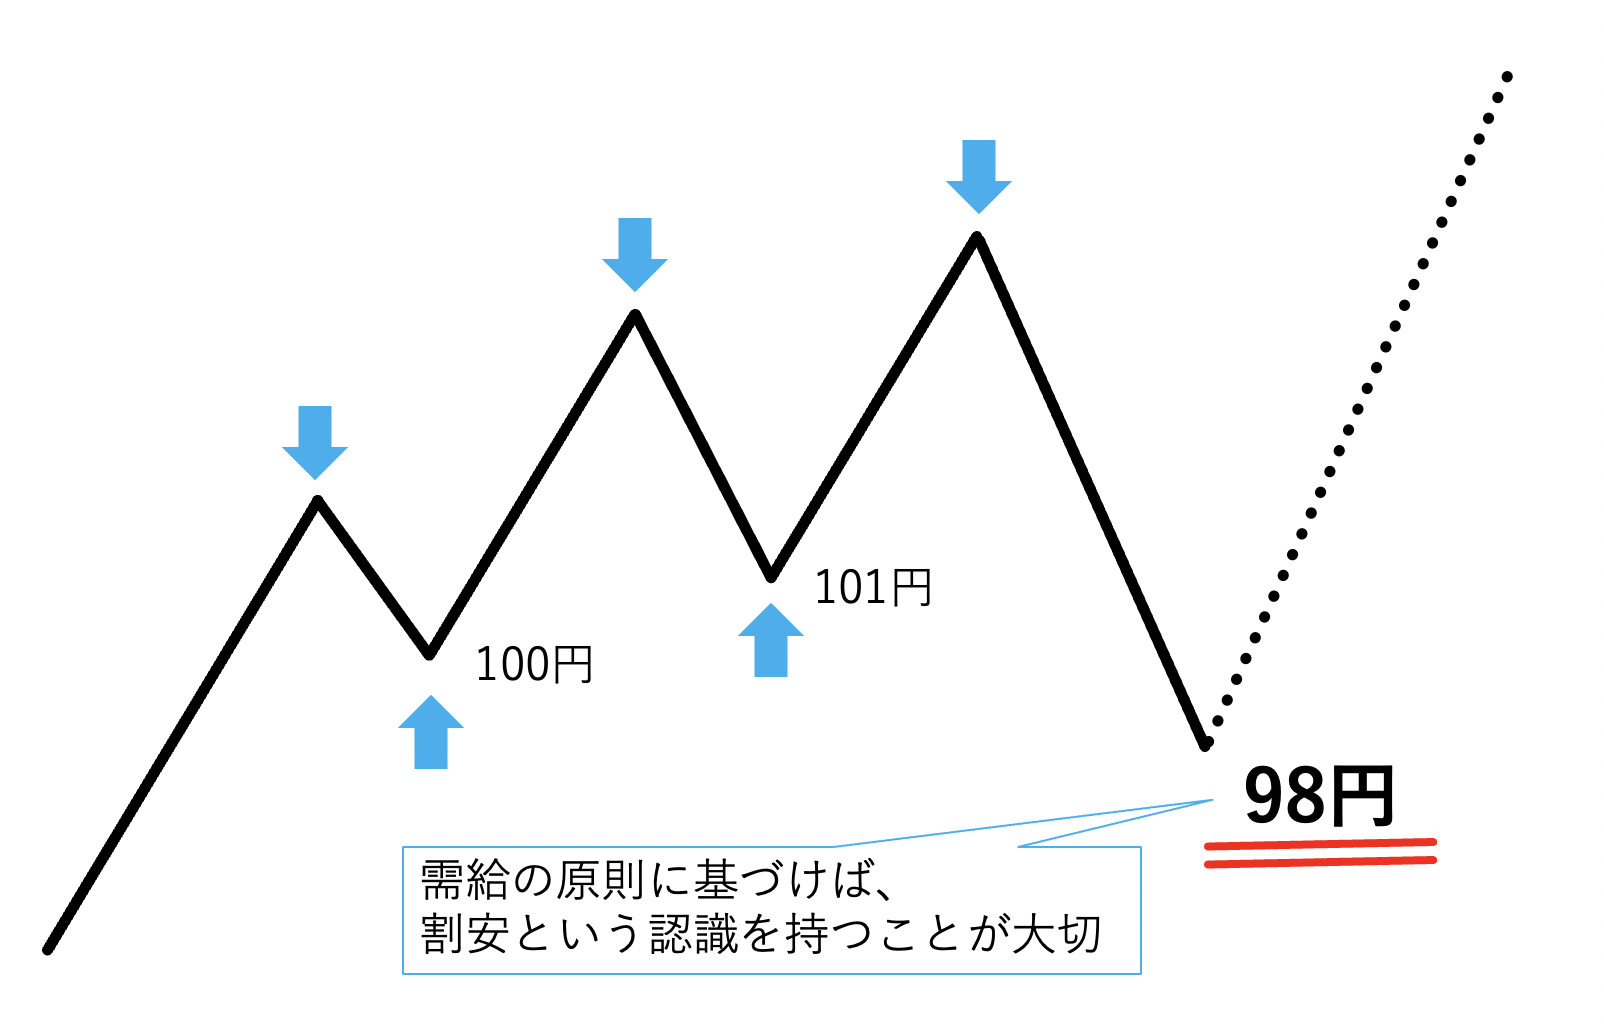
In this scenario, recognizing 98 yen as overwhelmingly cheap and choosing to hold a long position is the essence of a real trader.
Traders with less experience might judge that an upward trend collapsed due to a larger downmove on a shorter time frame and end up selling, which is a common pitfall.
In determining trend vs. range,where is the reference price? how far must you move from the reference price to be considered cheap or expensive? Build your scenarios accordingly.
Essential Point ③ Fix the monitoring time frame according to your trading style

Your trading style will influence which monitoring time frame you should use; refer to the table below to consider your monitoring targets.
| Trading style | Monitoring targets |
|---|---|
| Swing | Monthly, weekly, daily, 4-hour |
| Day trading | Daily, 4-hour, 1-hour, 15(5) minutes |
| Scalping | Daily, 1-hour, 15(5) minutes, 1-minute |
Also, as a method to improve multi-time-frame analysis accuracy, instead of switching chart screens, strongly recommend displaying the four targets simultaneously.Why display four time frames at the same time? For example, do you remember all the traffic signal colors on your morning commute?
- Do you remember how many companies’ advertisements were on the train?
- Do you clearly remember the design of your coworker's tie?
These questions mean that “humans don’t truly see what they are looking at unless they are consciously paying attention.”
And,the human brain tends to interpret and remember things in a way that is convenient for itself, so to reduce this risk, display multiple time frames simultaneously.
If you flip charts rapidly, can you clearly recall the opening price, closing price, high, low, trend status, location relative to horizontal lines and trend lines, and indicator state from a few seconds earlier?probably not clearly.
Essential Point ④ Set horizontal lines on time frames higher than the execution time frame
Basically, horizontal lines are drawn at important highs and lows according to Dow Theory, but regardless of trading style,set horizontal lines on time frames higher than the execution time frame.
If you try to set lines on every time frame, you can easily become confused.
Also, a common pitfall is to draw lines on lower time frames to force a reason to trade because you want to say “horizontal line → bounce → trading opportunity,” which summarizes the behavior of an inexperienced trader.
To break away from being a novice trader,the high probability of lines on weekly, daily, and 4-hour charts is a key indicator, and observe the price movements that occur there.
Essential Point ⑤ Do not change indicator settings
This does not mean you should never change anything; it means you should use a single set of settings consistently.
After all,price movements occur because many people are conscious of that price, and indicators are no exception.
Continuously changing the values to respond to each candle moves away from the essence of trading and risks getting lost in an endless maze, so never do it.
Also, as a fundamental premise for maintaining consistency in environmental recognition, you should minimize adjustable elements as much as possible; therefore, limit the indicators you introduce to at most three.Recommended is one or two.
This is similar to reducing the number of players in a rock-paper-scissors game; as the number increases, reading your opponent’s thinking becomes harder, and your options lose their edge.
Essential Point ⑥ Image the daily chart’s formation trajectory

This point—imagining the daily chart’s formation trajectory—is among the six points the most important, so make sure to grasp it thoroughly.
First, as a premise, within a daily chart, which is divided into 24 hours per day, all lower time frames are contained within it, right?
This means thatno matter how much the lower time frames fluctuate, ultimately everything resolves within a single daily chart.
This seemingly obvious property is extremely important when adopting day trading or scalping styles.
Traders face the chart through various filters to derive a provisional optimal solution and take speculative actions, but ultimately they are maneuvering within a single daily chart; simply put, if you can understand whether today’s daily candle will be bullish or bearish, that is enough.This can be the core principle.Put all your current filters aside for a moment and chase only the formation trajectory of the daily chart.
With enough experience, you will be surprised at how well you can judge price movements, waves, and their sizes.
Summary
The difficulty of FX environmental recognition mainly lies in the fact that it can look like anything depending on your perspective.
If you want to buy, it seems to rise; if you want to sell, it seems to fall.
However, you know from experience what result will follow if you enter as you perceive it.
That behavior is what causes about 90% of traders to exit the market.
First, make what we discussed today possible with your execution time frame.
When you can do that to some extent, try it on higher time frames as well.
Even if you do it a little bit every day,enjoy the sense of growth from yesterday and keep refining environmental recognition and multi-time-frame analysis techniques.