

Utilization of the “Visualization Indicator” (Part 184)
Utilization of the "Visualization Indicator" (part184)
1. Advance the "28 Currency Pairs List Indicator" to a higher level and evolve the indicator
“8CP Visualization Indicator”to draw
“8CP Visualization Indicator” includesOceaniaLondonNewYorkAnyCPOceania版を使いました。
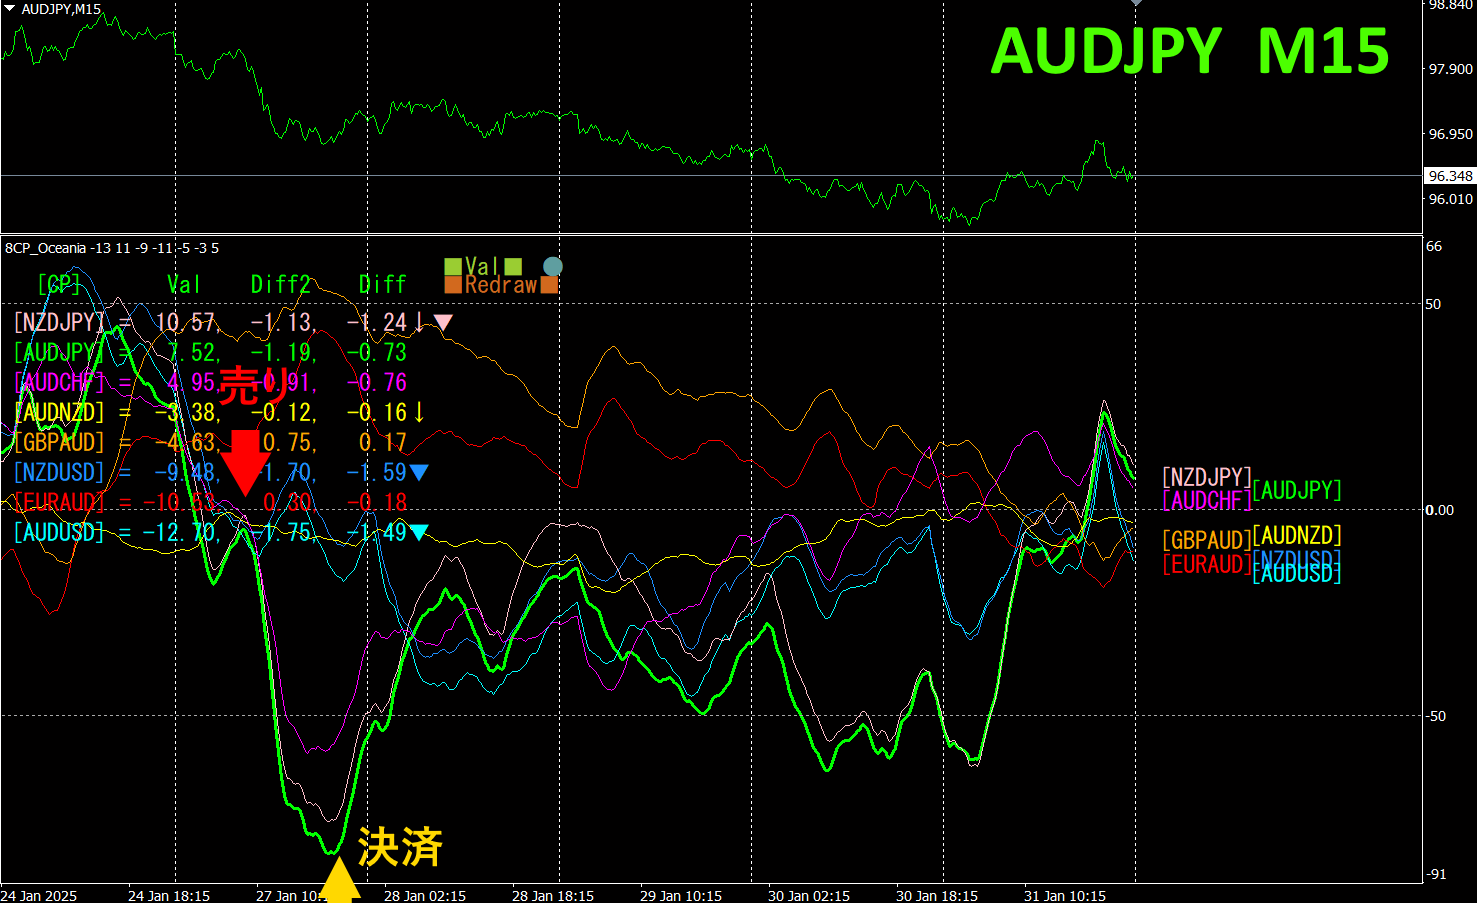
The upper half is theAUDJPY 15-minute chart. The lower half shows the \"8 Visualization Indicator\" data; the green bold line graph corresponds to.
On Monday, there was a selling opportunity, and with same-day settlement, about of profit was obtained.
Between Wednesday and Friday morning, if you held a selling position, you could also gain about of profit.
If you use “TrendLine-EX”, entering and exiting can be automated by breaking the diagonal trend line. You can leave it as is for easy trading. “TrendLine-EX” is a semi-automatic EA that sells automatically when the price breaks below the trend line and automatically closes when it breaks above it.
2. Best Select Indicator trial
The figure below is a screenshot taken on2025 year1 month31 day05:38 (JST)
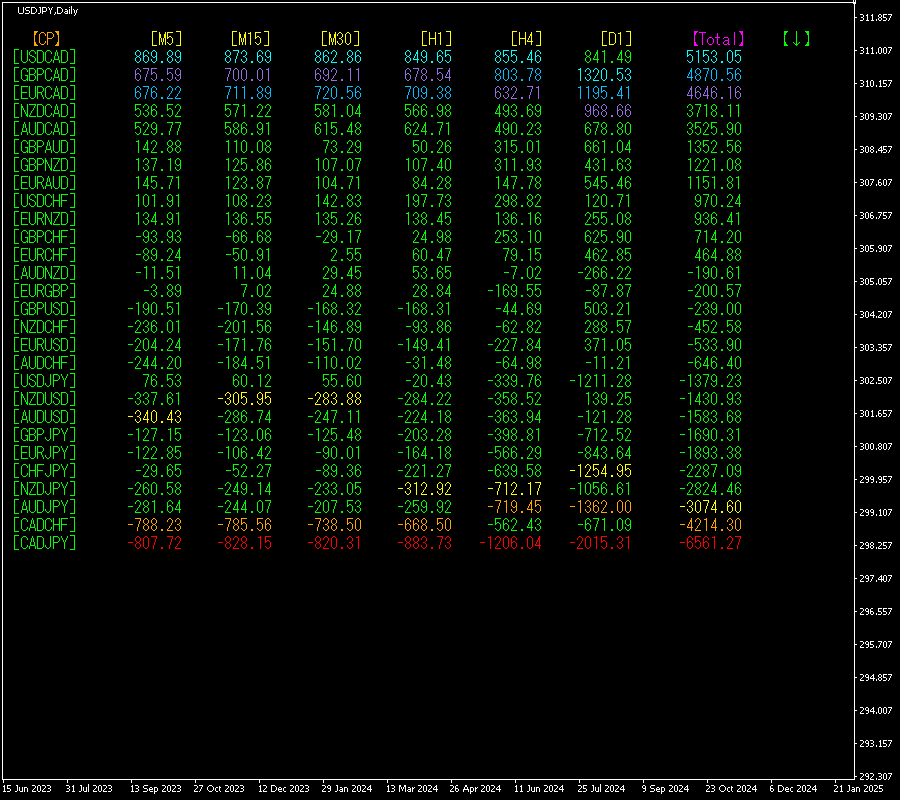
Total]The numbers are arranged in descending order. At the very bottom,CADJPY shows red across all timeframes. value is, a large negative figure. indicates a significant downward trend.
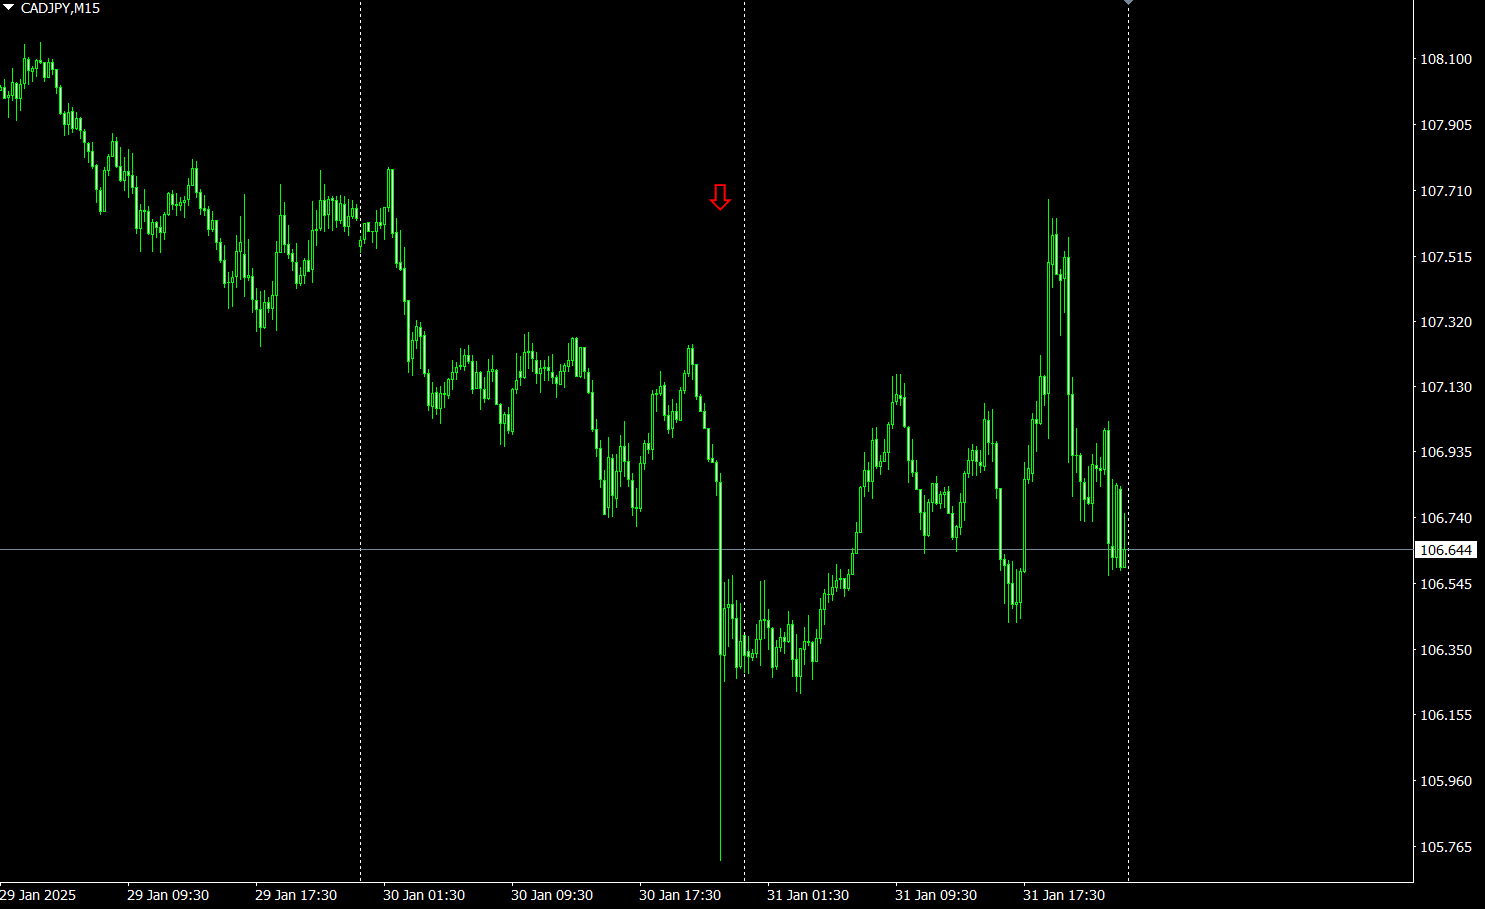
Now, let's look at theCADJPY chart.
The red arrows indicate where the screenshot was taken. It captures the sharp drop in the middle of a downtrend.
“28 Currency Pairs Best Select allows you to easily identify which currency among 28 pairs is showing the strongest trend. It also tells you, with numbers and colors, whether you should trade now. It is an excellent indicator for assessing all currency pairs at a glance.
“28 Currency Pairs Best Select Indicator”

https://www.gogojungle.co.jp/tools/indicators/35128
3. 2021 year5 month to date EURJPY the EURJPY over time?
2021 year5 month from then, movement is tracked.
To view the overall trend, a30-minute chart showing about weeks has been drawn.
Last time, it was written as follows.
Pink is, green is. The rising has shifted slightly downward, while the falling has moved from flat to slightly upward. In terms of, the upside seems heavy.
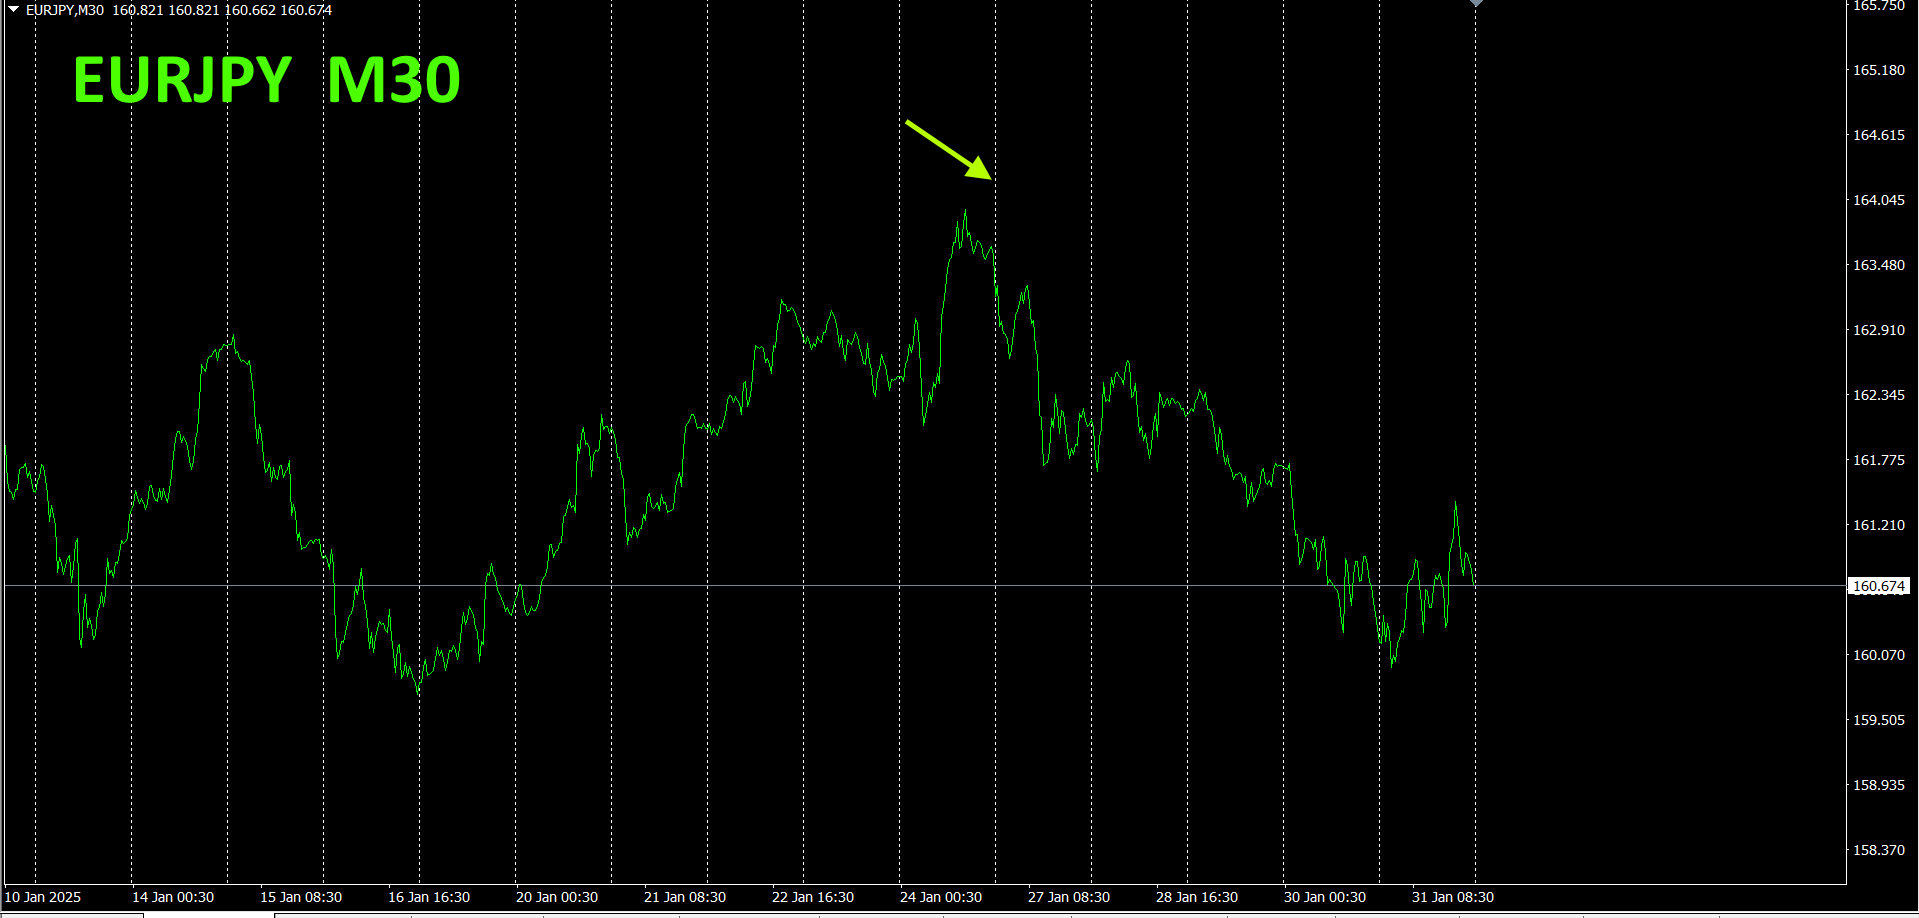
As expected, it dropped after being capped.
30-minute currency strength chart.
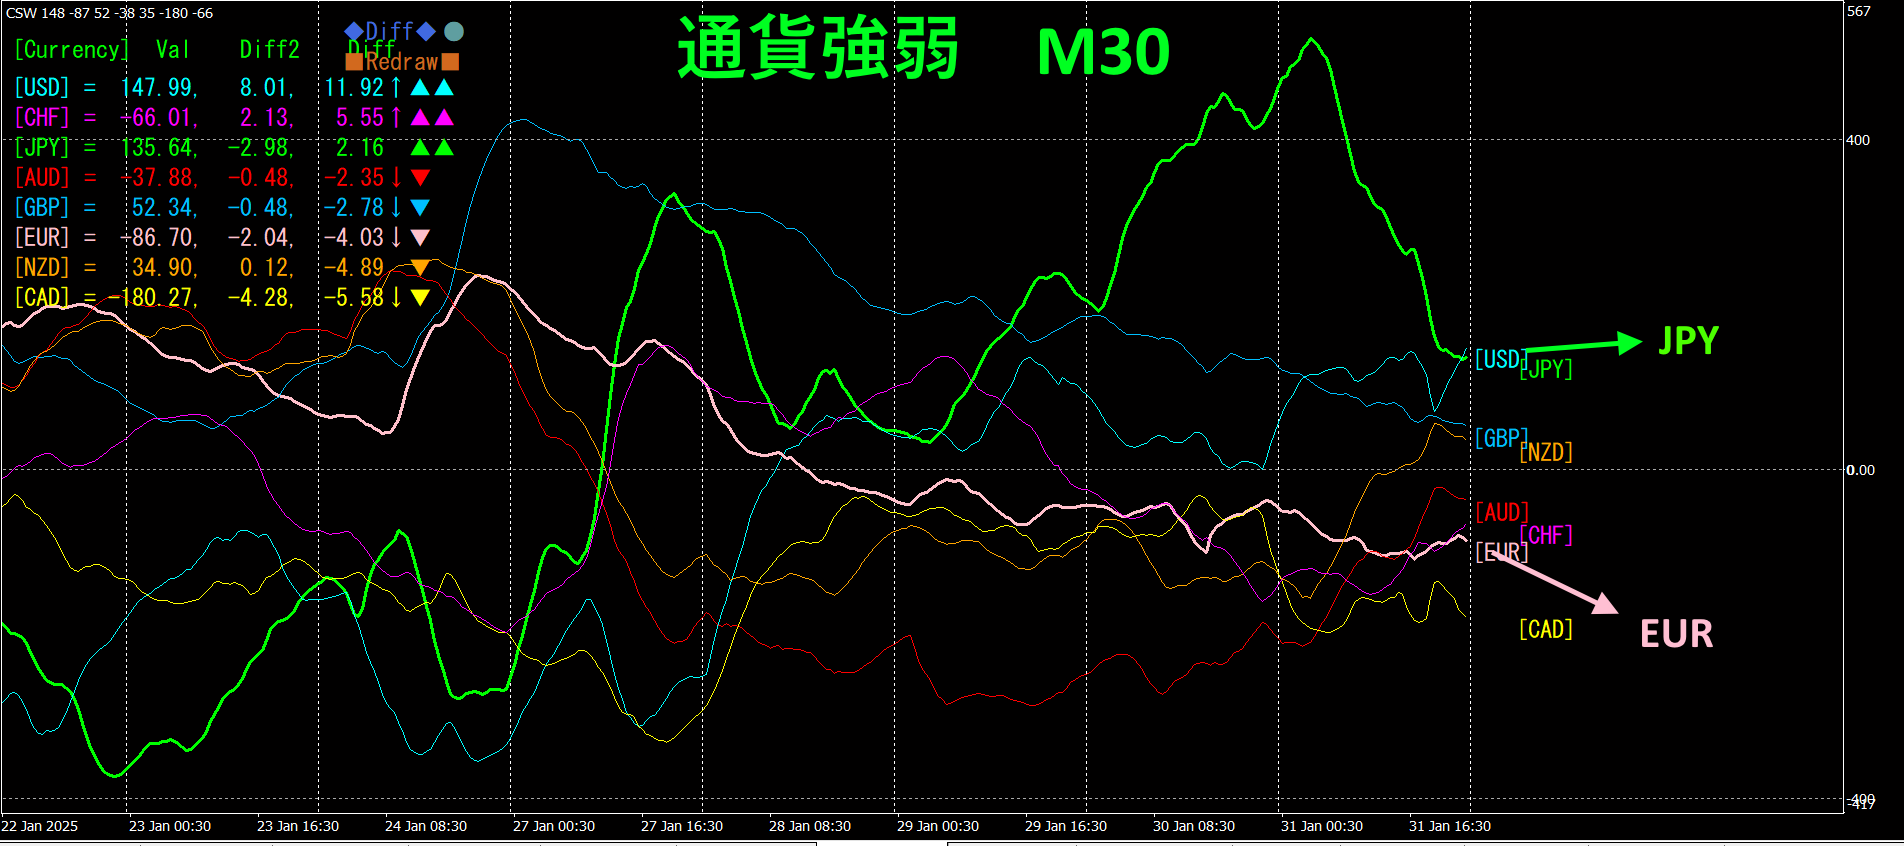
Pink isEUR, green is. EURJPY appears likely to move downward slightly.
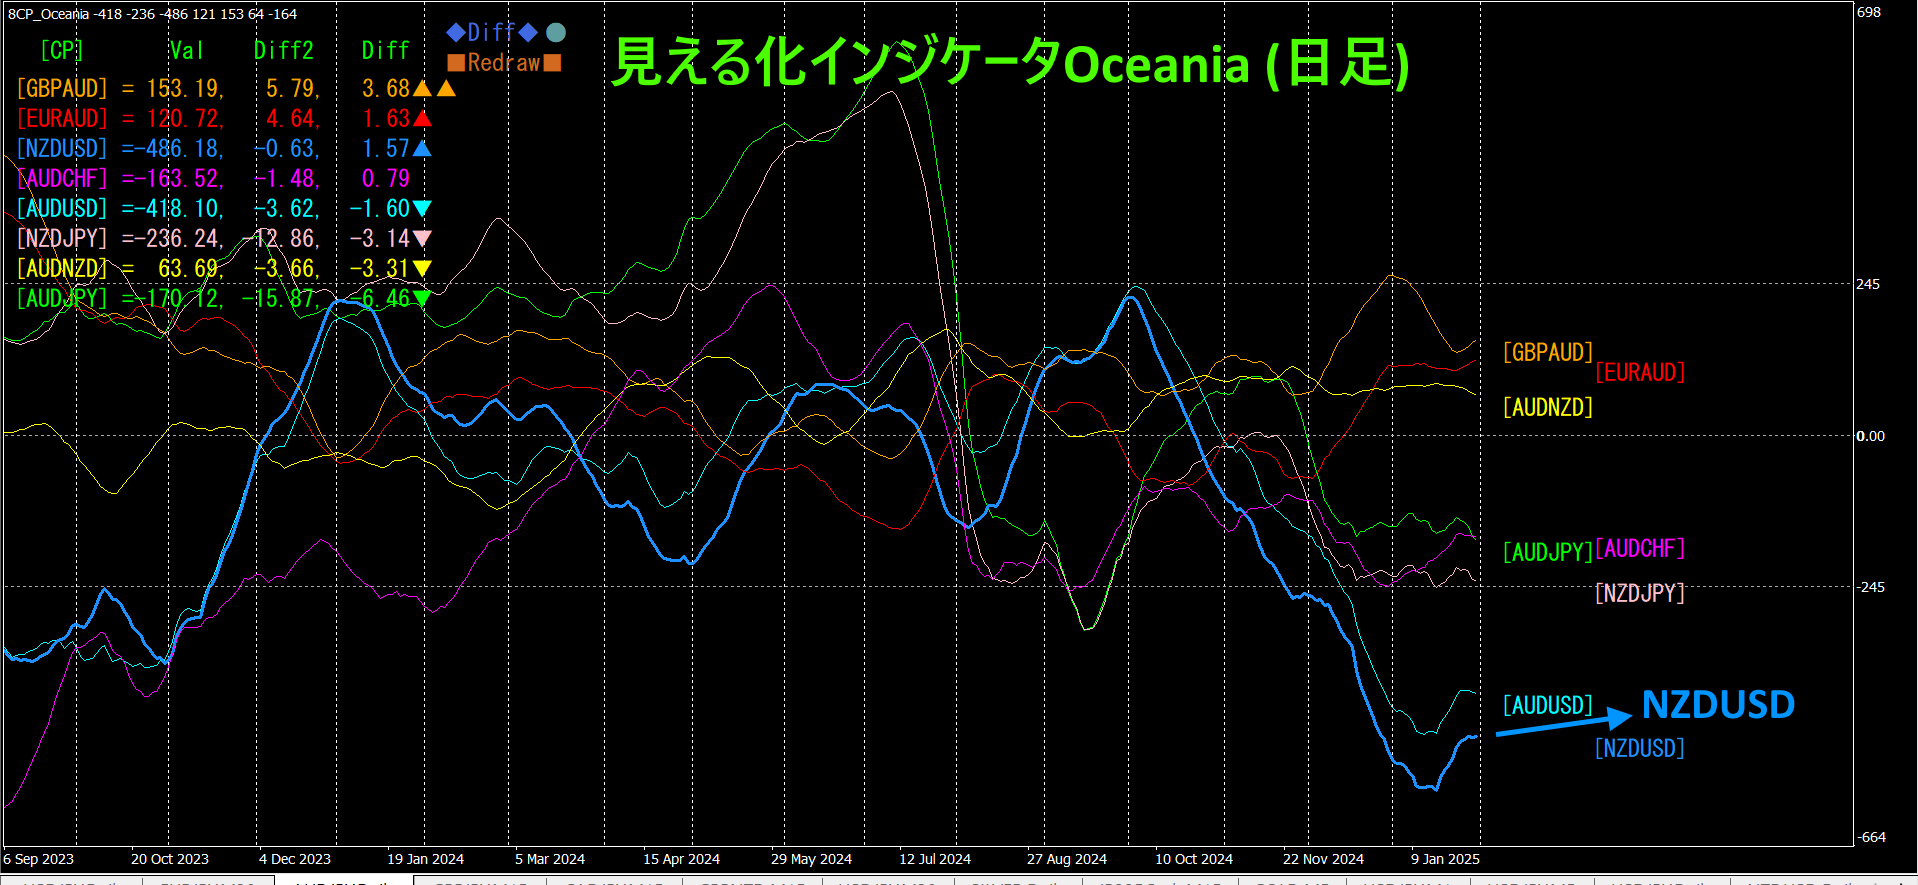
4. Using the Visualization Indicator on the daily chart
The figure below shows the “8CP Visualization Indicator” version displayed on the daily chart.
has turned up from a long bottom. On the daily basis, this reversal suggests potential further gains.
(stop-loss) can be set to the most recent low, allowing safe, passive trading. In the coming months, is expected to rise, making it a relaxed trade, and by leaving it unattended, one could target a sizable FX profit as it reaches a bottom position.
5. Recommended indicators
“Toretore Indicator”
https://www.gogojungle.co.jp/tools/indicators/50115
“TrendLine-EX”

https://www.gogojungle.co.jp/tools/indicators/42257
“8C Currency Strength Visualization Indicator” is described on the following page.

MT4 version https://www.gogojungle.co.jp/tools/indicators/39150
version https://www.gogojungle.co.jp/tools/indicators/39159
【My listed products】


