

Utilization of the "Visualization Indicator" (Part 183)
Utilization of the "Visualization Indicator" (Part183)
1. Advance and develop the "28 Currency Pairs List Indicator" into an indicator
"8CPVisualization Indicator"that drawsEURUSD.
The "8CPVisualization Indicator" hasOceania版,LondonNew York版,AnyCP版. This time, we used theLondon版.
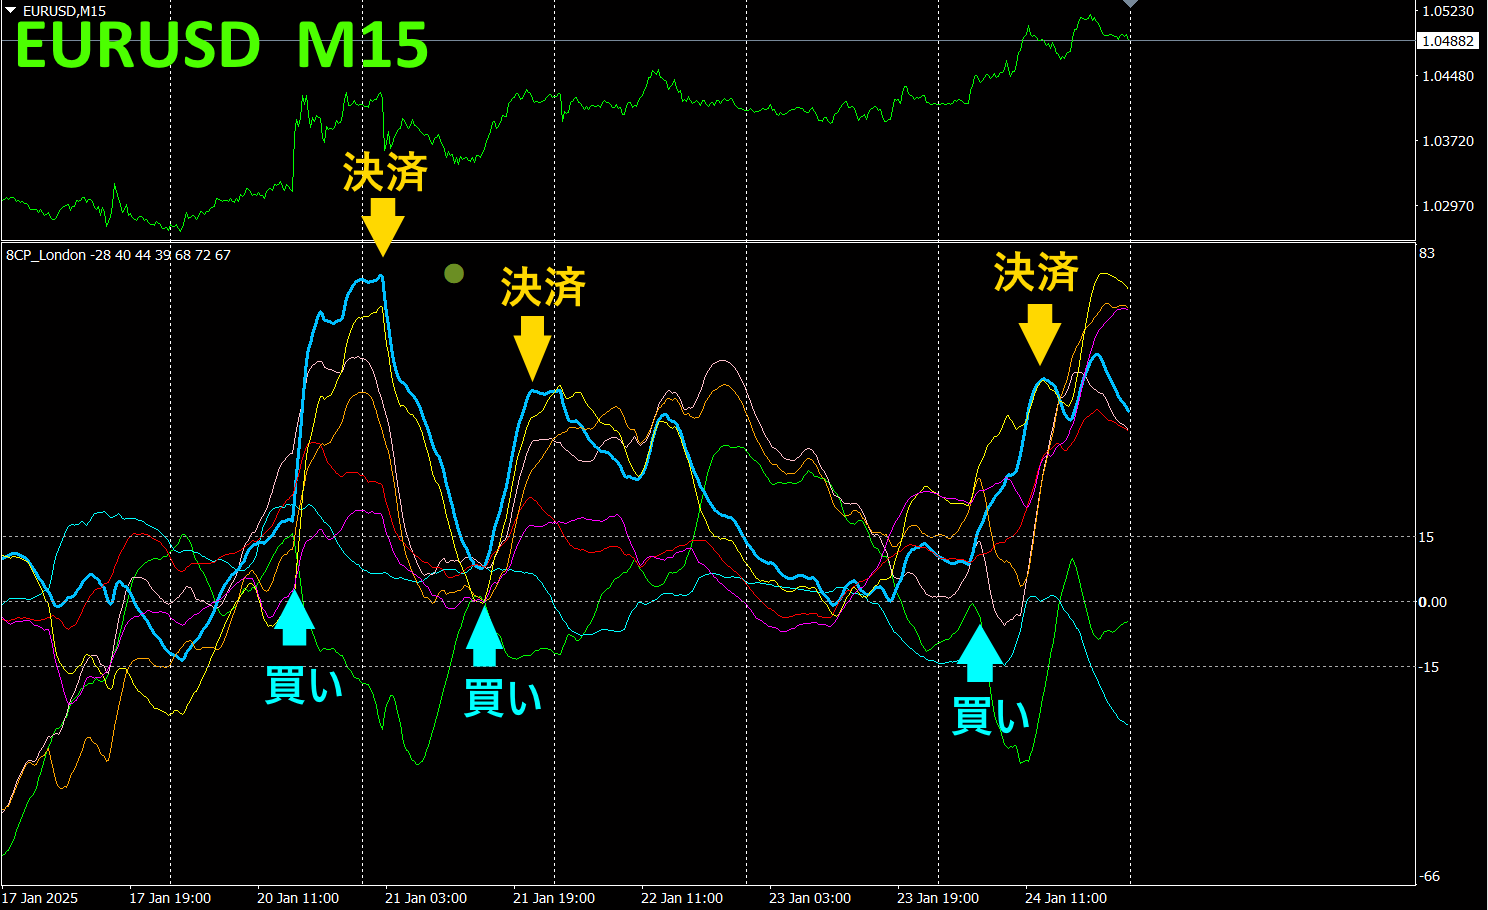
The upper half is theEURUSD 15-minute chart. The lower half is from the “8CPVisualization Indicator”; the light blue thick line graph corresponds toEURUSD.
Last week there were three buying opportunities, yielding about100pips,80pips,70pips for a total of about250pips profit.
If you use “TrendLine-EX”, entries and exits can be automated when a trendline is breached. It allows easy trading by leaving it as is. “TrendLine-EX” is a semi-automated EA that can automatically sell on a lower breach of the trendline and automatically close on an upper breach of the trendline.
2. Best SelectTry the indicator
The figure below is a screenshot from2025 year1 month24 day12:33 (JST)
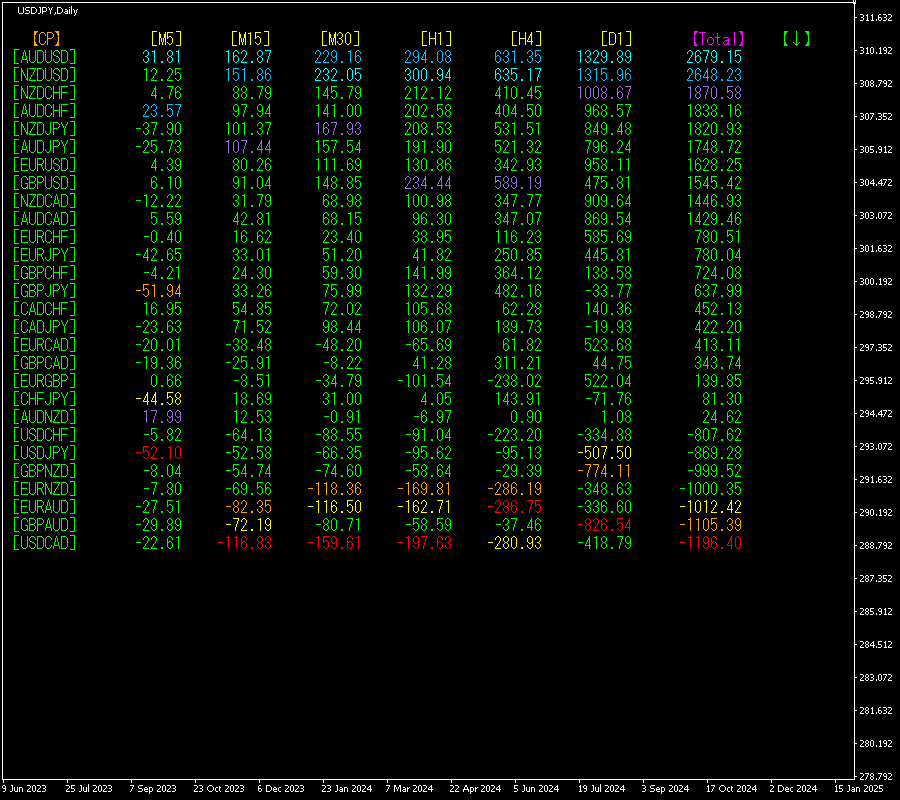
Total]is arranged in descending order. At the very top,AUDUSD shows blue color across all timeframes. value is2679.15, a large positive number. This suggests an upward trend inAUDUSD.
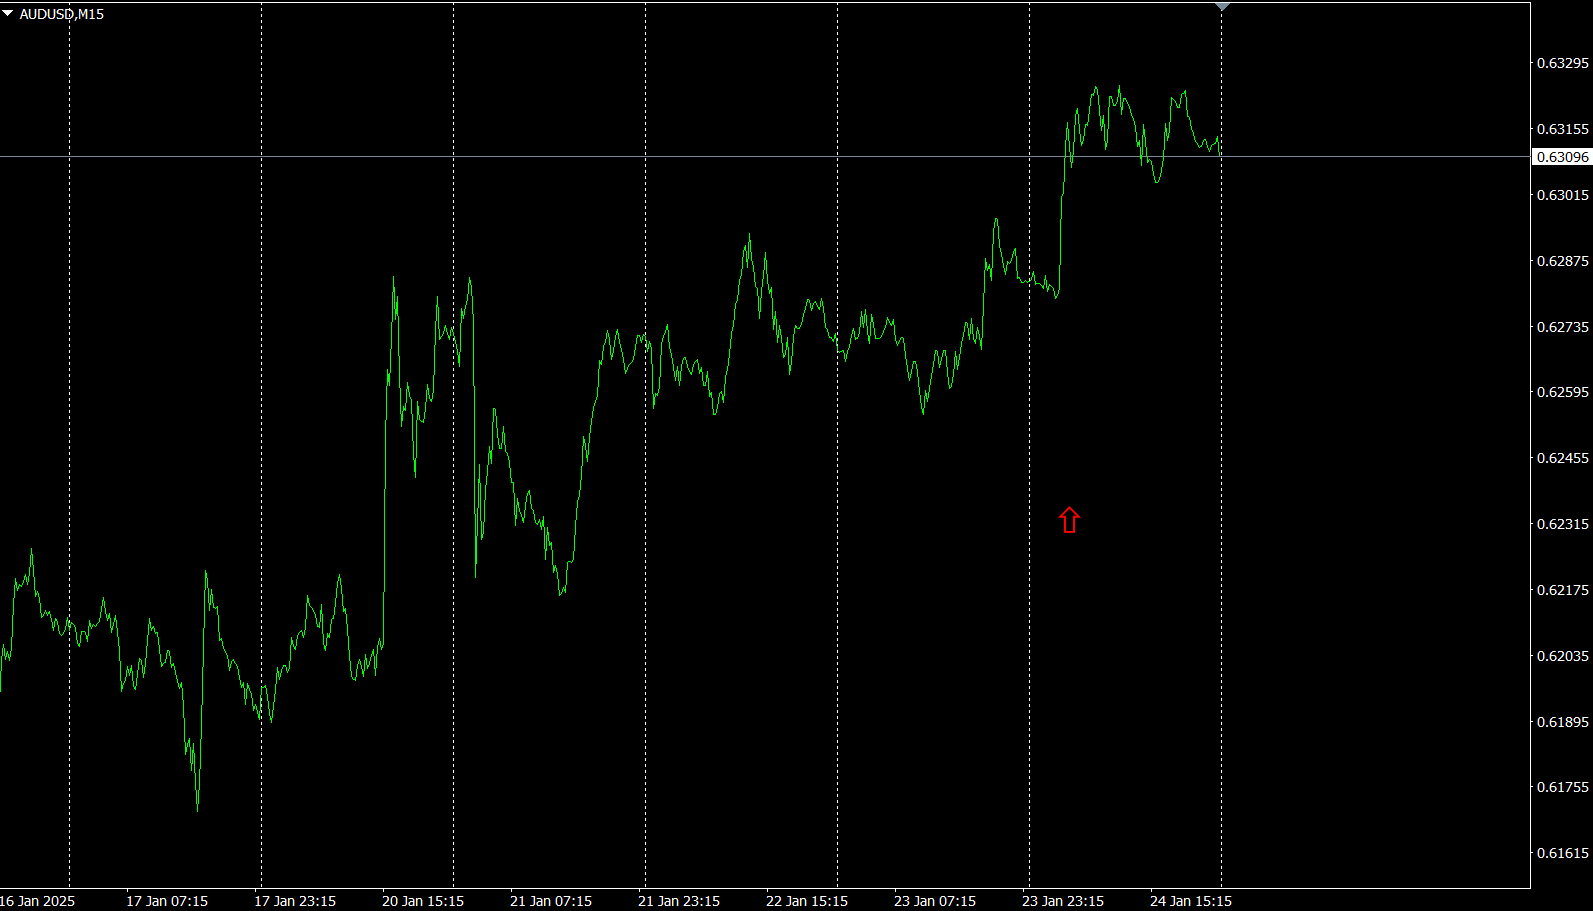
Now, let's look at theAUDUSD chart.
The red arrows indicate the point where the screenshot was taken. It captures a point where the uptrend extended strongly upward.
“28 Currency Pairs Best Select Indicator” can easily identify which currency among the 28 pairs is exhibiting the strongest trend. It also tells you whether you should trade now by numerical values and colors. It provides a quick, comprehensive view of all currency pairs.
“28 Currency Pairs Best Select Indicator”
https://www.gogojungle.co.jp/tools/indicators/35128

3. 2021 Year5 monthto present the EURJPY movement?
2021 Year5 monthsince EURJPY movement has been tracked.
To view the overall trend, a 30-minute chart showing about the last3 weeks is drawn.
Previously, I wrote as follows.
EUR and JPY have mostly stayed flat or moved slightly downward, but a clear direction is not yet evident. In the future,EURJPY is expected to be in a range.
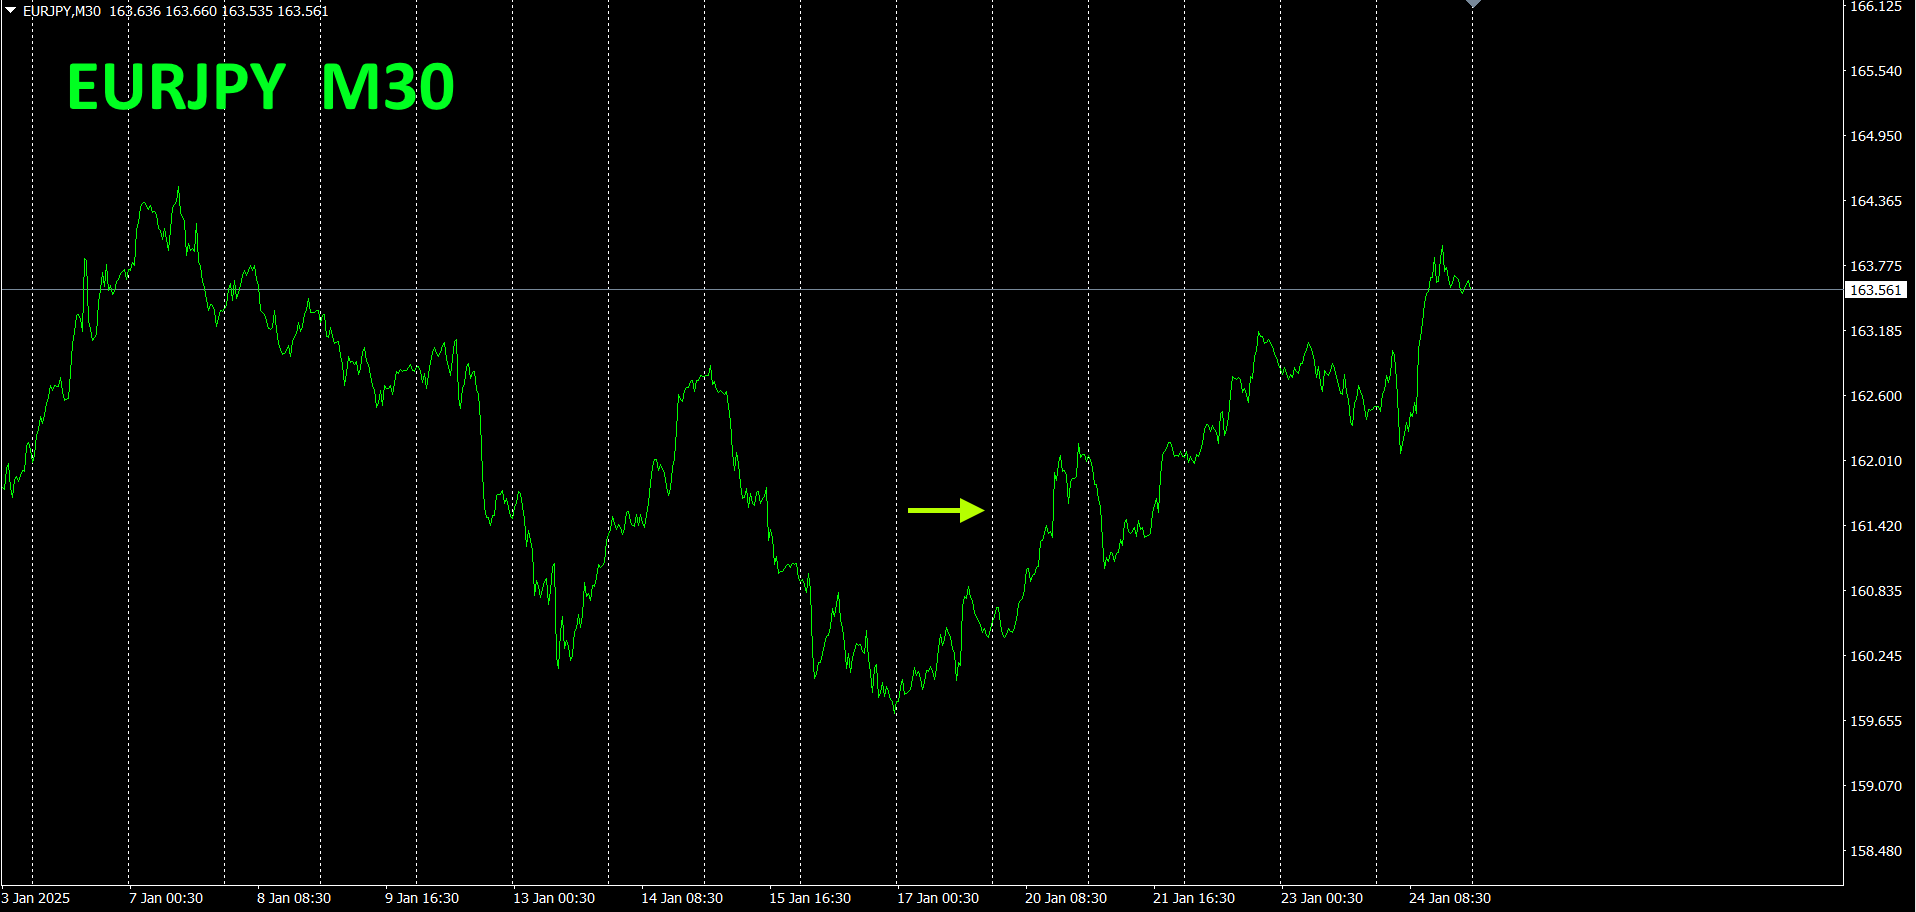
Rather than a range, it seems to have formed a bottoming reversal upward.
30 minutes currency strength chart.

Pink showsEUR, green showsJPYEUR is turning slightly downward, while the declining is turning from flat to slightly upward.EURJPY
4. Try using the Visualization Indicator on the daily chart
The figure below shows the “8CP Visualization Indicator Oceania edition on the daily chart.
AUDUSD,NZDUSD have bottomed and started to reverse from a long bottom. This wave is the first rise in years, so a retracement back to the zero line and further positive territory is highly anticipated.
From now,AUDUSD,NZDUSD buying could be set up, and by simply letting it run for several months, substantial exchange rate gains could be targeted.

5. Recommended indicators
“Toretore Indicator”
https://www.gogojungle.co.jp/tools/indicators/50115
“TrendLine-EX”

https://www.gogojungle.co.jp/tools/indicators/42257

“8C currency strength visualization indicator” please refer to the following pages.

MT4 version https://www.gogojungle.co.jp/tools/indicators/39150
MT5 version https://www.gogojungle.co.jp/tools/indicators/39159
【Products I have listed】


