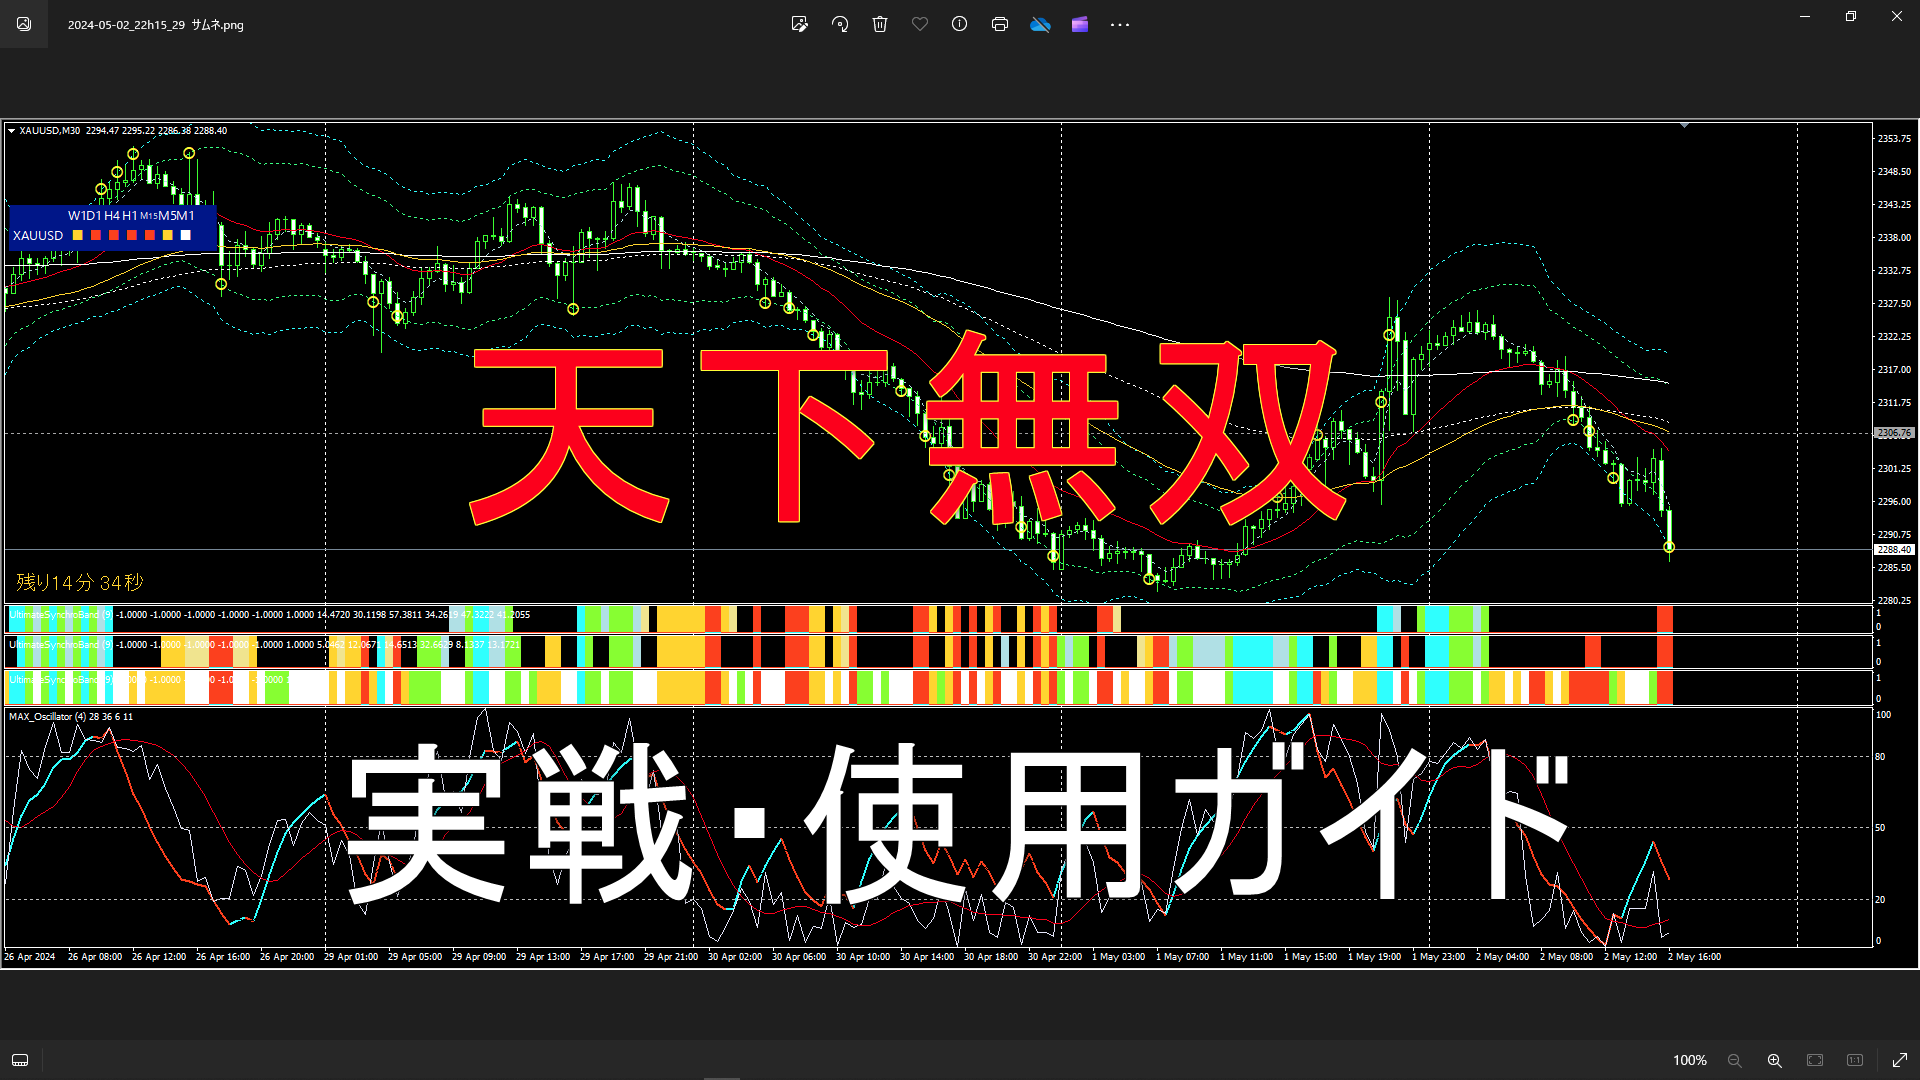

"Peerless" Synchronization System Practical Battle Part 26: Practical Usage for Day Trading / Racing Ahead with 2MA Method and Synchronization Band Alignment, Video Link Included
“Matchless Under Heaven” Sync System - Structure
Due to continuous service additions and updates, we have reorganized and will explain
■ Indicator configuration and priorities
The indicators consist of the following,a total of 8 indicators (+ 2 freebies).

Priority
①②③ should be displayed first and understood, then decide what to keep or discard.
By the way, I display ④ only on the 15-minute chart, and the freebies only on the 5-minute chart, but
④ is also not inferior to famous arrow signs.
Please first check the details on the explanation page!
Product explanation page link↓↓↓↓↓↓↓
https://www.gogojungle.co.jp/tools/indicators/50319?via=users
Each indicator also has a sellout version.
Please check here↓↓↓↓↓↓↓
https://www.gogojungle.co.jp/users/189322
■ Content of this article: 2MA crossover + higher-timeframe alignment “Start” what does it mean to go all out?
Reconfirm entry timing through MAX Oscillator and Sync Band alignment
A What is Sync Band?
⇒It is the color band in the oscillator window at the bottom screenshot.
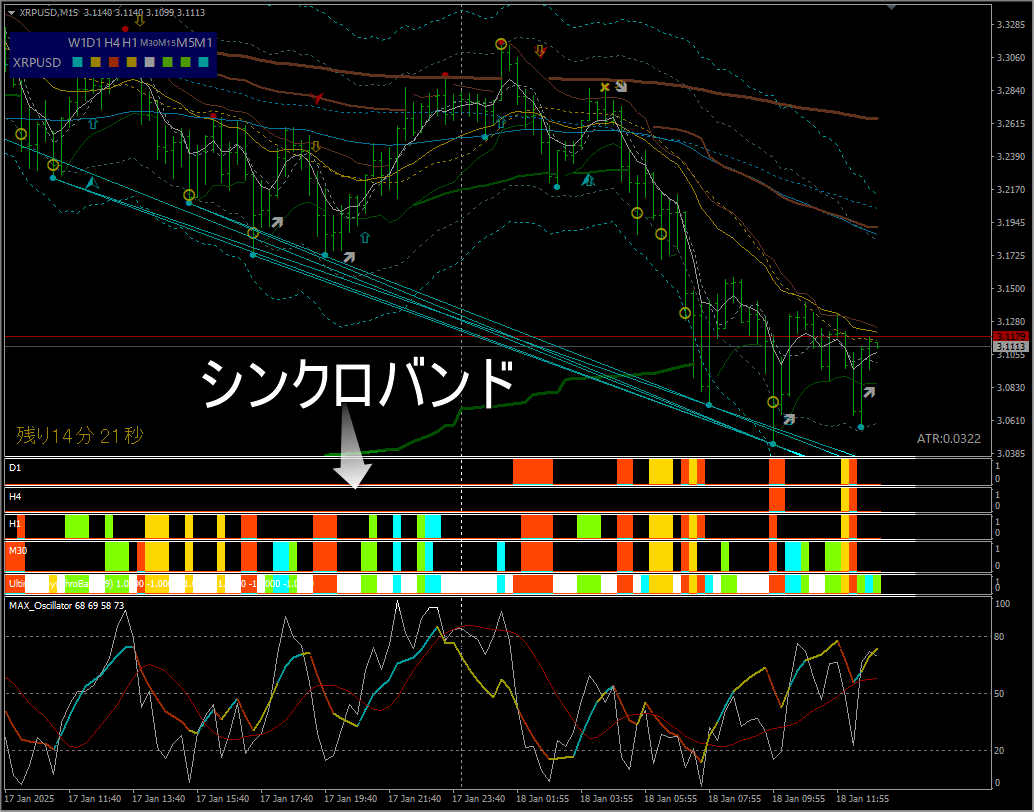
Function ① Clearly indicates the direction, strength, and neutrality (watchful waiting) with color
Rising: Strong-Light blue/ Weak-Green
Falling:Strong-Red/ Weak-Yellow
Neutral: White / Blank
Function ② Allows at-a-glance understanding of alignment/incongruence with higher timeframes
Note: Higher timeframe can be specified
Alignment (state match): Color appears from the 2nd bar onward.
BWhat is MAX Oscillator?
Note: This is the oscillator in the lower oscillator window.
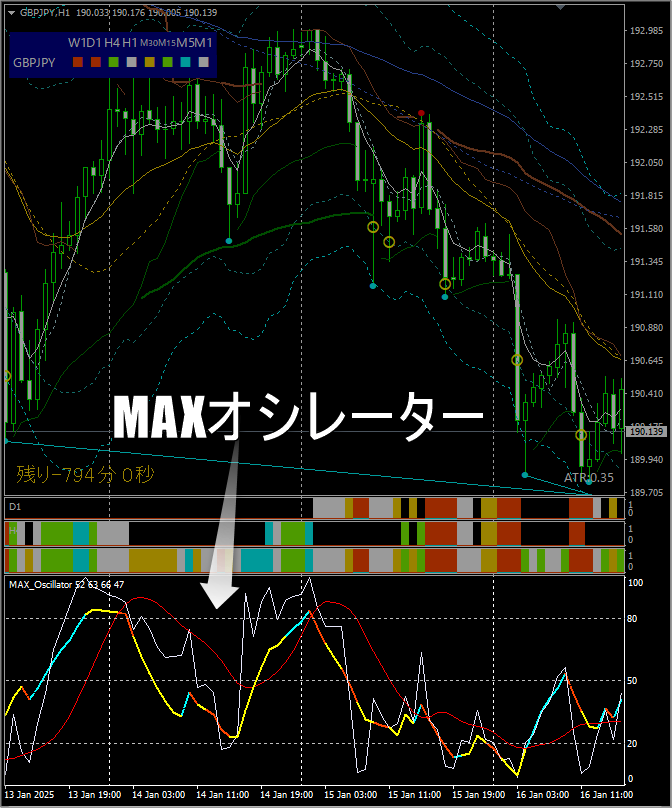
Function ① Indicates changes in price pressure (reversal) and direction
Rising: BlueRedYellow
Function ② Represents strength/weakness of price movement (stagnation)
Strong: The white line at the tip indicates the other two lines with all lines crossed
Weak: The white line at the tip is between the other two lines
※ On shorter timeframes, during this, it tends to range or stagnate.
①③ start rising: ② starts falling
Main topic: 2MA crossover & Sync Band alignment - what does “start” imply?
■ What is 2MA? It means two moving averages. Here it is described in simplified form.
① Set two EMAs ⇒ periods 5 and 20
② Cross below (death cross) / cross above (golden cross)
■ Procedure: In an uptrend
① White line (W%R) touches the bottom
② White line reverses direction and crosses back,
Blue
③ 2MA forms a golden cross and after that, EMA20 ≦ EMA5 maintained
④ Sync Band lights up in the higher-timeframe alignment state in the opposite direction (if downward to upward, yellow → red → green → blue)
Note ①There are cases where you may wait and the sync does not reverse
Note ②If it doesn’t extend much and the relationship of the 2MA reverses, or the sync bandsync reverses
it is better to retreat
※ Explanation with chart—GBPJPY 1-hour chart
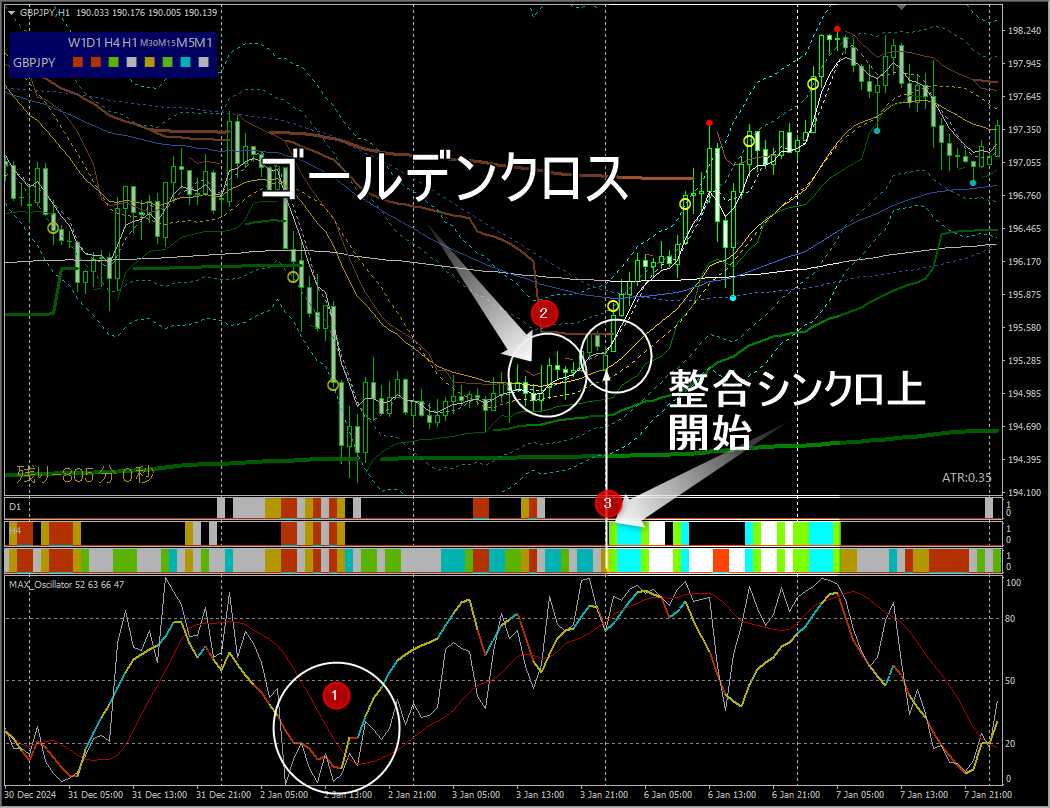
■ Explanation
①First, after the white line reaches the bottom of the window, it turns upward
② MAX Oscillator turns blue and the white line crosses above the red thin line
③ MA forms a golden cross
④ Sync Band indicates higher-timeframe alignment (in this case 1 hour and 4 hours) suggesting long
⇒ Enter
※ Sync Band settings are for 1-hour and 4-hour timeframes
■ Check on other pairs too
※ Explain by chart movement — EURJPY 15-minute chart
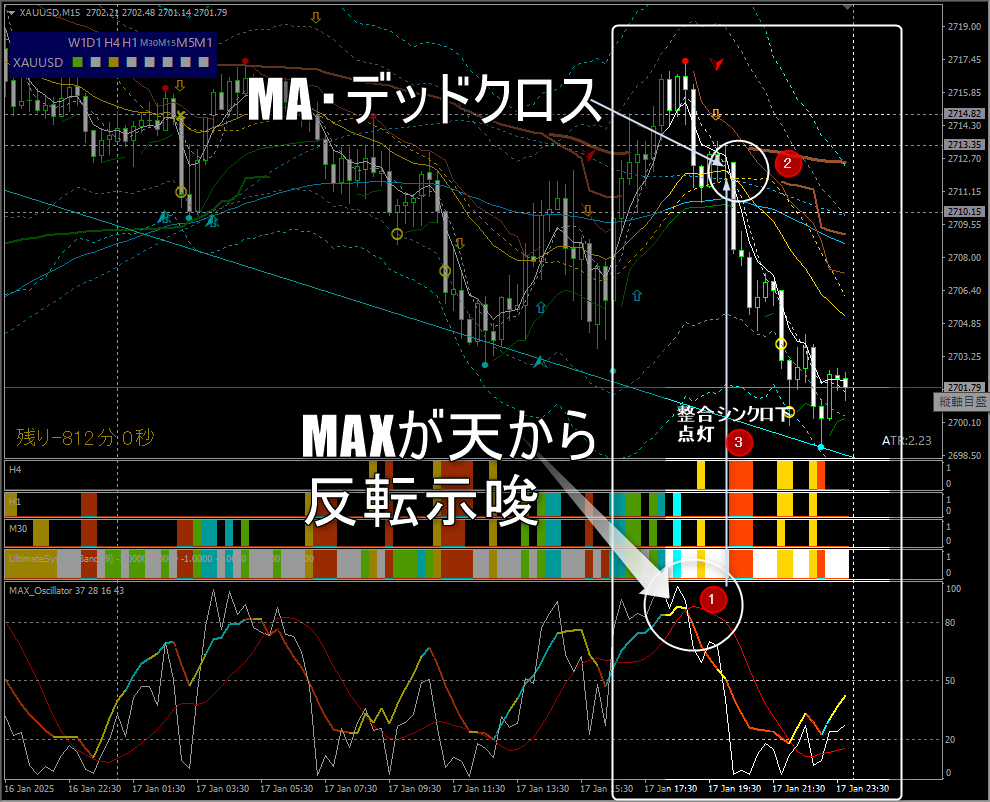
①First, after the white line reaches the top of the window, it turns downward
② MAX Oscillator turns red and the white line crosses below the red thin line
③ MA turns into a death cross
④ Sync Band indicates lower-timeframe alignment (in this case 1 hour and 4 hours) suggesting short
⇒ Enter
※ Sync Band is configured for 5m, 30m, 1h, and 4h from bottom up
It is a very simple method, but
■ For each pair there are only about 2-3 opportunities per day,when joining the wave midstream.
※ Focus point ①Enter when, on the next lower timeframe, from a pullback, the trend direction resumes in the same state
Note ①: To avoid overtrading, check the wave states on the 1-hour and 4-hour charts
Look at the 1-hour chart,when MAX Oscillator approaches the top and you don’t know when it will reverse, beware of chasing
Note ②: When MA positions do not reverse and alignment/synchronization does not continue
If the sync band remains at two levels (30 minutes alignment) and does not develop into 1-hour or 4-hour alignment,and MA5 and MA20 relationship does not reverse,
then retreat promptly
For example, if you aim for a reversal without waiting for GC/DC on the 15-minute chart
Try entering when the same conditions align on the next lower timeframe (here, 5 minutes)
(Trial)
Note: limit only when the MAX Oscillator of the chart you’re watching is near the peaks or troughs
Note: We’ve created two YouTube videos for details; please check below.
Video 1
https://youtu.be/hk73OQ3aR4Y?si=AktMxrf3p0PHekvE
Supplementary video
https://youtu.be/6vNqjNGC_ng?si=nbx2PZwiWF8iVzL9
Please thoroughly understand the procedures, cautions, and focal points, and apply them to verification trading!!!
As you can see, the price movement information indicated by the “Matchless Under Heaven Sync System” is extremely accurate.
Do not go against price movement!
The only absolute truth is what the price movement reveals!!!
※ Today the market is operated by algorithms developed with cutting-edge AI and genius engineers using large sums of money.
Move forward with humility and keep learning and growing!
Matchless Series: About Analytical Tools
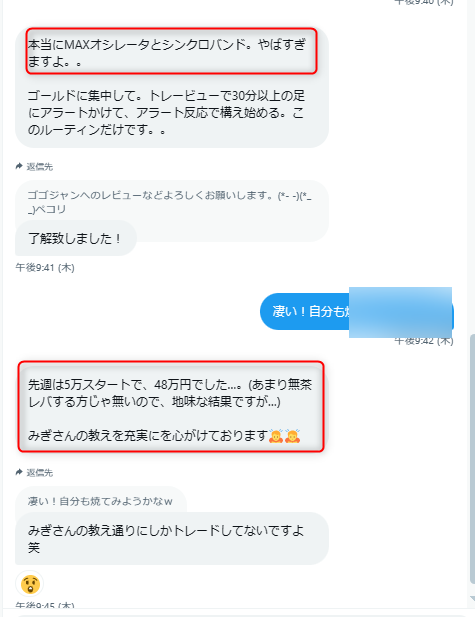
■ Messages from users
※ For details on the Matchless Sync System, please see
“Matchless” Sync System
https://www.gogojungle.co.jp/tools/indicators/50319
Review Version • Ultimate Sync System
https://www.gogojungle.co.jp/tools/ebooks/50353
※ Each system indicator also has a sellout version.
■ MAX Oscillator MT4/5 version
https://www.gogojungle.co.jp/tools/indicators/50340
■ Likewise, the Review Version
https://www.gogojungle.co.jp/tools/ebooks/50353
■ Ultimate Sync Band
https://www.gogojungle.co.jp/tools/indicators/42606