

ワンクリックFXトレーニングMAX機能詳細ページ
Version Upgrade Information※This page also includes images from before the upgrade
▼2025-12-06 v8.33
Added ST button (overwrite default standardized chart),
Initial limit orders TP/SL lines are based on order price
Entry time filter
Trailing stop TP/SL completely separated into two
Trailing stop: Protect/Break-even
Restore object parameters on resume
Trailing stop (AVG, SHRINK) parameter changes
Break-even line thickness linked to TP/SL lines
Parameterization for large 4K displays
▼2025-06-12 v8.26
Chandelier Exit added,
Fee display
▼2025-04-15 v8.22
Fast skip
LINE仕様変更対応
▼2025-01-07 v8.20
AI Judgment
Synchronous chart individual scrolling
Keyboard operation included
Object synchronization tool distribution
▼2024-11-14 v8.18
Reset + TS added,
Font change for messages
Change save date to chart’s date/time
▼2024-09-09 v8.16
Error page display, stronger masking of synchronized charts, start minimized, sync bar adjustments, BE line swaps, removal of stop-limit order at settlement, start button on launch, downloader fix, one-click SA warning handling, other bug fixes, parameter and color tweaks, bug fixes in included items
▼2024-06-06 v8.0x:
Line thickness parameter added,
Auto-split orders added,
Margin and currency pair mismatch message fix,
Support Assist added,
Entry timing color bar added,
Spread added to SL calculation,
Time leap feature added,
Resume from last session added,
Past verification viewer added,
Strategic close added,
Flexible trailing stop added,
TP TS and SL TS processing, button separation,
Double-click to clear messages added,
Keyboard settlement added,
Package for perks indicators, etc.
▼2023-11-12 v7.60
Next bar advance button added,
▼2023-10-20 v7.51
Add color to close messages,
Clicking history date displays results
Other bug fixes
▼2023-09-29 v7.50One-click Auto Arrow Trading【AutoArwTrade】supported
Add buy/sell settlements in signal linkage
Change display of P&L and size in history
Speed up signal linkage
Add credits to P&L calculation
Add initial-only to server orders
Change minimum RR to 0.1
Show TP/SL line on order time as well
Add initial position parameter for control box
Automatic generation of active synchronized charts
▼2023-04-12 v7.2x
Activate synchronized charts
Save button for templates
Fix jitter in position bar
Display, comments, etc. corrections
▼2023-03-11 v7.11
Add WebRequest to license authentication
ASP restrictions対応
Auto N-Blocking button
Text size scaling
Add speed list
Support multiple signals
Slack notifications
2022-09-16 v7.010 bug fixes, etc.
▼2022-09-04 v7
Add limit entry orders
Automatic risk% calculation
Margin profit% (risk%) added
Daily profit% display, trade history display
Position information display
Risk-reward added
Position triangles changed
Daily aggregation image auto-save
Synchronized chart right-edge shift support
Auto-save of all trade images
Add updated calculation for risk% improvements
▽2022-04-16 Update
- Add reset flags for TP/SL/TS at all settlements
- Fix NONE triangle bug, etc.
▽2021-10-15 Update
- Immediate display of position at entry
- Disable value for tool control TP/SL
- Reject entries on negative
- LINE,Discard notifications added
- Triangle color changed to mid color with BUY/SELL
- Add default parameter values
- Add message display area for errors, executions, etc.
- Reduce load during speed control
- Support for some fee-bearing accounts
▽2021-06-02 Additions
- Strengthen signal tool linkage
- Instant change of standardized charts (templates)
- Change TP/SL by dragging with mouse
- Add forced stop-loss line
- Individual position settlements
- Partial settlements (50%, 30%, etc.)
- Add white space at right edge of synchronized charts
- 3D-like buttons
- Sub-panel usability improvements
- Compact mode for control box
- Several sample standardized charts
▽2020-08-08 Additions
- Signal tool linkage
- Auto-save of trading images
- Change control box color to your liking
- Break-even line
- TP, SL lines
- Display in PIPS
- Parameter cleanup
- Bundle of PIPS Grid for PIPS-based lines
- Position display in synchronized charts
- SL standard/trailing
- Auto-Nanpin on SL
- Lines at a specified percentage of funds
▽May 25 Additions
- ASCII-like AK line for quick profit/loss
- Auto ON/OFF for auto trailing
▽May 1 Additions
- Disable TP/SL to 0 at order
- On profit realization, enable trailing by limit order
- PIPS display for P&L
- Negative shown in red
- Currency name added to P&L ALL, RESULT
▽ Mar 27
- Display current spread (including real version)
- Show position limit P/L and stop/limit indicator
- On order, see TP/SL and SL
- Orders with multiple TP/SL
- Trailing stop with MA, BB, SAR
- Time drift and DST settings
- Sync with other charts with magnification
- Add dedicated templates
- Easy practice
- Line trading, limit orders
- Flexible trailing stop
- Strategic Close
- Trade totals & win rate display
- Chart synchronization
- Speed control and auto stop
- Backtest viewer
- Restart, time leap
- Replay
- Auto-saving of trading images
- Signal tool linkage
- Entry assist
- AI Judgment
- Economic indicators display
- Standard equipped report function
- Other features
- Included tools, configuration files, etc.
- Free download from support blog
- From the author
Easy practice
One-click FX Traininguses MT4 tester charts to practice trading. Enter with one click, exit with one click—it's simple.
After downloading the product, copy the product to data folder and press Start in Strategy Tester! If you’ve used MT4 before,you’ll be able to start practicing in about 3 minutes.
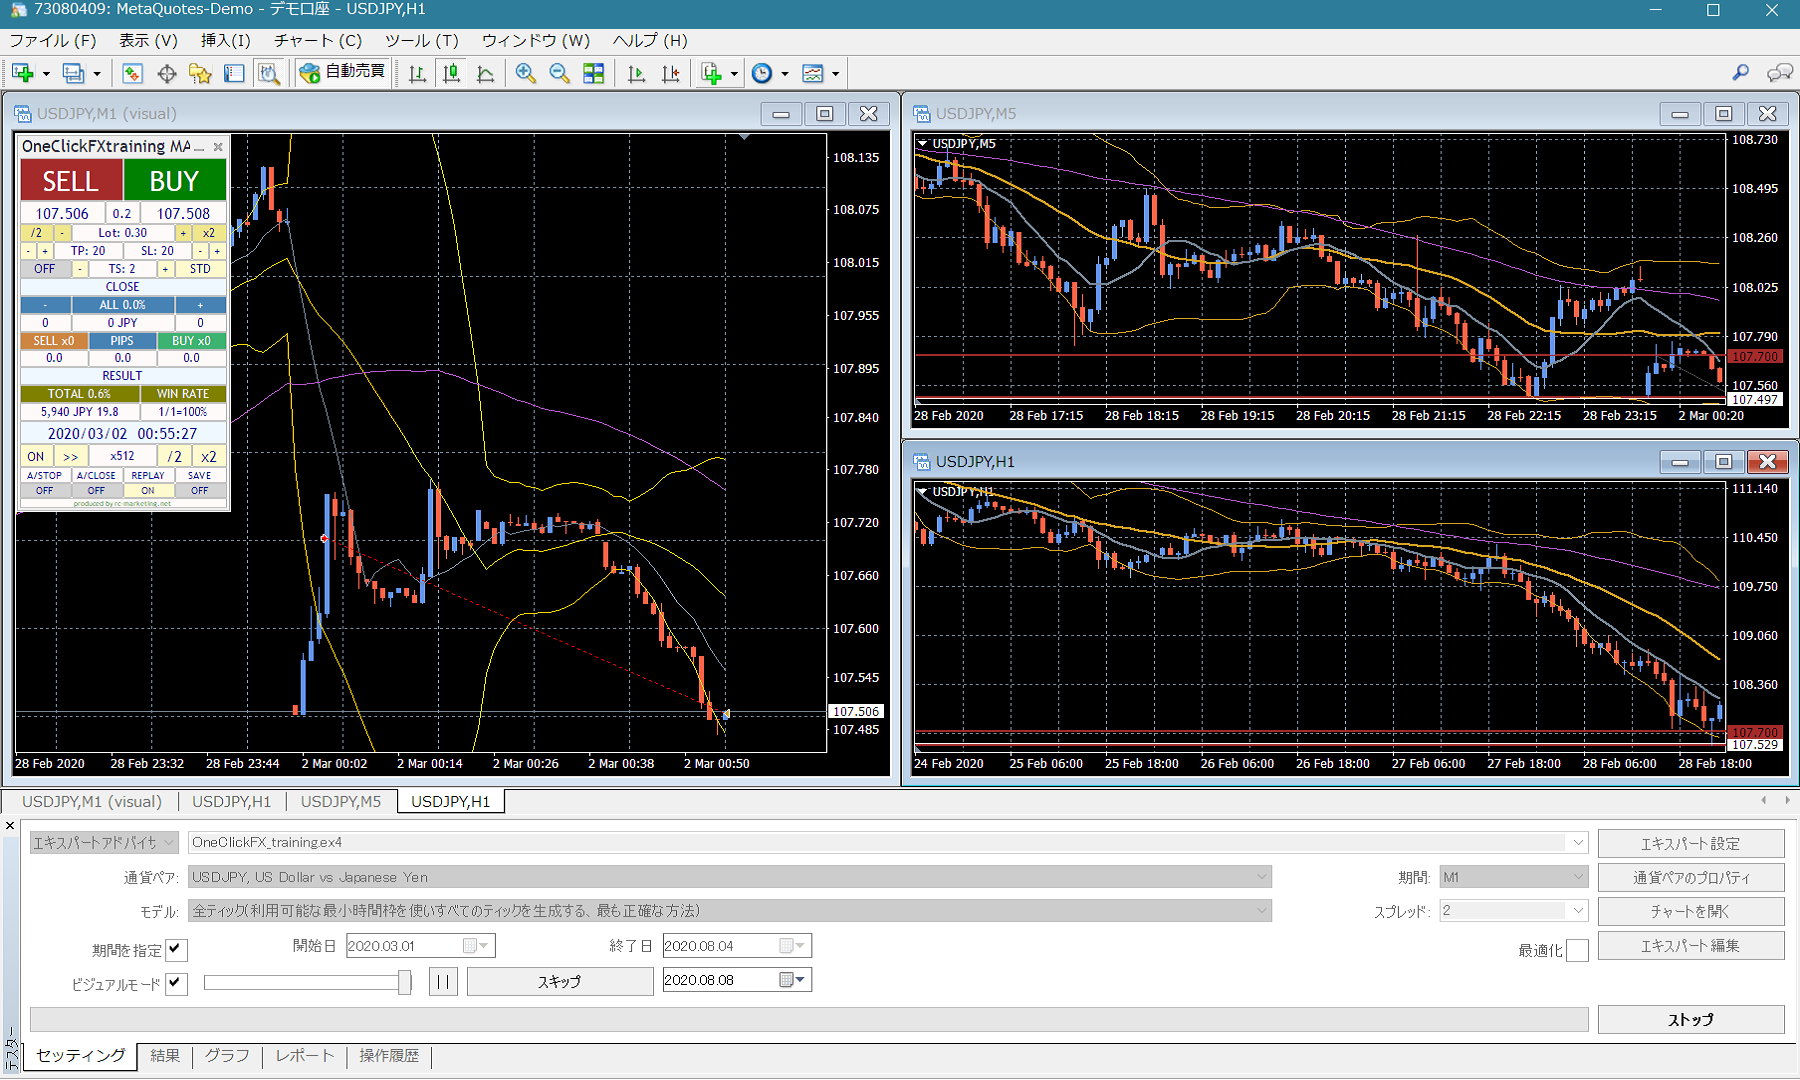
This is the overall screen layout.
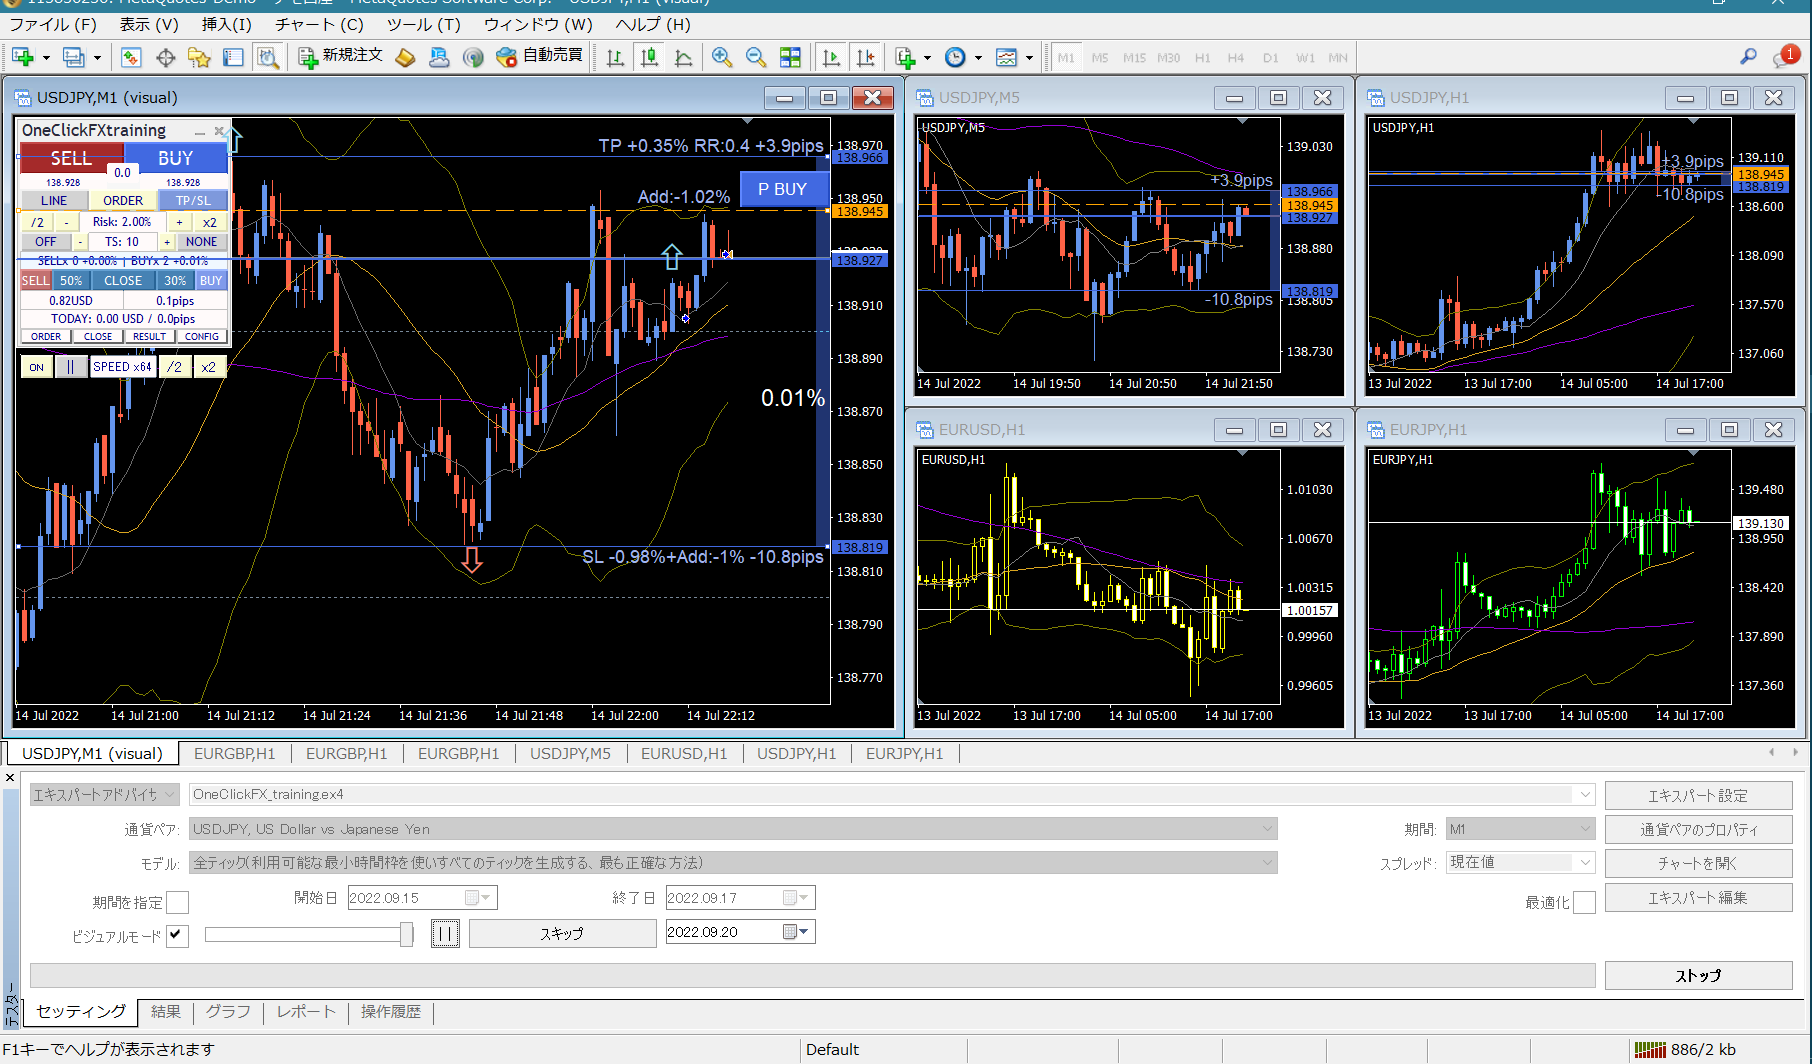 In the top left, there is a control box forOne-Click FX Trainingon the chart.
Here is an enlarged image and explanations of each part.
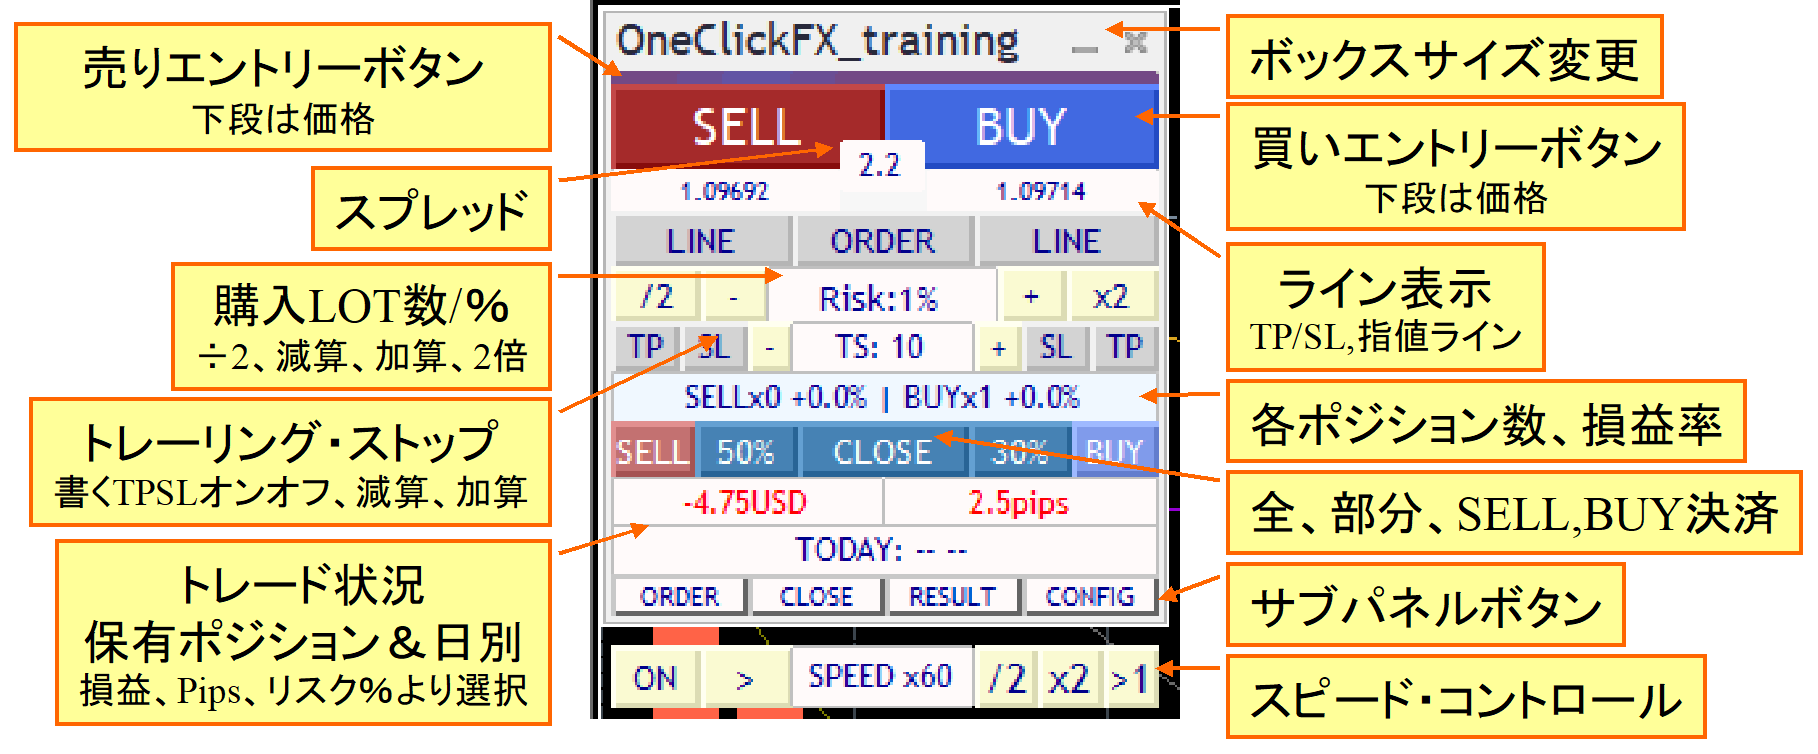
To enter, use SELL/BUY above; unlike MT4’s standard function, you can set settlement limit (T/P) and settlement stop (S/L), so when you press a button these are automatically added.
Usually you cannot change order contents in the Strategy Tester, but this product allows free changes to tool-controlled settlement orders, settlement stops, and trailing stops.
The lot size can be adjusted with the plus/minus buttons that increment or decrement in small steps. You can also automatically calculate lots from risk%, even when a loss occurs.
PIPS display has been added in response to customer requests. Regardless of lot size, you can view only the change in PIPS to objectively assess profit/loss.
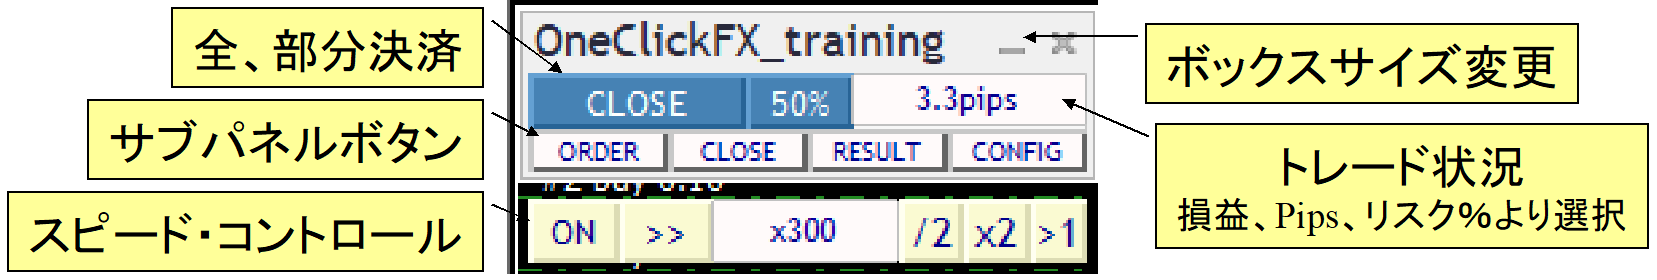
There are not only full settlements but also 50% and 30% partial settlement buttons. This number can be set freely in parameters. Partial settlements settle a portion of the order’s units.
Simple focus mode for the control box that does not hide the chart.
▼ If you just want easy practice, this is enough
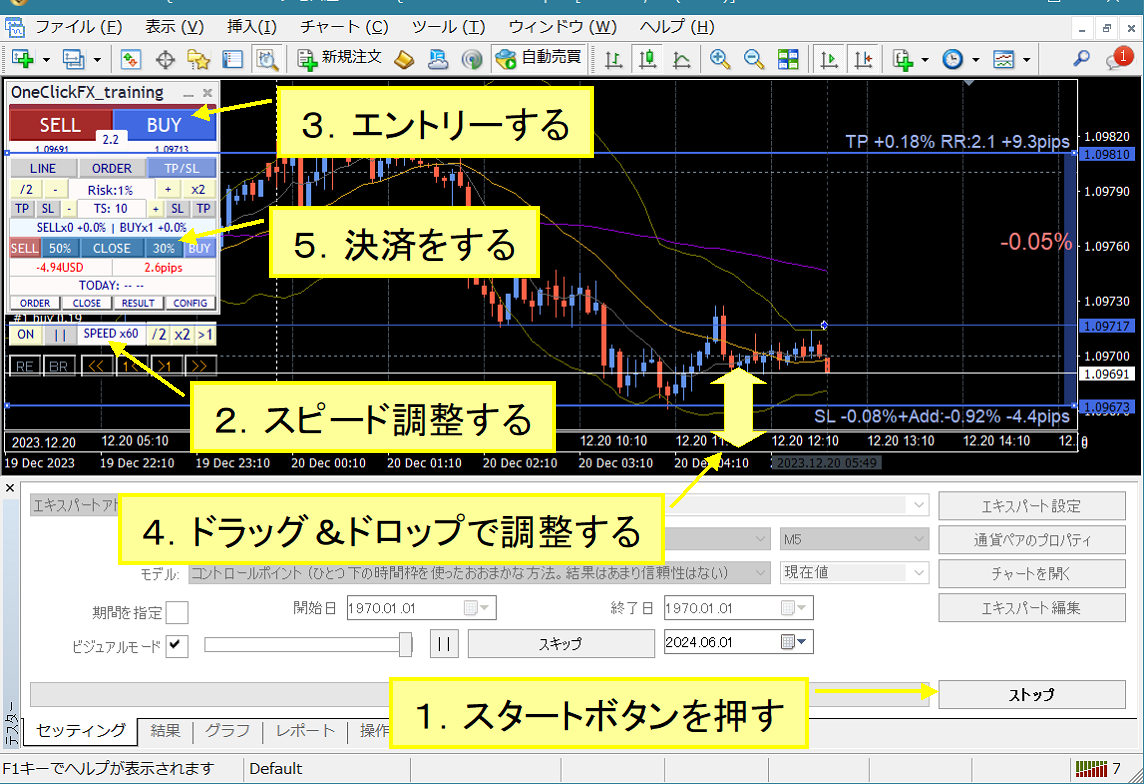
One-Click FX Training MAXis an extremely feature-rich tool; as you read this page you may feel it’s complex, but it can be operated with standard FX methods in initial setup. Server orders and full settlements using TP/SL lines are supported.Staring button starts, entry via buy/sell, manipulate TP/SL lines, close with settlement button; standard operations, nothing special.
Even FX beginners and first-time traders can quickly feel the ease of operation and improve trading skills.
Sub panels offer detailed, adjustable controls!
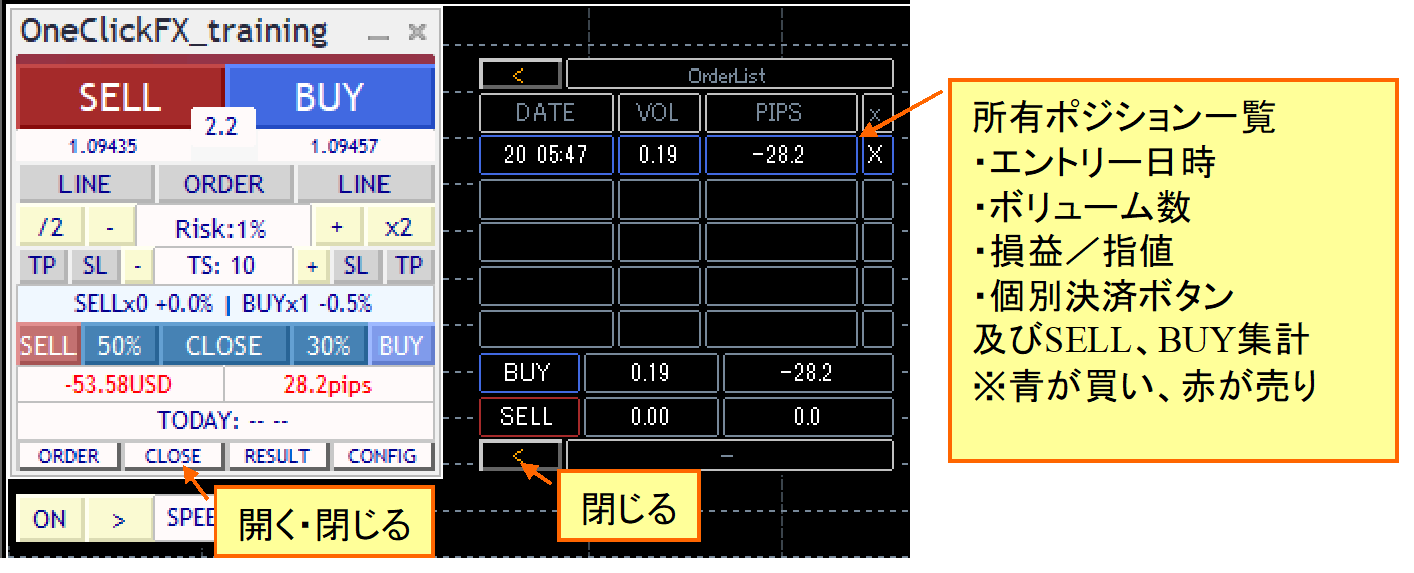
From the Order status, you can. Each position’s PIPS are displayed on the chart. You can also cancel limit orders.
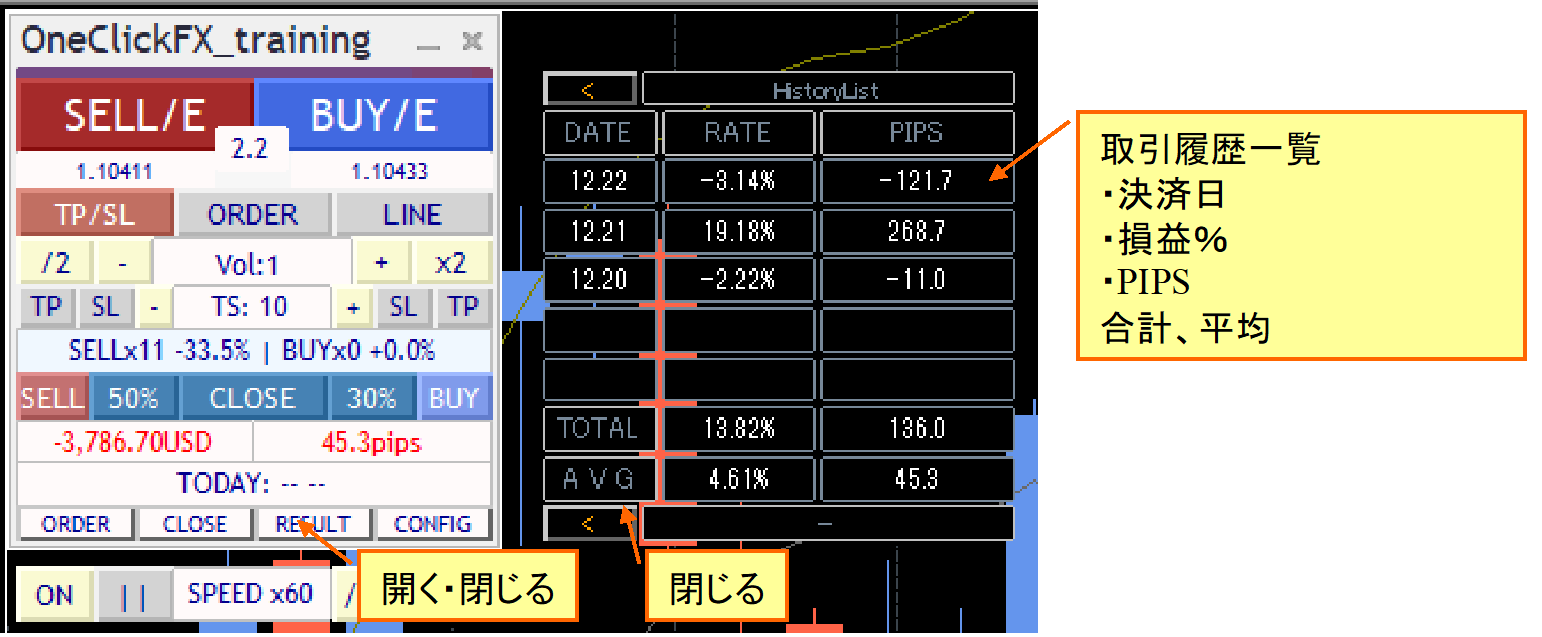
Daily settlements are shown in the settlement history. Daily profit/loss and the past five days’ totals and averages are displayed. The chart shows trade history and individual PIPS values.
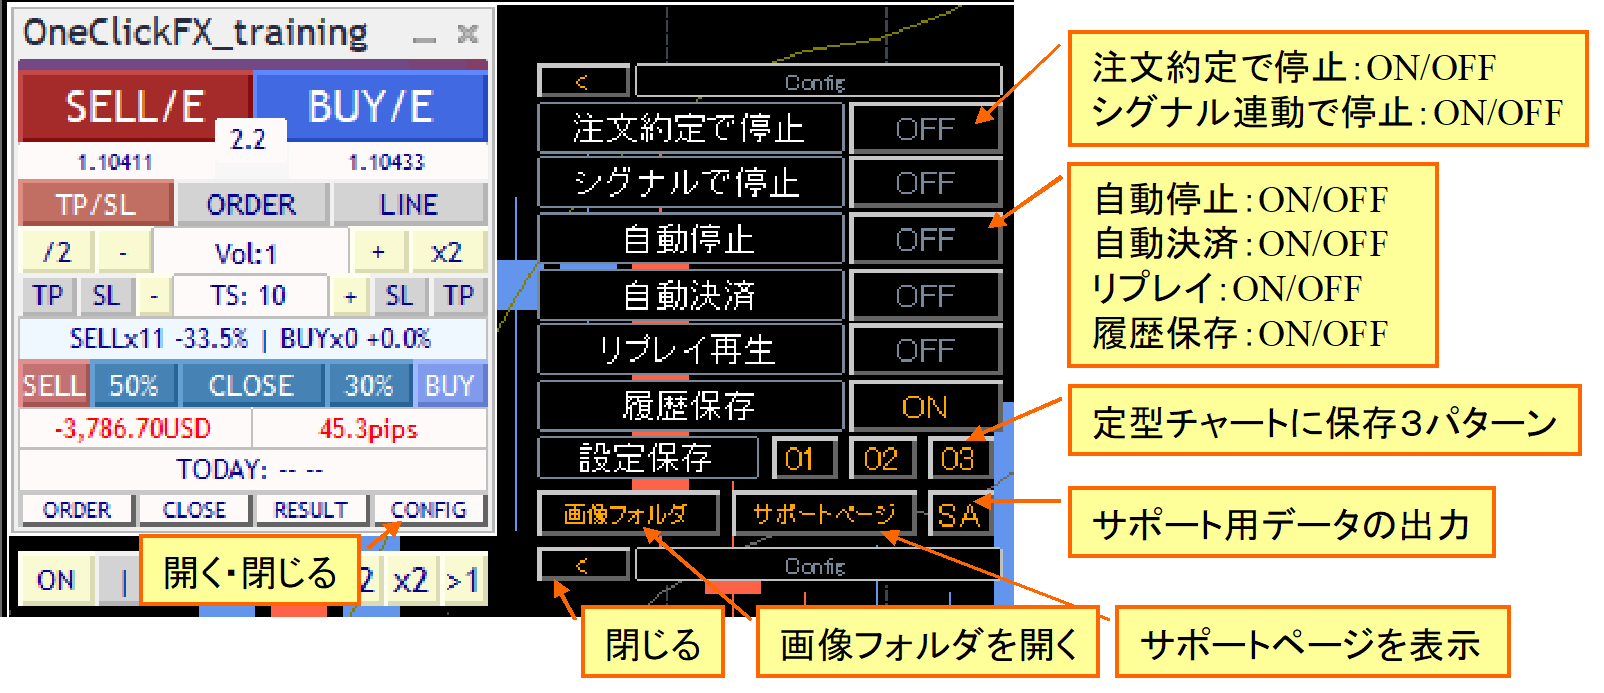
Auto-settlement and replay features are simply displayed in the sub-panel
Line Trade, Limit Orders
■Auto calculation of order lots
We now support risk%-based lot calculation that limits loss to a percentage of margin relative to SL line, instead of traditional lot-size-based orders.
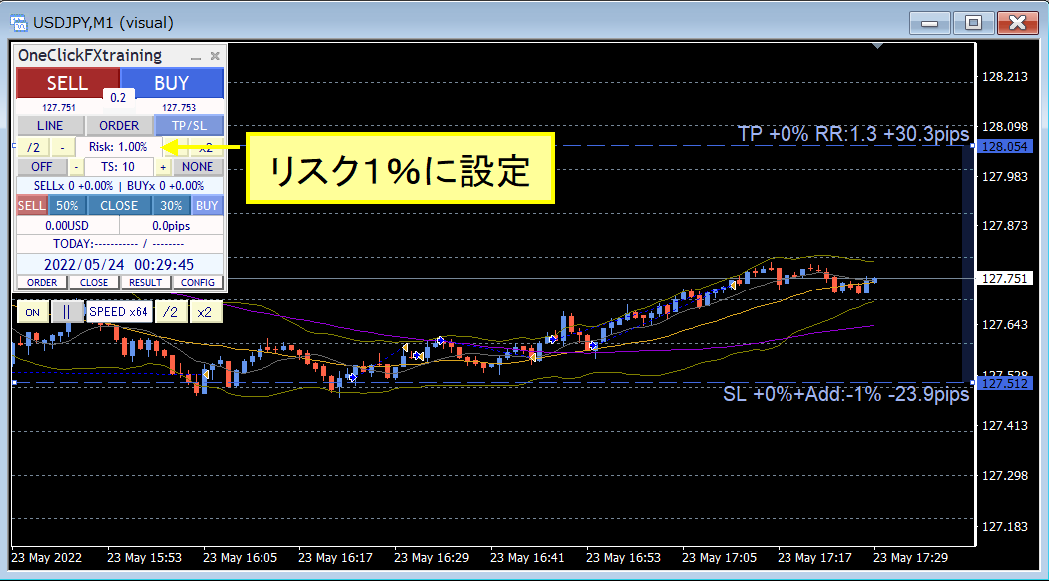
Calculation is always automatic, so as a position moves into the positive, you can raise the SL line and add entries without increasing risk% or, similarly, set initial risk to 0.5% and raise risk to 1% when it moves negative and adjust the SL line to perform averaging down, enabling flexible trading.
...
■Limit orders
You can place limit orders to be executed when a specified price is reached.
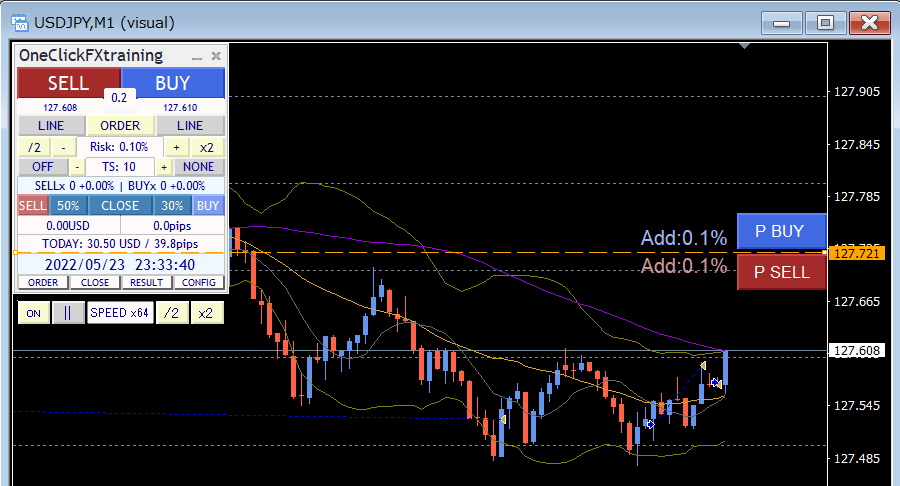
Press the ORDER button in the control box to display the limit line. There are P BUY and P SELL buttons to place limit orders for BUY/SELL. Limit/Stop are auto-detected; pressing P BUY or P SELL places a pending limit order.
You can order by risk% from the SL line or by lot size. If you order without displaying TP/SL lines, default initial values apply.
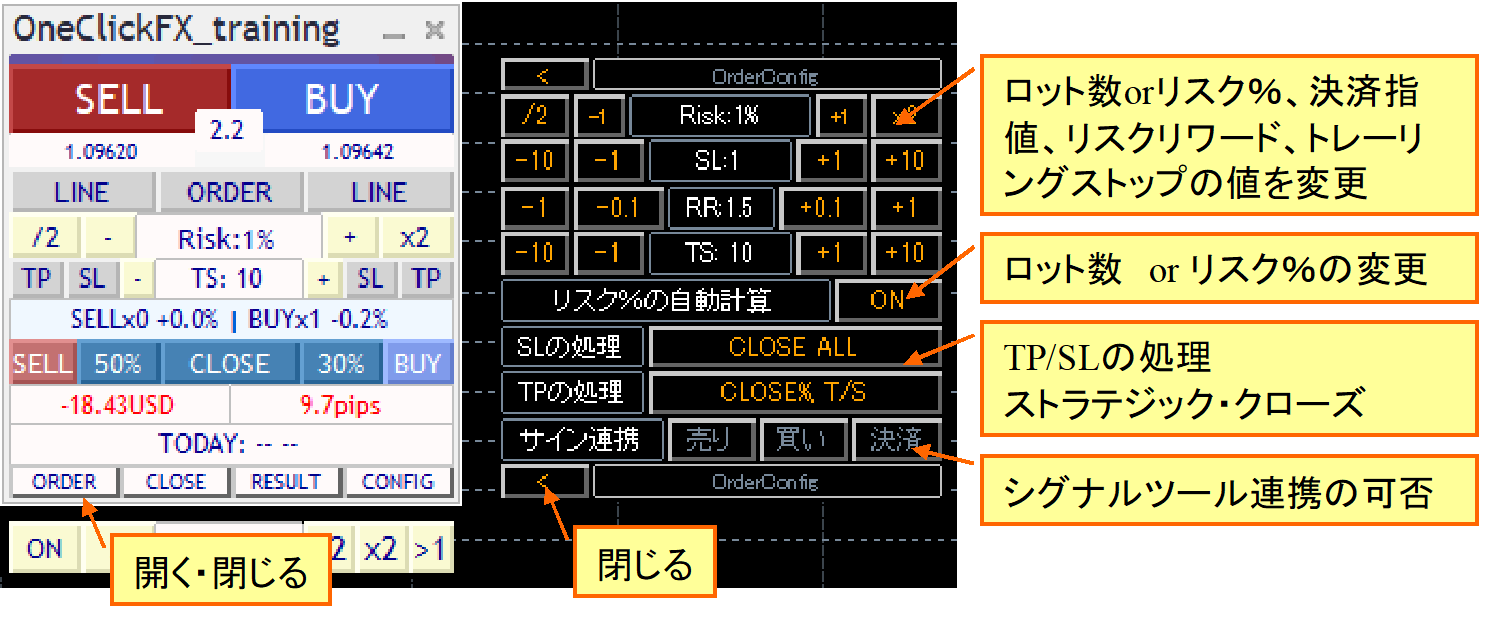
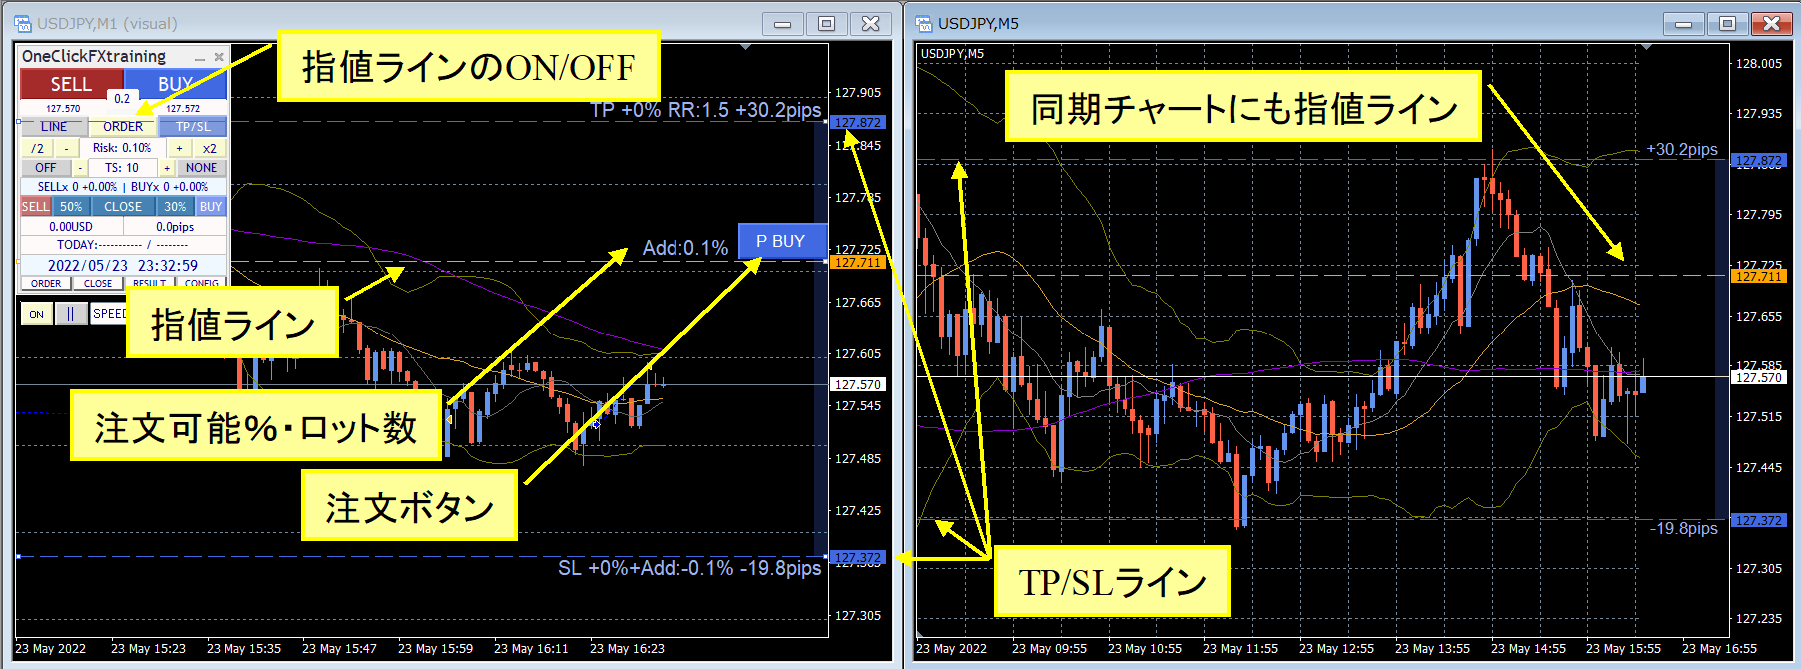
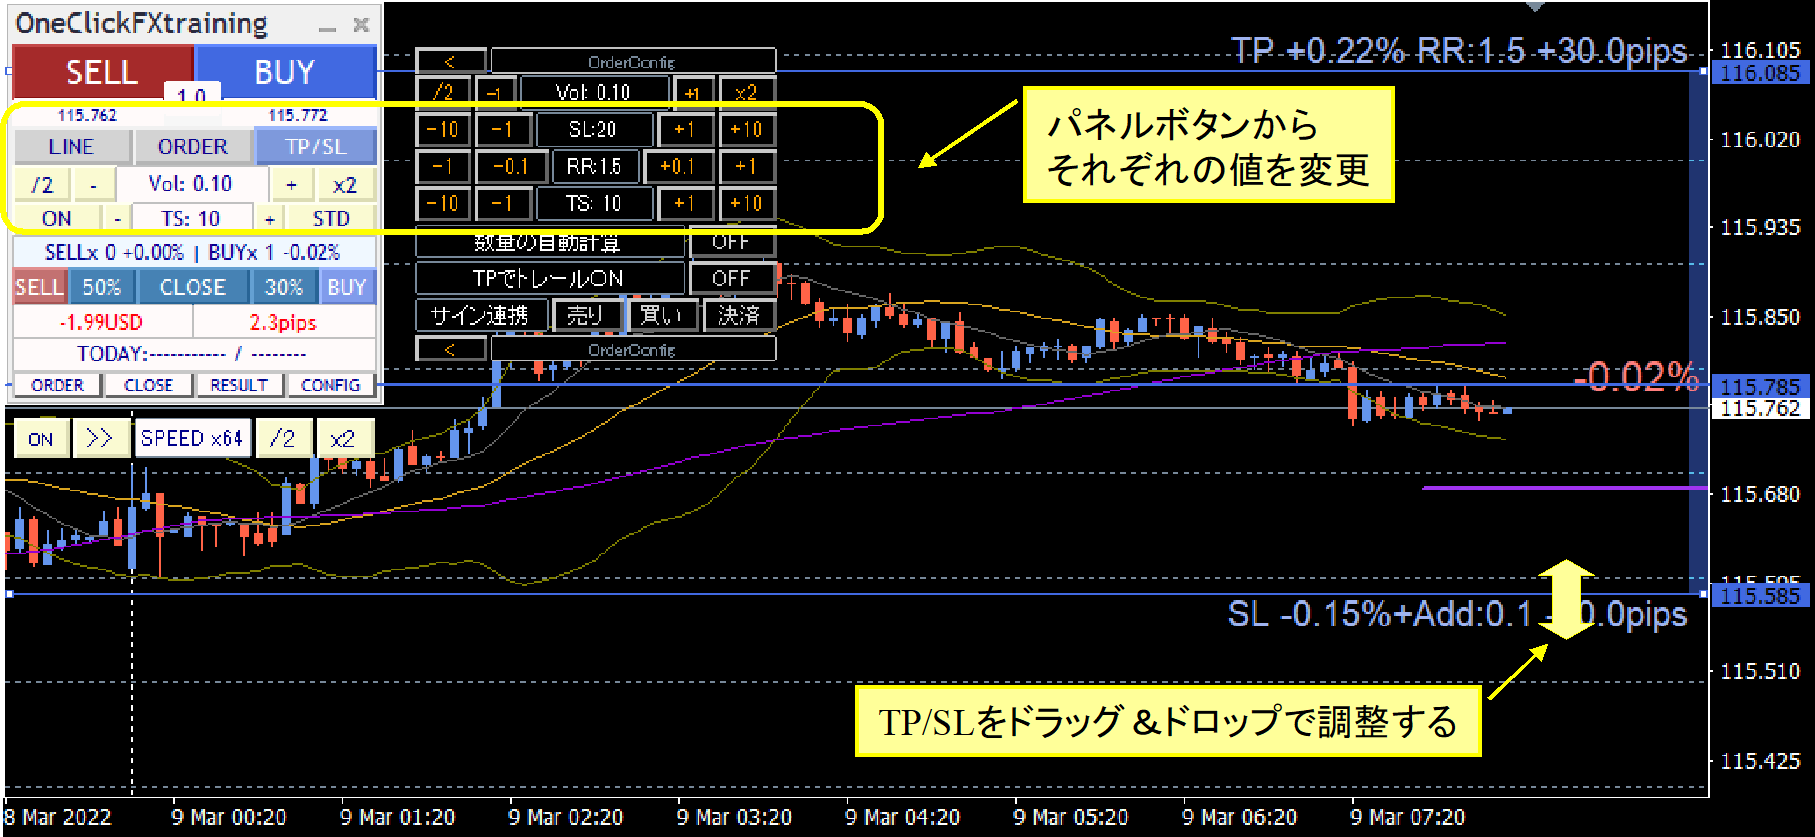
■TP/SL lines are easy to see and movable flexibly.
To clearly identify held positions, lines for break-even, TP, SL, and trailing stop show the margin change rate (risk%) based on the break-even line, risk/reward, additional possible % or lots, and PIPS.
TP/SL settings can be shown as needed or hidden if not required. You can control not only via software but also place orders with the server and set TP/SL there.
TP/SL and trailing stops can be changed while running. Tool-controlled TP/SL lines can be changed bydrag & drop.
■Status of each position
From the CLOSE button, open the sub-panel OrderList to view each position’s details and current status on the chart.
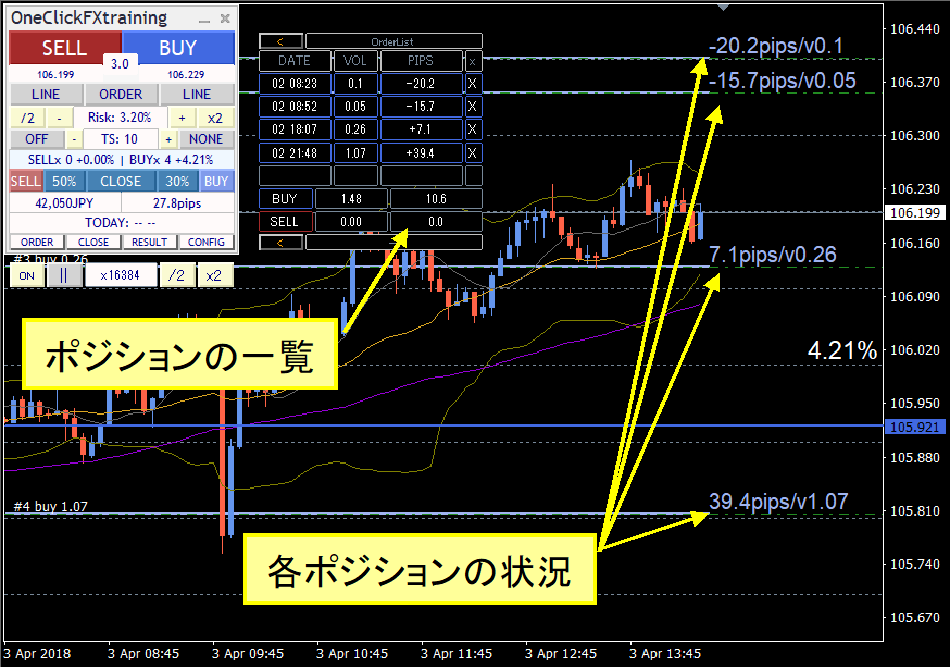
They are displayed in sync with the sub-panel visibility.
Each position’s lot size and current PIPS are displayed.
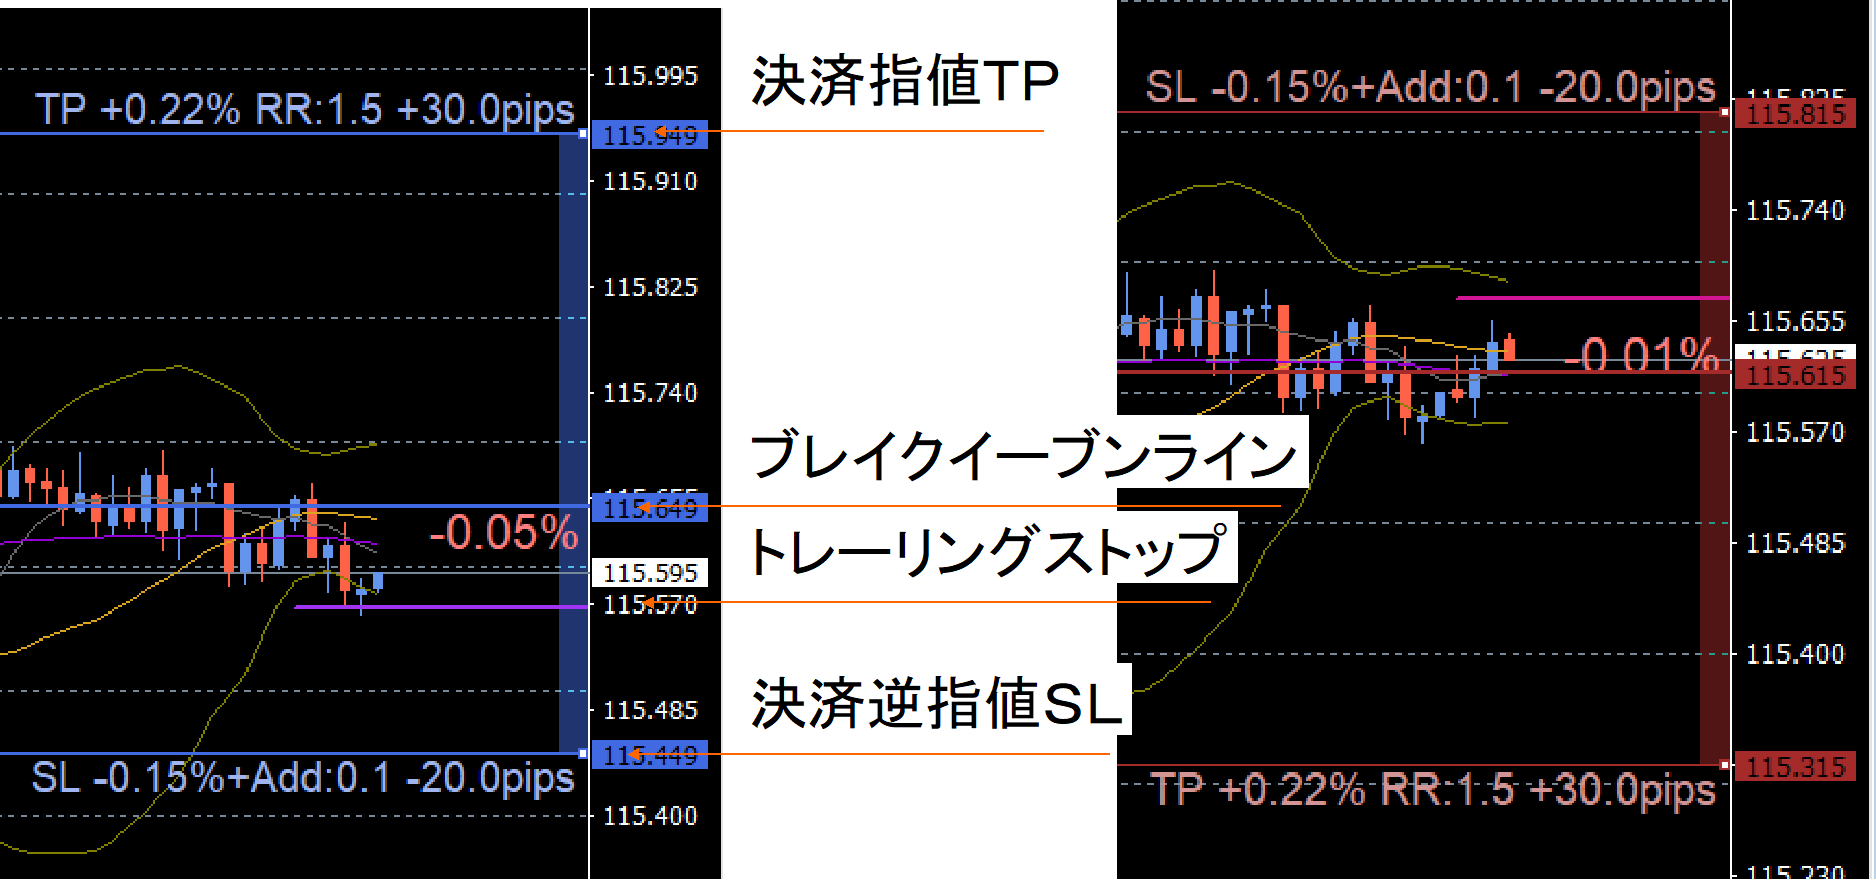
Flexible Trailing Stop
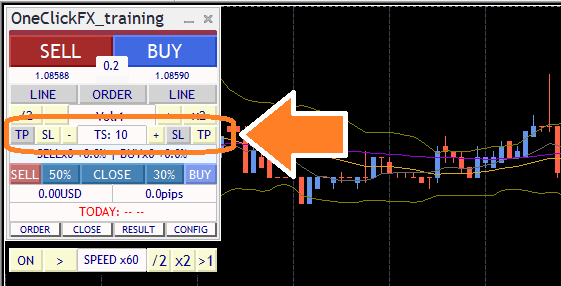
In the operation panel, each trailing stop TS block can turn ON/OFF. You can set SELL’s TP, SELL’s SL, TS values first, then BUY’s SL, BUY’s TP, controlling four trailing stops separately.
The trailing stop purple line is dashed when OFF and becomes solid during active use.
Trailing stops come in many modes.
From standard fixed-value trailing stops to Shrink that tracks tick-by-tick, tick-average, moving average, Bollinger bands, SAR, Chandelier Exit, and many others, you can choose the best pattern.
This video compares conventional fixed trailing stops with Shrink L. Both follow new highs, but Shrink moves the exit line closer to the current price if new highs aren’t reached, aiming closer to profit peaks.
Fixed trailing stops lock in losses as prices retreat from peaks, whereas Shrink brings the exit line closer to profit peaks, allowing closer capture of gains.
■Chandelier Exit
Chandelier Exit uses ATR to automatically adapt to volatility. It widens in strong trends and tightens in ranges or less volatile periods, enabling stop-loss management that better matches market conditions.
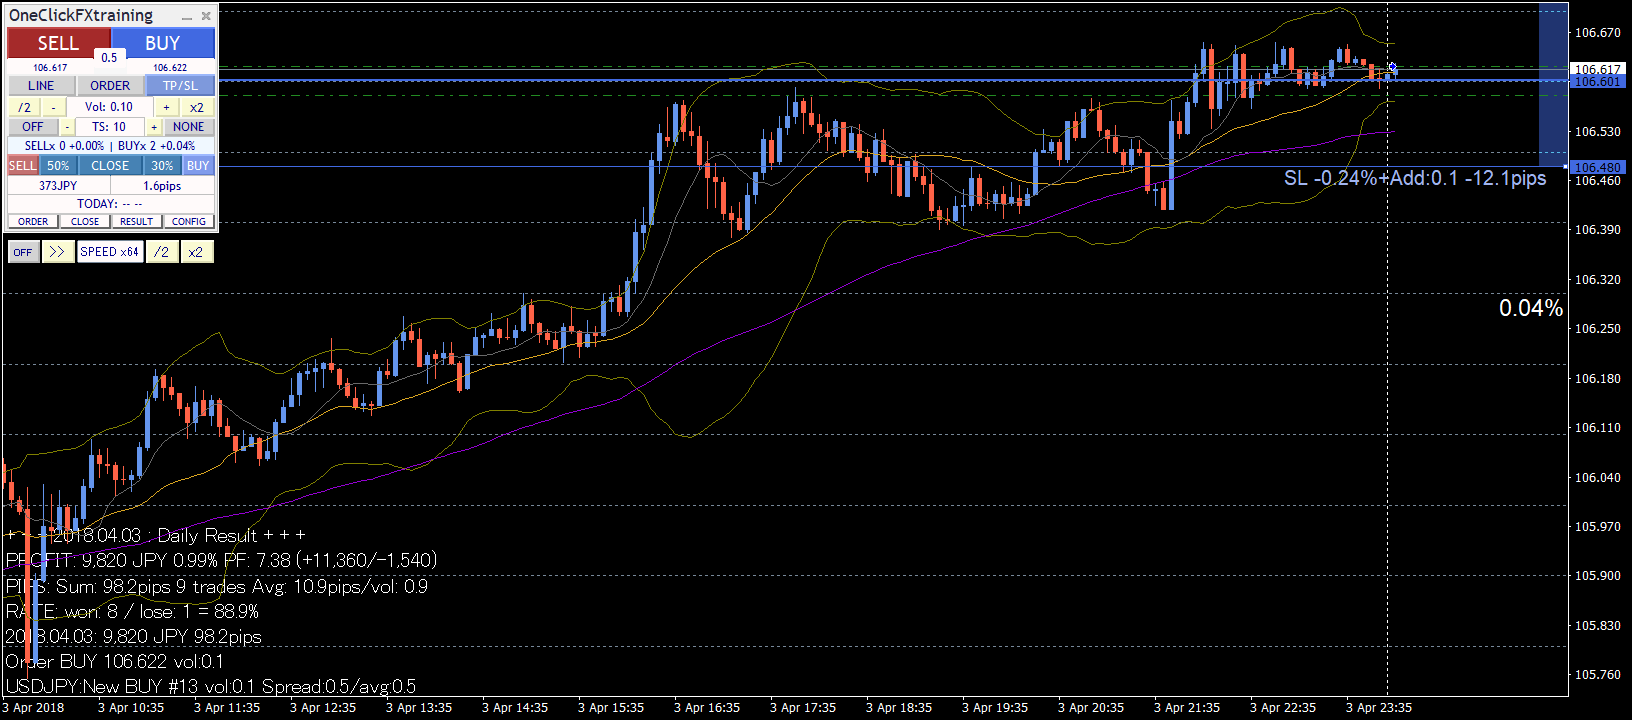
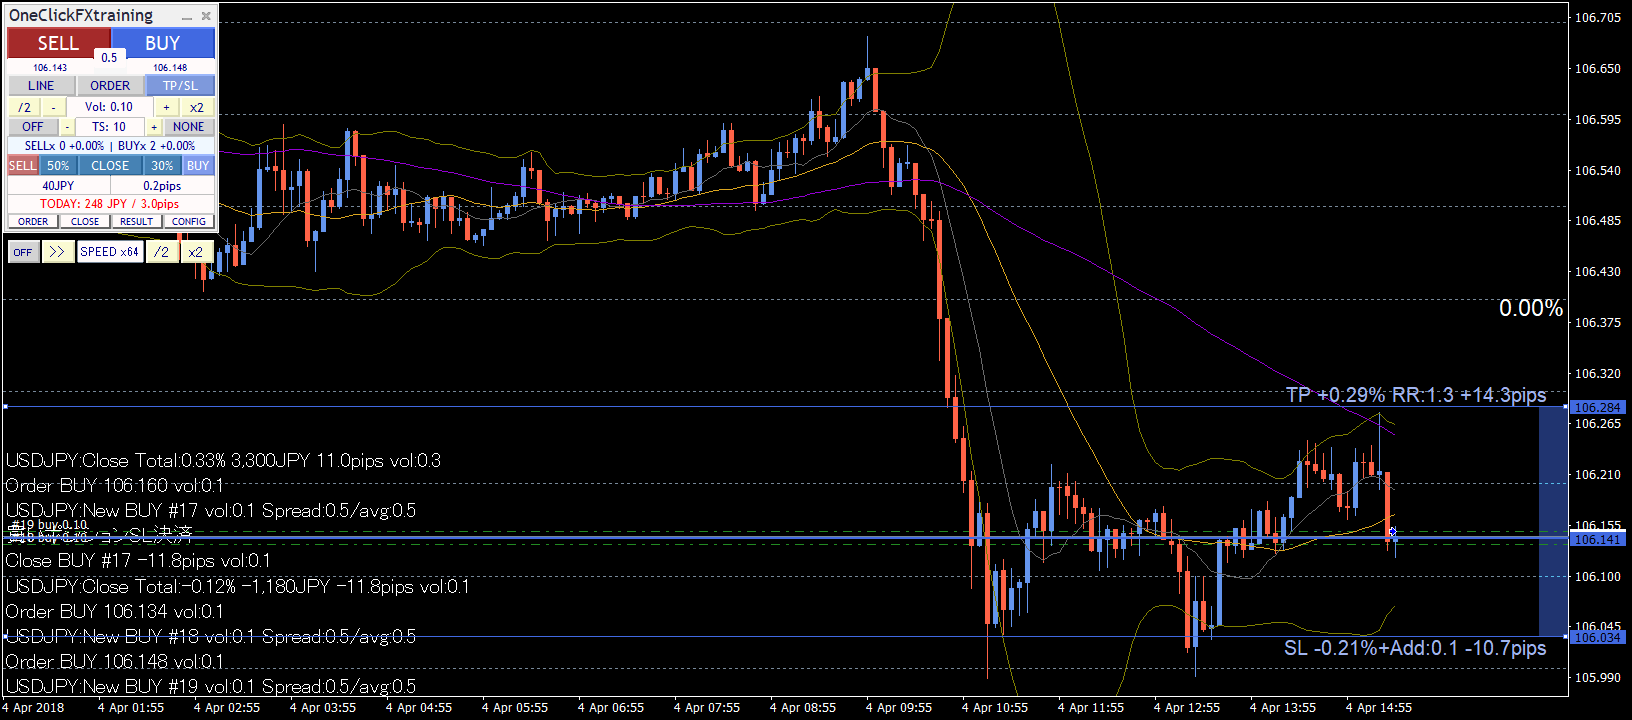
Strategic Close
Usually, settlements occur when prices hit TP or SL lines; Strategic Close allows multiple actions at that moment to improve future prospects.
Automatically turn on trailing stops when TP is in profit range. If you close when profits are rising, you may miss extra gains, but by activating trailing stops you canfurther extend profits.
All settlements, partial settlements, trailing stops, TP/SL line resets, and additional buys can be combined to pursue your own strategic settlements.
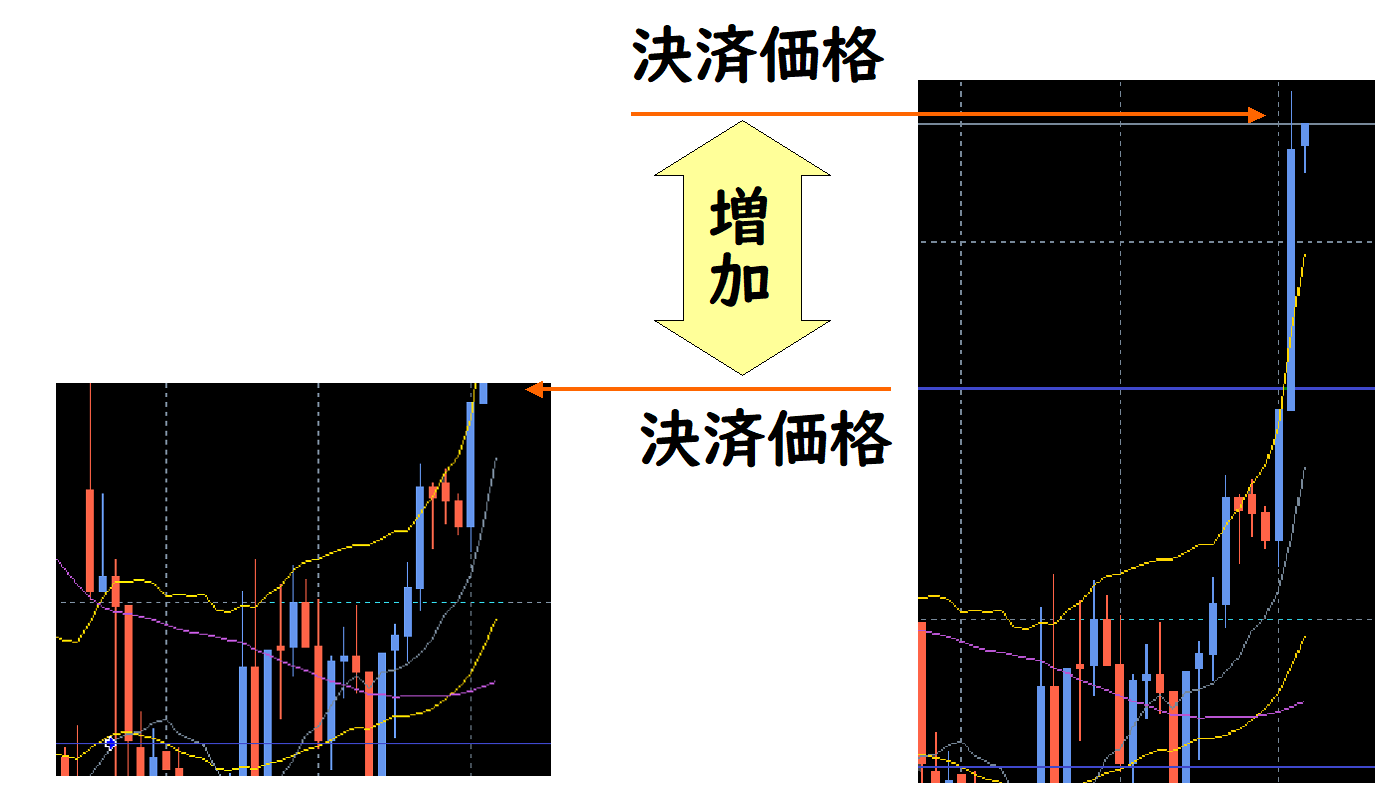
In this image, 30% is settled when TP is reached, securing profits and resetting the TP/SL lines, sothe SL line moves above break-even, ensuring remaining positions don’t incur losses.
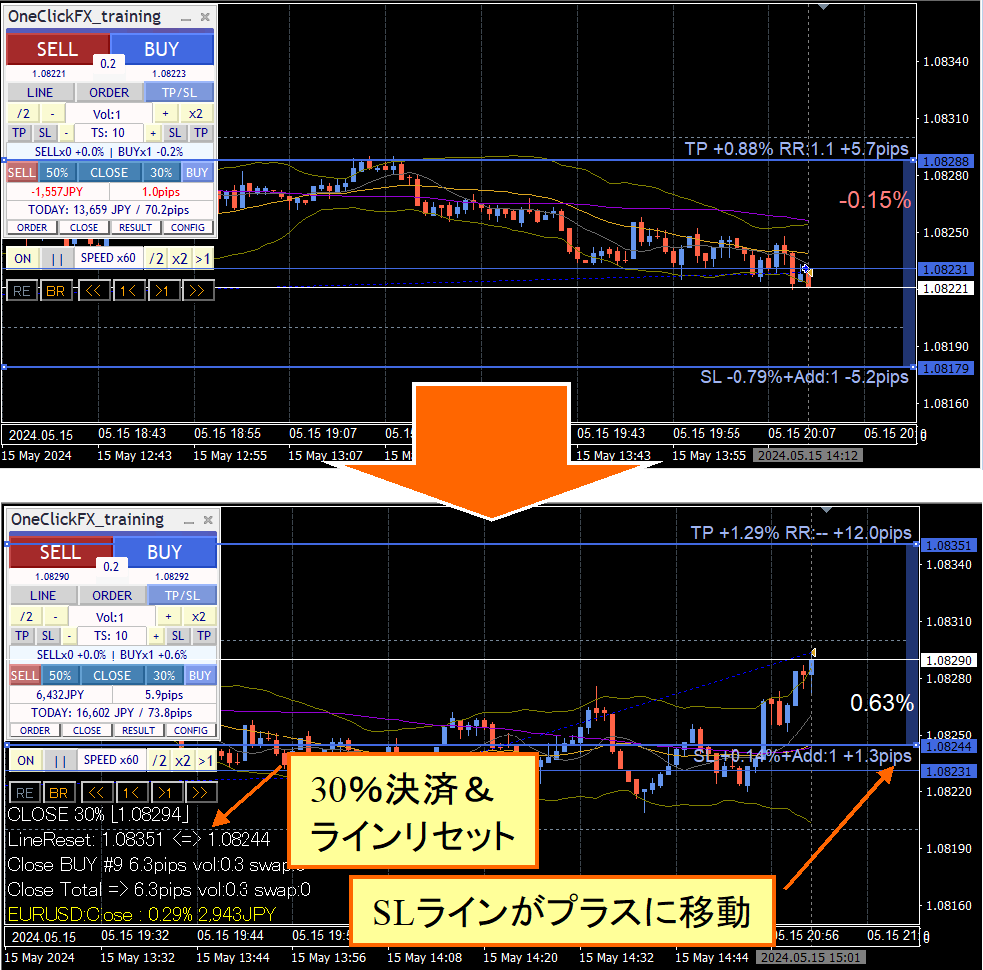
In this video, TP line settles 30% and resets the line, while further orders are placed on the SL line. The left chart is 1-minute, the right is 5-minute. When TP line is reached, partial settlement occurs and TP/SL lines reset. Viewing the 5-minute chart on the left helps understand TP/SL line changes.
In principle, if prices rise, partial settlements occur; if they fall, add orders, soas long as the trend continues, profits can be infinite. Of course no market lasts forever, but in a rising index it might not be impossible. Test it.
Using additional entries, scale-in and buy on dips can be automated. Not just settlements, but by specifying actions on the TP/SL lines, you can realize strategic trades previously impossible.
The impact of this feature will be understood by experienced users. One-Click FX is a pioneer, but it’s natural to be copied as a standard feature.
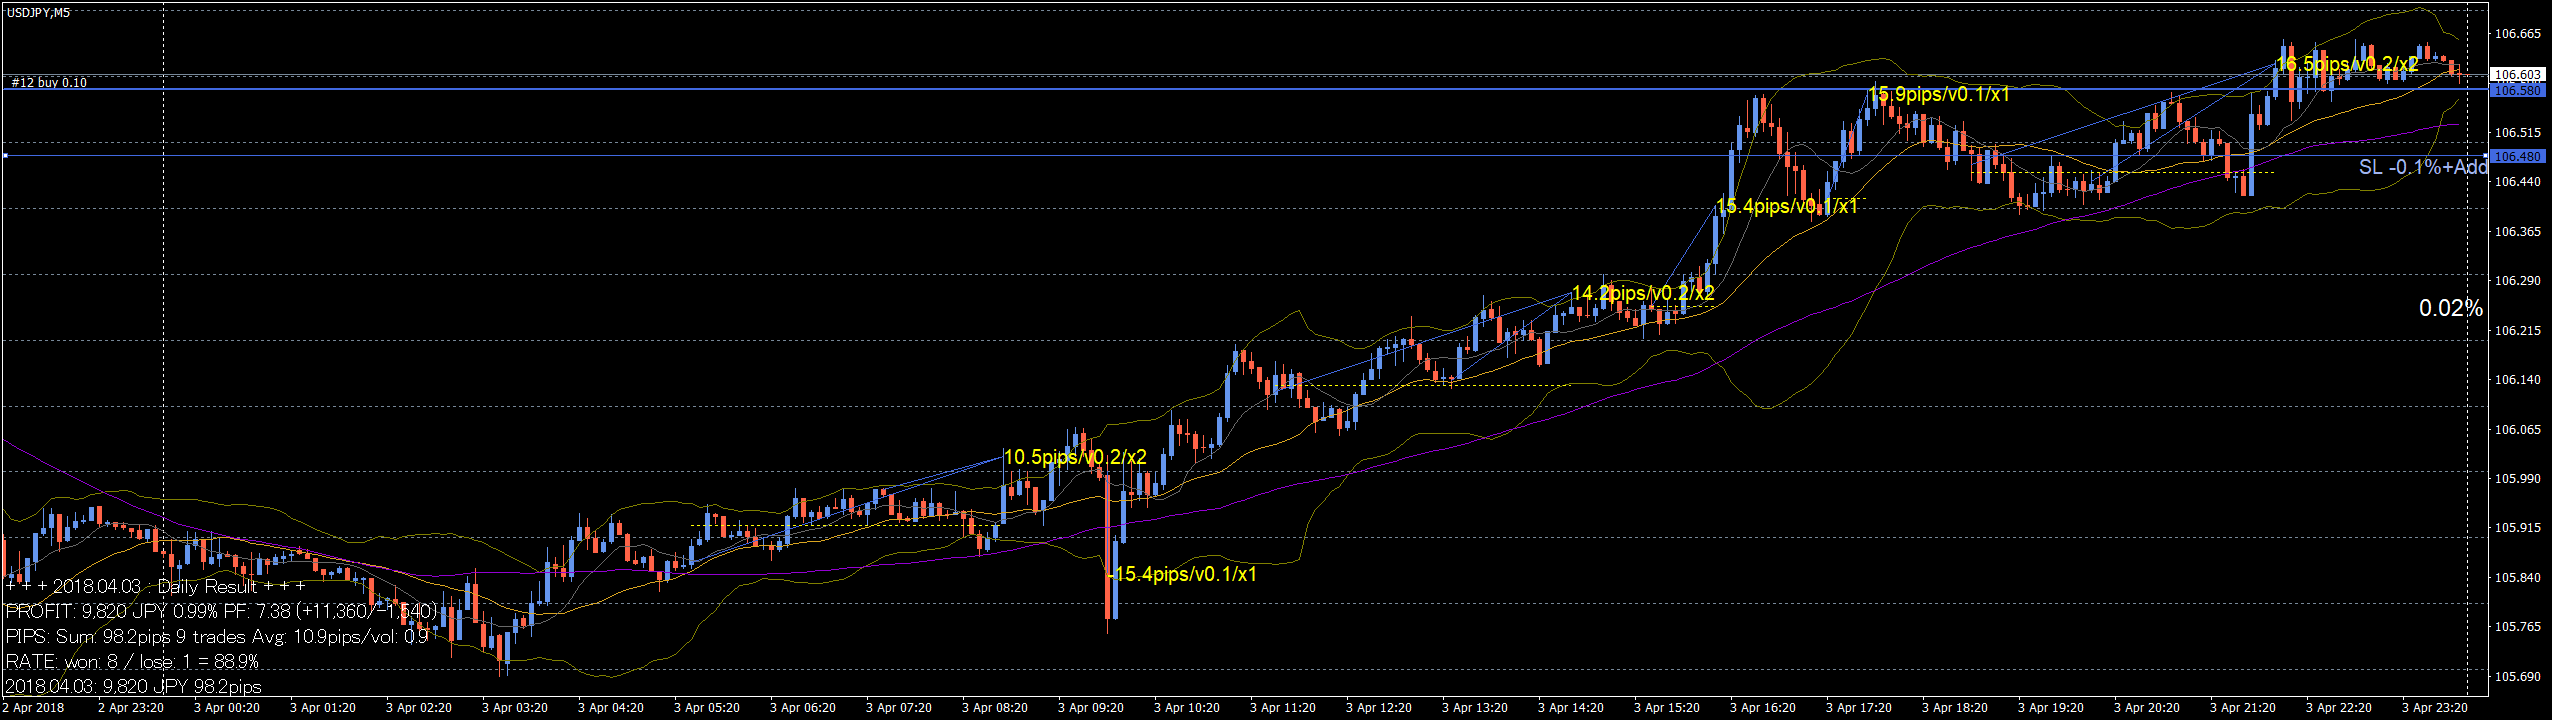
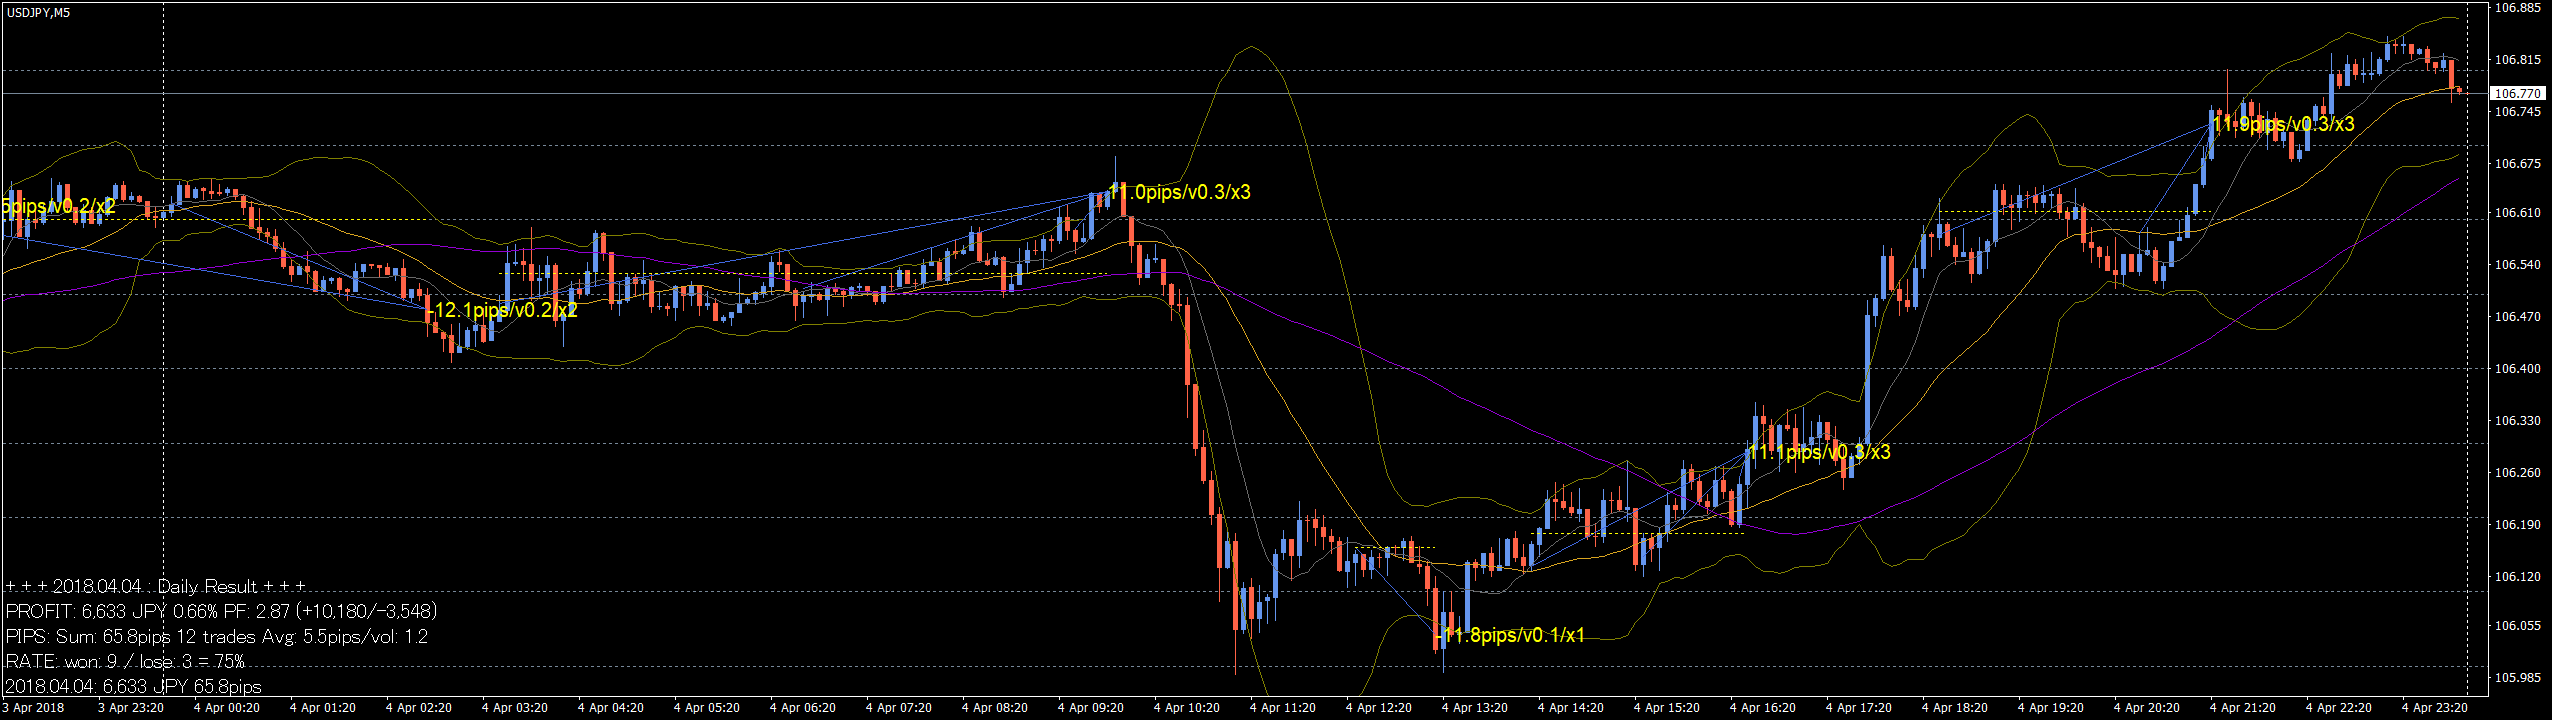
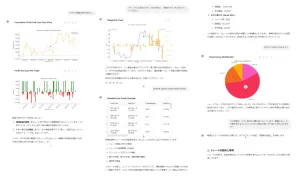
Trade Total & Win Rate Display
You can choose from today’s results by Profit/Loss, Risk%, or PIPS.
Open the RESULT sub-panel for daily totals, past five days’ totals and averages; the chart shows trade history lines and results. Clicking the sub-panel’s date (or TOTAL) on the left bottom shows more detailed totals.
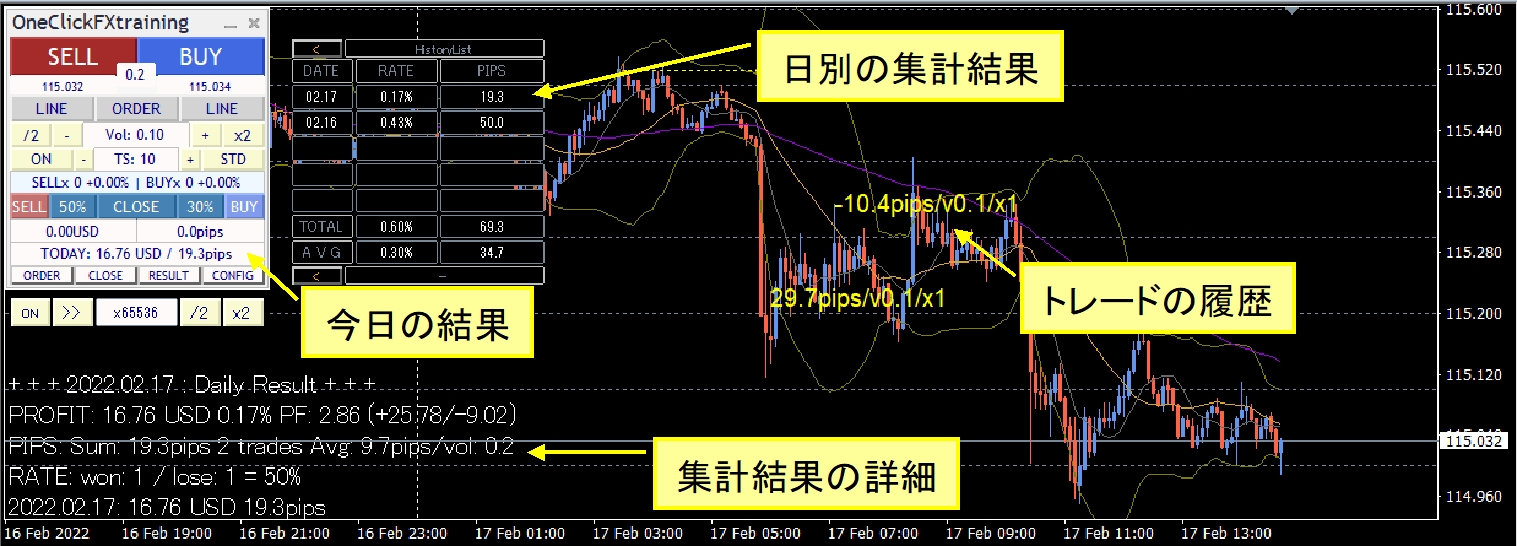
Positive numbers are displayed in bright yellow; negative in darker yellow; the size of the text represents the magnitude of profit/loss.
From November 2024 edition, not only daily totals but analysis over various periods became possible, with richer trade results information.
In the history window, besides total pips, display of volume average and average pips per trade were added, enabling assessment in monetary terms as well as rate-based.
Current P/L status is graphed using MT4 standard features.
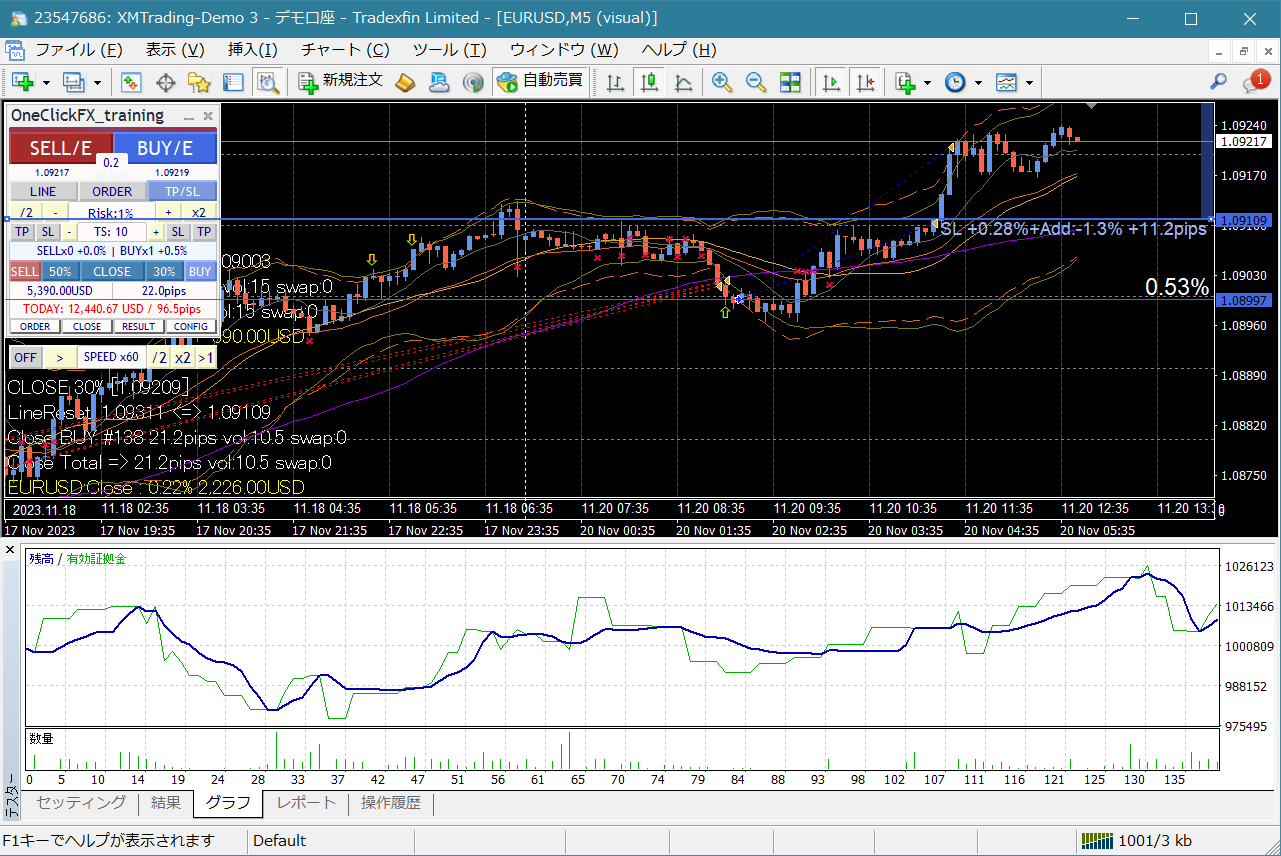
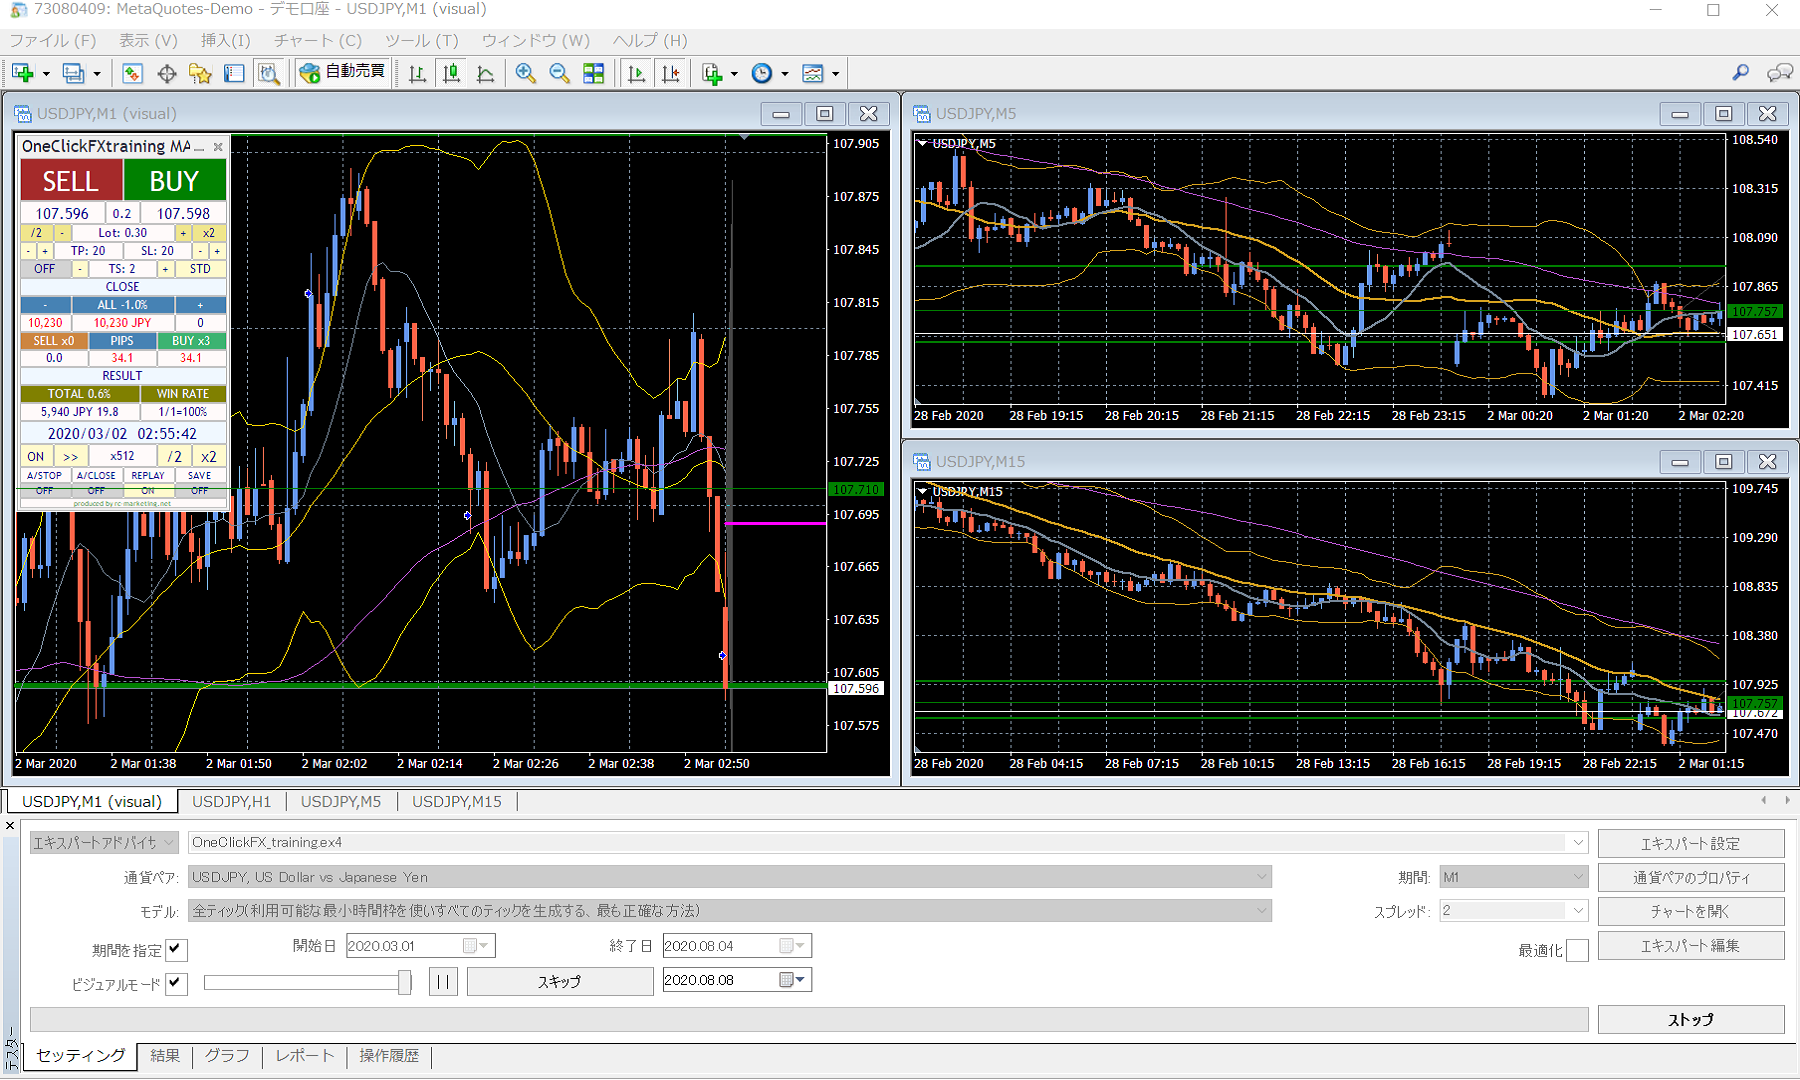
Chart Synchronization
There is also a feature to synchronize charts of different timeframes and currencies. Active synchronized charts can move like regular charts.
In the image, the left is a main chart on 1 hour, the right is a synchronized chart on 30 minutes.
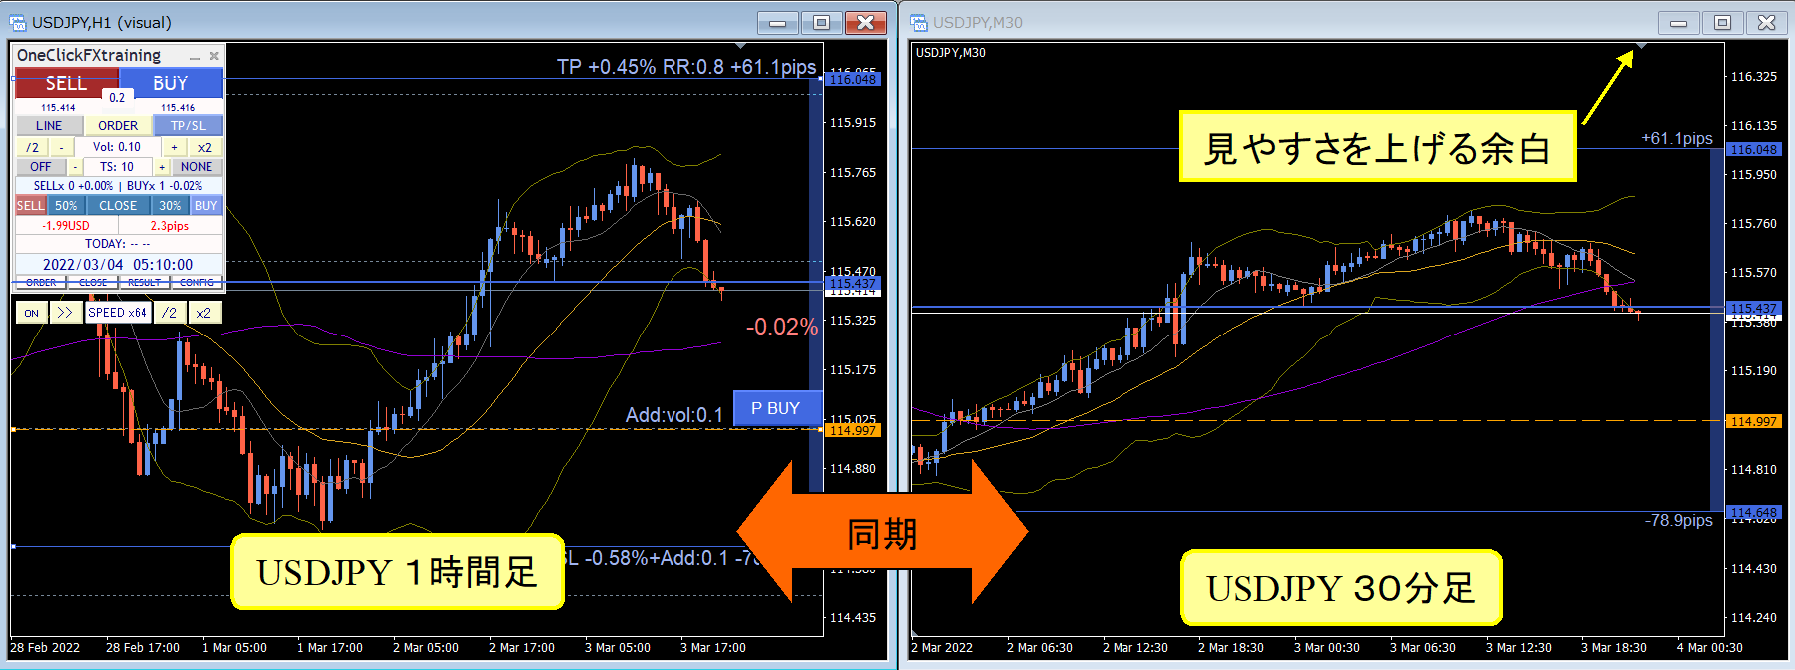
During synchronization, the charts detect the main chart’s zoom, and the sub-chart synchronizes to the same magnification. In simple synchronization, you can freely change the time frame or currency pair like regular online charts. The main chart and sub-chart can have different indicators and can be swapped freely. The main and sub charts may serve different roles, so you can assign completely different indicators to each.
This image shows USDJPY on 1-minute, 5-minute, 1-hour, and daily on the top; the bottom shows EURUSD 1-hour, EURJPY 1-hour, GBPJPY 1-hour, GOLD 1-hour.
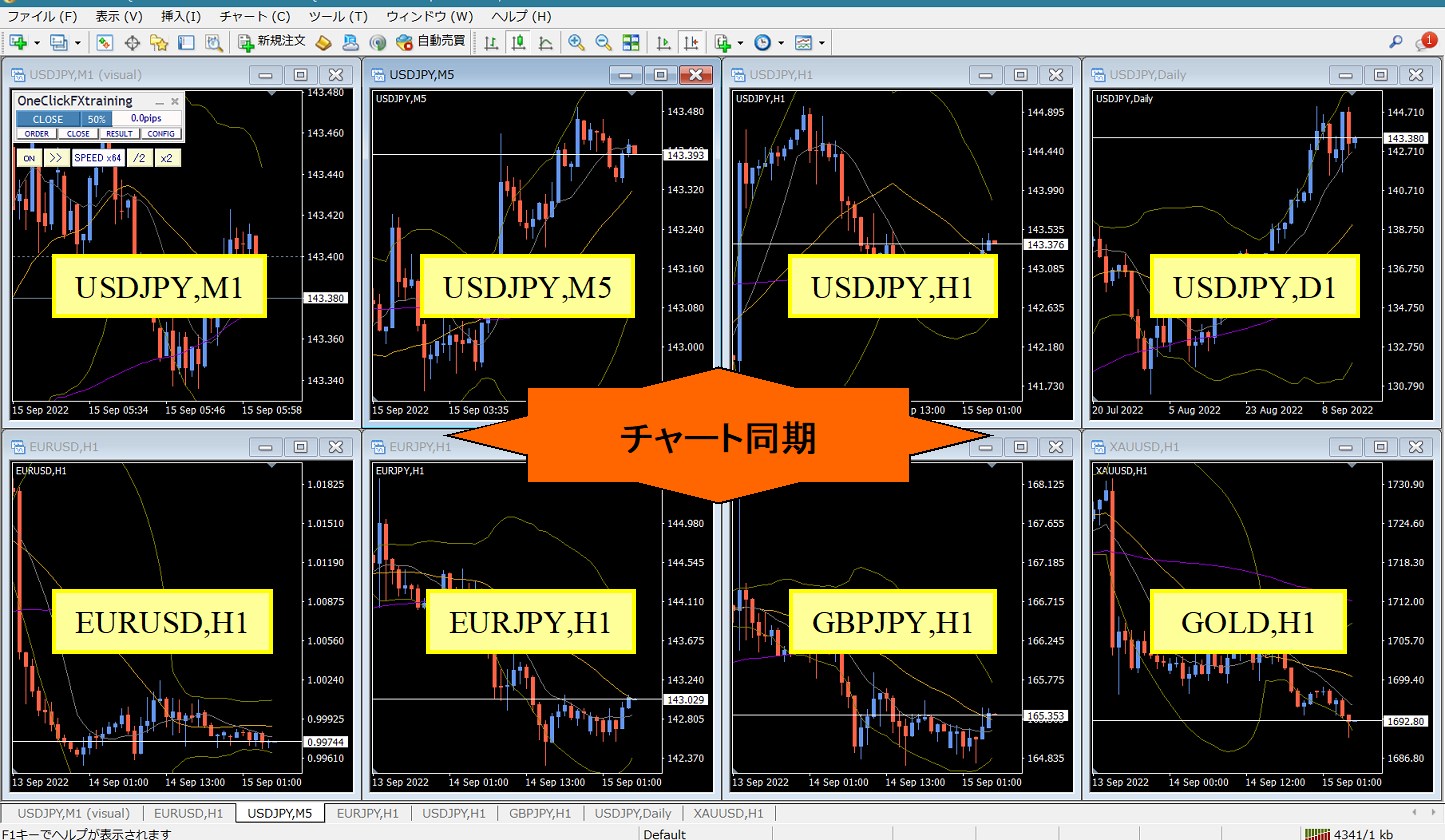
Not only the same currency pair, but other currency pairs can be synchronized as well (same-currency-pair synchronization happens every 1 second; other pairs sync on a 1-minute basis).
You may have seen professional traders’ environments with many charts on multiple monitors; you can achieve similar functionality without heavy equipment, becausechart synchronization that can sync multiple currency pairs without limits is essential.
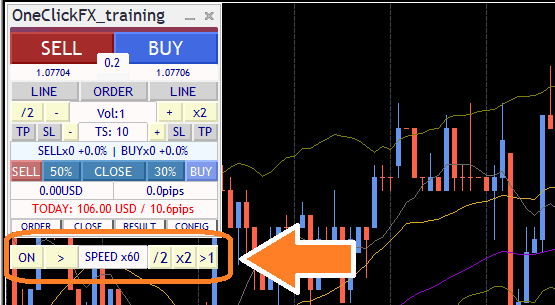
Speed Control and Time Leap
The speed control at the bottom of the control box increases/decreases with the value entered in the parameter "Speed Control Speed List".
The final tick time can be shown/hidden via a parameter.
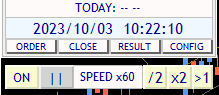
Speed control ranges from 1x (1 second = 1 second) to 5x (1 second = 5 seconds), 60x (1 second = 1 minute), 1440x (1 second = 1 day); you can set any multiplier. Maximum is 604,800x (1 second = 1 week). However, it cannot exceed the Strategy Tester’s maximum speed. If you turn SPEED OFF, the speed becomes the Strategy Tester’s maximum playback speed.
Click the "SPEED" area to advance one tick at a time; the rightmost “>1” button moves to the next candle and stops on the first tick after switching.
In scalping, you can play back in a near-real state to enter and close trades.
Conversely, you can pause, plan an entry point, adjust limit orders or TP/SL, andfaster-forward until filled to automatically stop, enabling faster progression and automation.
Using such features can greatly shorten practice and validation time.
Also, you can pause with different timeframes for the same currency pair or other currencies, allowing analysis in a frozen moment,analyzing with time stopped. Even in stopped time, you can swap indicators, change timeframes, add other currency pairs, and thoroughly analyze the current state.
Is this entry correct? Is this settlement correct? Is the stop loss line appropriate here?Pause time and think carefully
Backtest Viewer
When you pause with speed control, control buttons appear under the speed control. These are the Backtest Viewer control buttons.
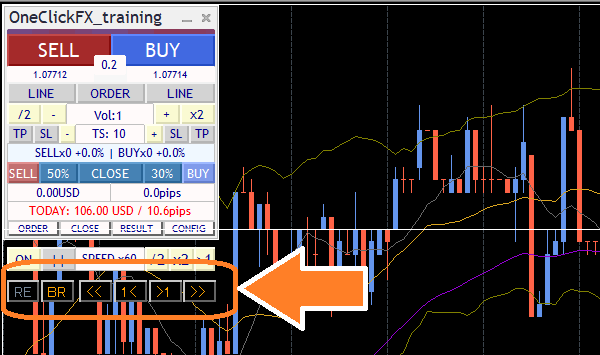
The synchronized chart lines appear faint, and the synchronized chart lines align to the same time. Charts can scroll left/right; when you scroll the main chart with the mouse or keyboard, the synchronized chart lines align likewise.
Press "1<" or ">1]" to move one candle at a time. "<<", ">>" move about 10 bars. The number of moves varies with the chart’s zoom level and environment.
Note: the simulator is paused, so you cannot go beyond the latest time. Also, you cannot modify past orders or settlements. If you want changes, use the next Restart function.
In the paused time, you can review the past, view trade history, and reflect. You can also, if an unexpected result occurred, advance the candles one by one to investigate causes or change indicatorsas needed. The Backtest Viewer is intended to effectively aid in improving trading and learning.
Restart, Time Leap
The replay feature has been upgraded to a restart and time-leap function, reborn in this form.
Pause the chart, then press the leftmost RE button on the Backtest Viewer state to show the panel. There are three save locations to store the current state.
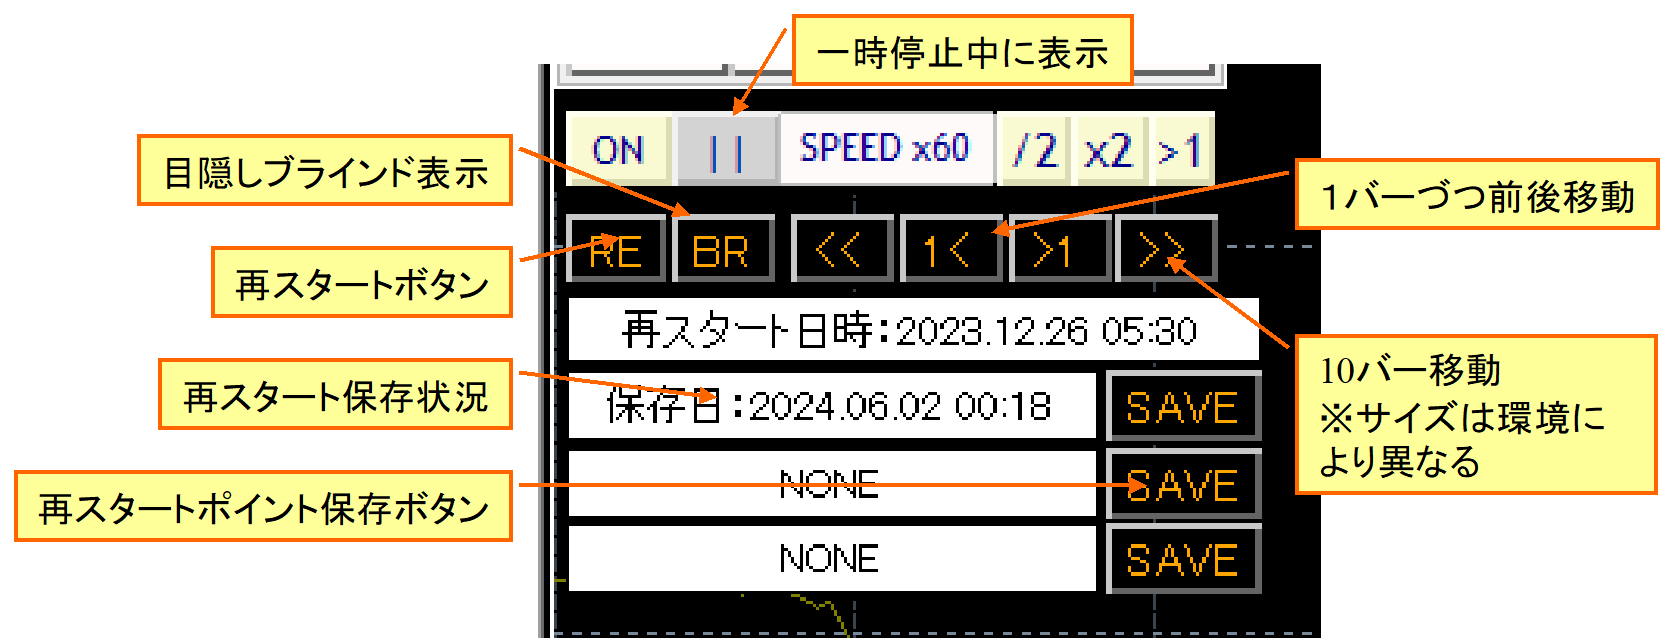
When you stop, a restart point selection screen appears after pressing Start.
When you press the saved GO button, you move to that position with fast-forward. The REPLAY button plays the same order in normal speed. Previously saved data reproduces as last ended.
Not only at the paused point, you can also scroll the chart, go back in time, save that moment as a restart point.
In this video, restart points are saved at the moment just before settlement reached from the paused position. You restart there, redo that portion, finish, then continue from previous data.
Of course, this video does not speed up.
Replay
Athletes review their play after a game to identify issues. Similarly, you can save and review your trading history to find weaknesses. Note that replay does not guarantee 100% exact reproduction.
During replay you can turn replay off; you can turn it on later. You can manually settle trades entered during replay as well. You can participate in the replay simultaneously.
Again, you can replay past trades to analyze what was correct or wrong and why.
Auto-saving of Trading Images
Images are automatically saved at order placement and settlement.
You can save individual chart images or the entire screen, including other synchronized charts displayed on screen.
■Daily image saving
At the end of each day, auto-save of that day’s trade history and summary results occurs.
At the end, a wide image from start to finish is auto-saved.

A case of several days of trading on an hourly chart

※All trade images may not save correctly for very long durations due to file size limitations.
Signal Tool Linkage
Entrée or pause is linked with changes in your signals/tools.
For example, golden cross of moving averages, MACD positives/negatives, SAR reversals, etc., can be linked as signals.
One-Click Auto Arrow Trading【AutoArwTrade】signal tools linked on the same chart enable ultra-simple linked trading.
One-Click Auto Arrow Trading【AutoArwTrade】is a feature that standardizes the arrow names to compatible signals, allowing easy linkage with the One-Click FX series. Supported signal tools are available on the support page for free and will be expanded; requests can be accommodated.
More complex signal linkages are also possible!
For example, after a moving average golden cross, if a SAR reversal occurs, signal linkage triggers! If the current price is below the moving average and your tool prints an up-arrow, etc.—the combinations are endless.
With these features, signal linkage can function like an expert advisor, easing verification. You can also pause and practice discretionary trading using those signals.
Supports both object-based and index-based signals, but linkage to all signal tools is not guaranteed. For example, if an indicator pulls data from other timeframes or other currency pairs, MT4's strategy tester may not run it correctly. Also, tools with restrictions may not link.
If you have a signal tool you’d like to know about linkage, please contact us.
Entry Assist
Entry Assist detects price movement fluctuations and predicts price movement a few seconds ahead. It uses this judgment to automatically pause the order execution at the optimal timing after pressing the entry button.
The Entry Assist judgment status is shown by the color bar at the top of the control panel.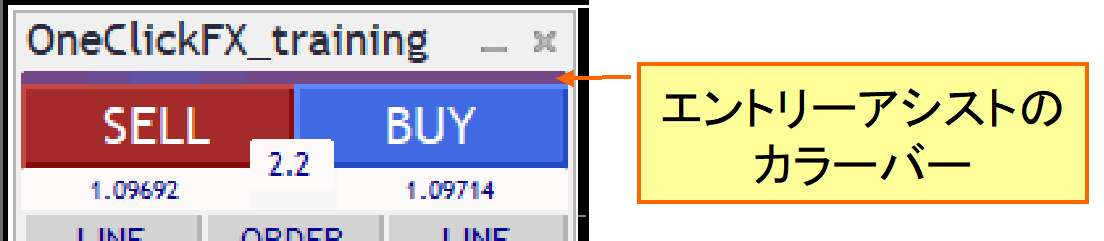
With settings for entry assist strength weak/medium/strong, pressing the entry button makes the button fade and the Entry Assist waits for timing. Press again to force entry, and press the lower cancel button to stop entry.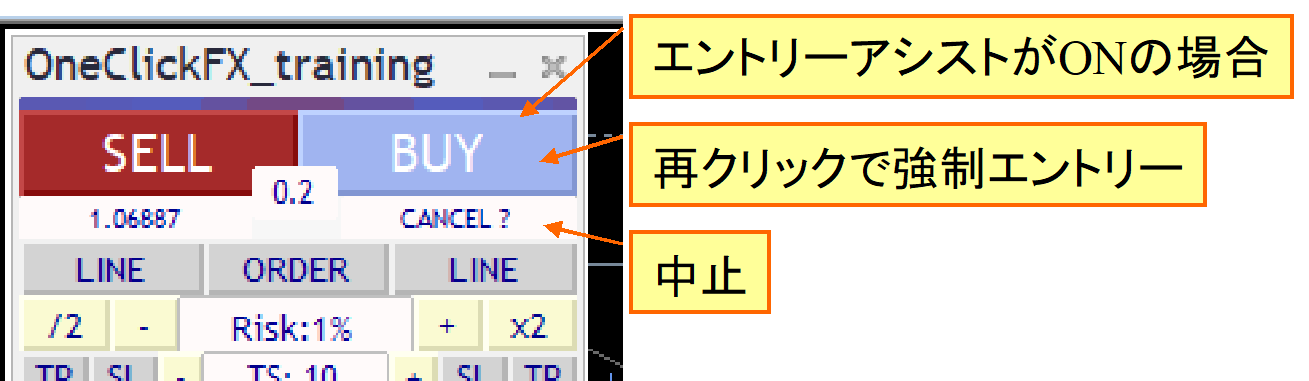
This feature predicts price movement a few seconds ahead; in a strong downtrend, it can help restrain purchases.
If you set strength to "Strong," the tool may refrain from entering until prices rise, so you may sometimes see no entry. Adjust to market conditions. If you’re using testers or fixed-spread brokers, the effect may not be maximal.
AI Judgment
One-Click FX Training MAXnewly includesAI Judgment featureexports trading history and chart data in AI-analyzable formats, enabling not only objective reflection on results but also AI-assisted identification of improvement points. This enables traders to gain new perspectives and further develop skills.
AI Judgment goes beyond retrospective analysis and providesobjective, multi-angle AI analysis. It supports risk assessment, entry timing precision scoring, and strategy consistency scoring, backing professional-level data analysis. This helps quantify trading performance and inform future planning. In risk-managed investing, it supports evidence-based decisions.
NotesAI-based analysis requiresFree AI (perplexity.ai, wrtn.jp, ChatGPT) or ChatGPT Plus ($20/mo). AI Judgment is a tool for analyzing trading results, not investment advice. The provided data and analyses are informational and do not guarantee any past or future performance. Final investment decisions are your responsibility.
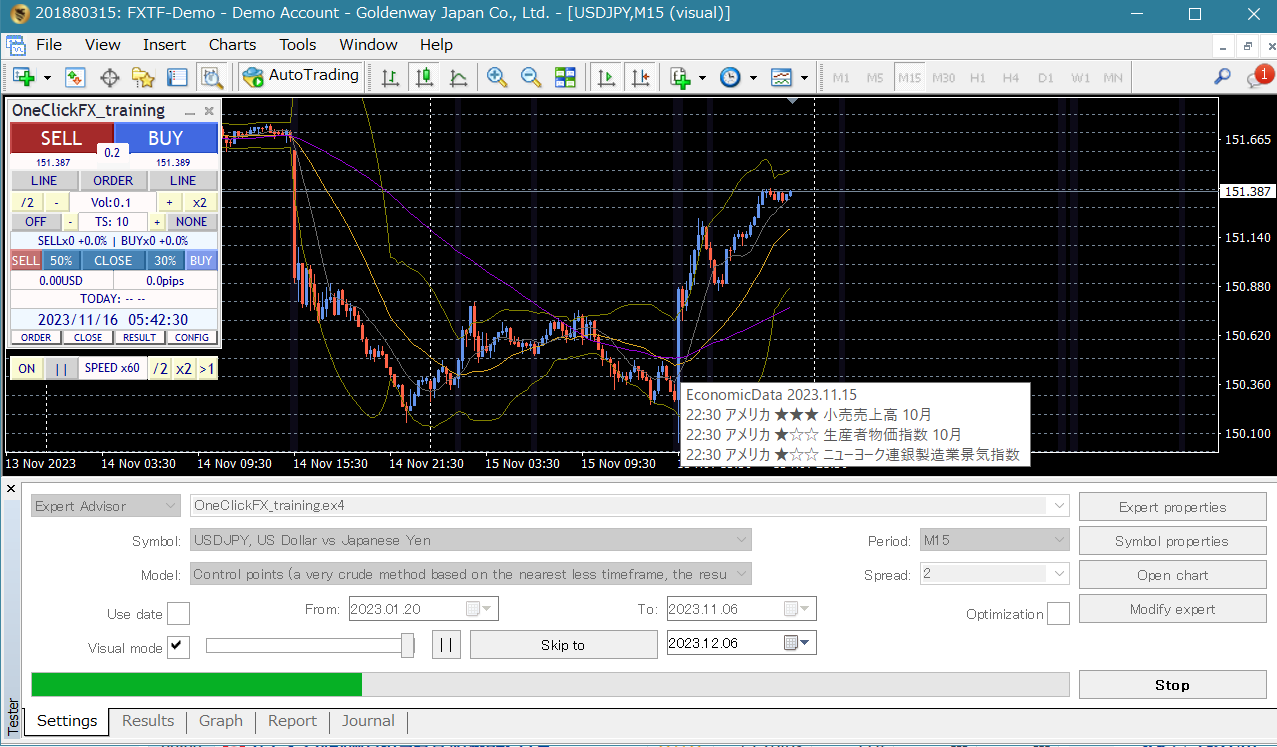
Display of Economic Indicators
The bonus features include “Economics Indicators display unobtrusively【EconomicData_rcm】” and “Local Time,” so economic indicator release timings are shown in Japanese time on the chart.
Displayed on synchronized charts of different timeframes or currencies as well, enabling multi-faceted representation of indicator impact.
In this video, major US indicators’ changes are shown on EURUSD 1-minute, while synchronized charts compare EURUSD 5-minute, USDJPY 5-minute, EURJPY 5-minute.
Pause and step through in Backtest Viewer mode to inspect the situation one candle at a time. If needed, you can save and replay from restart.
Since multiple currencies can be tested, even US indicators may affect EURJPY as well; you can verify this.
Standard equipped reporting function
Finally, this is the Strategy Tester feature.
As standard MT4 functionality, you can set currency pair, tick accuracy, period, spread, and the target period.
The standard feature cannot provide fine adjustments, but you can fast-forward, slow down, skip to a specified time, pause, but cannot rewind. If speed control is ON, set the standard speed to the maximum (far right 32).
There is also a results report.
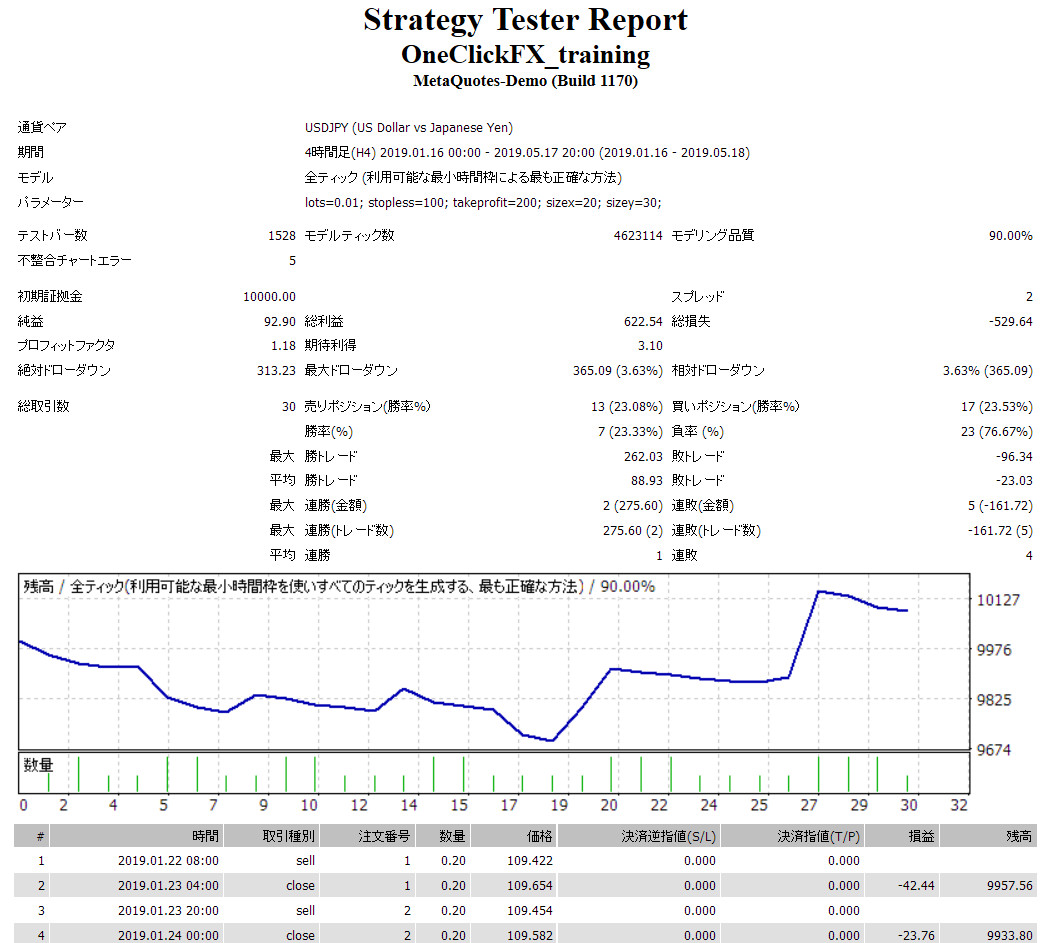 ※ Images are for USD/JPY results.
Starting with loss throughout, a mid-period dramatic improvement led to overall positive results.
Since this is practice trading, it’s okay to smile; in real trading, you’d have left the scene in tears. Practice won’t lose money, so feel free to challenge yourself.
Trading skill often correlates with time spent looking at charts. Demo trading is possible, but you only see charts at 1x speed. By increasing playback speed to 2x, 4x, 16x, 128x, 1024x, you can gain more experience efficiently.
Additionally, replaying your own trades may reveal flaws and areas to work on.
Other Features
■ Forced settlement from keyboard
By pressing two or more keys including SHIFT+CTRL+ALT, you can force all settlements. This is effective for scalping; however, the maximum playback speed may be reduced.
■ Auto-split
Some customers requested splitting large lots to reduce slippage; this was added. Differences may occur by broker, so test. Note that overly small splits can delay orders, and partial settlements may be prevented by splitting.
■ Server Orders
TP/SL line positions are automatically ordered on the server at settlement. If you change lines, a change order is placed. However, if Strategic Close is set, server orders take priority and you cannot use these features.
Server orders include an initial-only item; upon first order, it orders TP/SL lines on the server, and afterward no changes to TP/SL lines are sent to the server. This enables per-position server orders.
■ Maximum number of positions
When the maximum number of positions is reached, additional orders are rejected. If signal linkage can infinitely stack positions, impose a limit. The same applies to incremental stop for Strategic Close; set a limit.
The number of held positions is limited by the broker. With auto-splitting you can place orders until exceeding, but you cannot place additional orders after the cap.
■ Notification features
Notify via LINE or Discord. For practice you may not need it, but for live trading you can catch notifications.
■ Support & Assistance
With a single button, gather information to provide quick support when you encounter trouble.
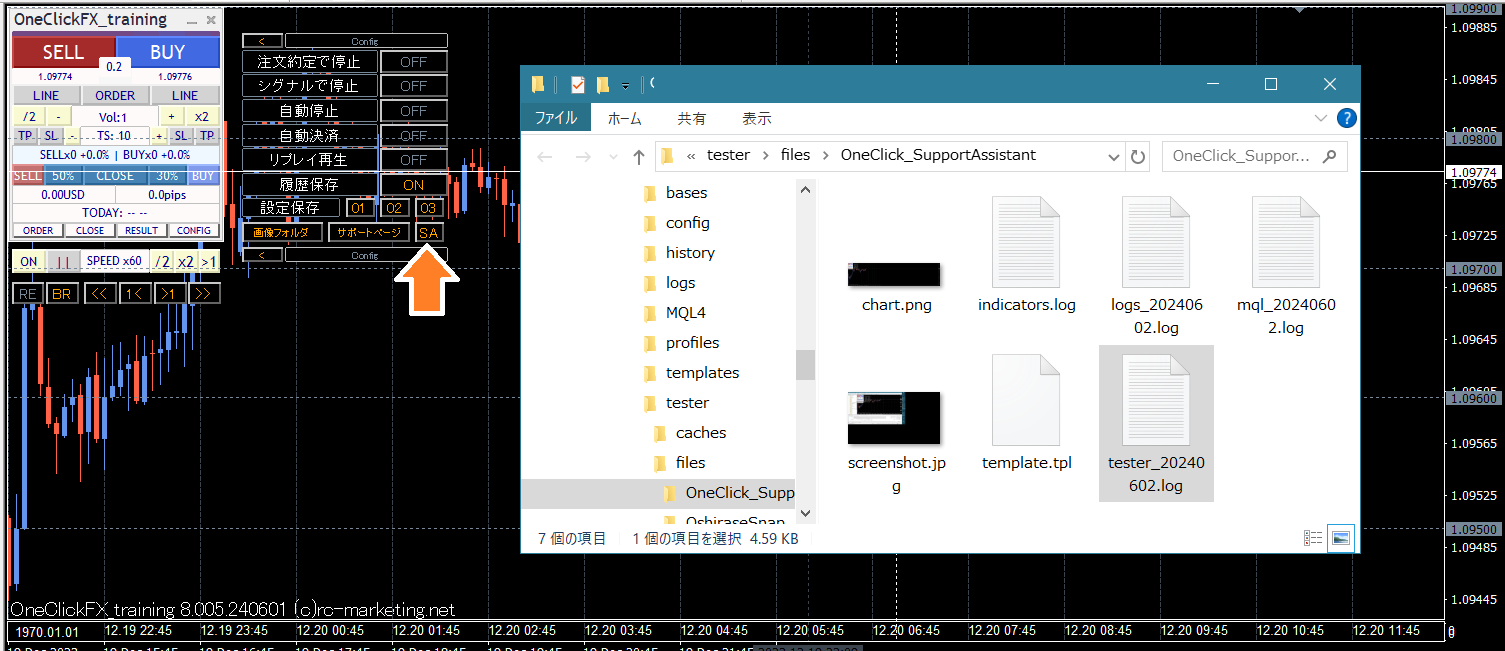
If you have issues, please press the button, which will collect information and open a folder; please email the output files.
※ The same functionality is also offered by scripts.
Included tools, configuration files, etc.
■Volatility at a Glance! Pips-based Grid
The display is in PIPS, so we’ve added an indicator that grids by PIPS. The spacing lines show volatility at a glance
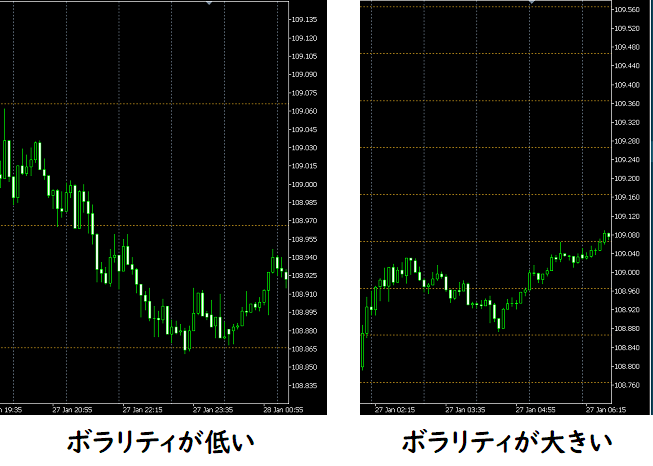
By making horizontal grid lines PIPS-based, volatility is high when width is narrow and low when width is wide. This is included in the main chart’s template.
■Always check economic indicators!
Displays economic indicator release information on the chart.
Data is sourced from “Minkabu”.
Double-click the indicator line on the chart to view details on Minkabu’s economic indicators page.
Economic indicators are shown to the right edge of the chart so you can anticipate upcoming releases.
■Local Time
Japanese time is displayed at the bottom of the chart.
A lightweight tool with minimal impact; it also supports past daylight saving time. Simple functionality but very convenient for comparing economic indicator times in Japanese time.
■Keyboard Operation Tools
A tool that allows play, stop, fast-forward, advance by one tick, advance by one candle, and other operations via keyboard.
■Sample Standardized Chart for Signal Tool Linkage
A sample standardized chart or settings file that responds to signal tools or chart changes to perform linked entries in the training chart.
Apply the settings file and turn linkage ON to enable signal linkage.
▽ Sample signal-linkable tools
1. Bollinger Band breach
2. Moving average cross
3. Parabolic SAR reversal
4. MACD, moving average, Bollinger band composite
The bonus is a general entry point, but you can link with your own signal tools (regardless of source) to trigger entries. If you’re unsure how to set it up, contact us for support.
■Past data application tool
Converts past data downloaded from the support page to MT4 timeframes for use.
Free downloads from Support Blog
■Past data
Past data prepared on the support page, and also data you provide (currency pair name, timeframe) can be prepared. Generally data available on MT4/MT5.
■Object Synchronization Tool
Synchronizes trendlines and Fibonacci lines between the tester’s main chart and sub-charts. Draw a trendline on one chart, and the same line is drawn at the same location on the other chart.
From the Author
Practice and verification tools should reproduce realistic price movements across multiple charts, making you feel as if you’re trading in real time; if that’s achieved, it’s excellent.
However, realism can be inconvenient. Practicing in a typical demo account is inefficient and slow to yield results. The simulator’s appeal lies in providing a near-real environment with the flexibility to do as you wish.
The simplest thing reality lacks is stopping time. In a paused moment, you can display other timeframe or other currency pair charts, go back and forth, and replay synchronized charts to reproduce market changes.
If you make a significant error, time leap allows you to re-challenge at the same moment as many times as needed.
This is not fiction; it’s what a simulator can do, and what practice/verification tools should provide.
Great players require great environments. Gaining this environment could dramatically boost trading skills.
Please try your potential.
■P.S.1
One-Click FX Training MAXis highly feature-rich, which may seem complex to first-time users. However, the default setup provides standard FX functionality you know from general FX, and basic trades such as server orders and full settlements using TP/SL lines are supported without issue.
Starting with simpler tools is an option, but as your skills grow you’ll want to test more possibilities. If tool power limitations hinder your ambitions, that would be a shame.
“Practice for real trading is essential; a tool that’s only for practice isn’t helpful, right?” This is feedback we’ve received.One-Click FX Trainingincludes the live-trade-ready “One-Click FX MAX” in its lineup. Training and testing results can be reproduced in live trading using the same operations.
Beyond FX, using appropriate tools leads to better results; practice/verification tools are indispensable for confirming skills and building strategies. We will continue to adapt to changes in technology and customer requests.
■P.S.2
This P.S. is from the tool’s developer perspective. If you’re curious, read on.
Trading is entering the third generation.
First generation used MT4’s built-in order form to fill out fields; it was tedious and time-consuming.
Second generation introduced one-button TP/SL orders, drag TP/SL lines with the mouse, automatic risk% calculation, and more, making trading easier; implemented only in a few advanced products.
The upcoming third generation should offer even richer trading-assist features. Examples of AI-assisted tools exist, but there’s still room for improvement.
One-Click FX Seriesis continuing AI integration testing, but currently yields more hype than effect. Still, it’s only a matter of time.
One-Click FX Training MAXincludes strategic closes, flexible trailing stops, entry assist, and more, offering not just trader-set limits but an advanced assistive feature set.
We believe third-generation trading has only just begun; in a few years AI-assisted tools may be standard in MT4/MT5. That doesn’t guarantee victory for everyone, but competition will drive new tool development.
There are many such technical topics, but for now it’s up to you to decide. The presence or absence of features marks a gap in capability.One-Click FX Training MAXis proud to offer top-of-the-line performance but believes there’s still room to support traders further.
One-Click FX Seriesaims to improve work efficiency, time-saving, and skill development, and hopes to enrich your trading life.
Let’s advance further together.