
One-Click FX Training MAX Feature Details Page
Version Update InformationNote: This page also includes images from before the update
▼ December 06, 2025 v8.33
Added ST button (overwrite default template chart),
First-time limit orders use TP/SL lines as the reference price
Entry time filter
Trailing stop TP/SL fully separated
Trailing stop: Protect・Break Even
Resume object restore parameters
Trailing stop (AVG, SHRINK) parameter changes
Bar thickness of Break Even line linked to TP/SL lines
Parameterizable for large 4K displays
▼ June 12, 2025 v8.26
Chandelier Exit added,
Display of fees
▼ April 15, 2025 v8.22
Fast skip
Adaptation for LINE仕様変更
▼ January 07, 2025 v8.20
AI judgment
Individual scroll of synced charts
Included keyboard operations
Distribution of object synchronization tool
▼ November 14, 2024 v8.18
Reset + TS added,
Font change for messages
Change saved date to chart date/time
▼ September 09, 2024 v8.16
Error page display, enhanced hiding of synchronized charts, added minimize start, adjusted synchronization bar, BE line swap, deletion of market order at settlement, added start button at launch, downloader fix, one-click SA alert handling, other bug fixes, parameters, color adjustments, etc., bug fixes in included items
▼ June 06, 2024 v8.0x:
Added line thickness parameter,
Added auto split orders,
Fix for margin vs currency pair mismatch message,
Added Support Assist,
Entry timing color bar added,
Spread added to SL calculation,
Time leap feature added,
Resume from last time feature added,
Past verification viewer added,
Strategic close added,
Flexible trailing stop added,
Separated processing for TP TS and SL TS, button separation,
Double-click to clear messages added,
Keyboard settlement added,
Feature packaging for bonuses such as indicators,
▼ November 12, 2023 v7.60
Next-bar forward button added,
▼ October 20, 2023 v7.51
Add color to exit messages on close,
Click history dates to display results
Other bug fixes
▼ September 29, 2023 v7.50One-click automated arrows trading【AutoArwTrade】Supported
Signal linkage adds buy/sell settlements
Show profit/loss and size in history display
Faster signal linkage
Add credits to P/L calculation
Add first-time only in server orders
Set RR minimum to 0.1
Display TP/SL lines on order entry (also for filled orders)
Add initial position of control box
Automatic generation of active synchronized charts
▼ April 12, 2023 v7.2x
Activate synchronized charts
Save button to template chart
Fix choppy position bar
Display and comments corrected
▼ March 11, 2023 v7.11
Add WebRequest to license authentication
ASP restrictions対応
Auto averaging button
Font size scaling
Add speed list
Support multiple signals
Notify Slack
2022 Sep 16 v7.010 bugs, etc.
▼ September 04, 2022 V7
Add limit entry orders
Automatic calculation of risk %
Profit/Loss % on margin (risk %)
Daily P/L display, trade history display
Position information display
Add risk-reward
Change position triangles
Automatic daily aggregation image saving
Right-edge shift for synchronized charts
Auto-save all trade images
Add revised risk % calculation
▽ April 16, 2022 Update
- Added reset flags for TP/SL/TS on full settlement
- Fixed NONE triangle bug, etc.
▽ Oct 15, 2021 Update
- Immediate position display on entry
- Add invalid value to tool control TP/SL
- Reject entry on negative
- LINE, Discard notifications added
- Triangle color changed to intermediate between BUY/SELL
- Add initial value parameters
- Add error and settlement message display area
- Reduced load during speed control
- Some commission-bearing accounts supported
▽ June 02, 2021 Additions
- Strengthened signal tool integration
- Instant change of template charts
- Change TP/SL by dragging with mouse
- Added forced stop loss line
- Individual position settlement
- Partial settlements (50%, 30%, etc.)
- Add white space to right edge of synchronized charts
- 3D-like buttons for usability
- Improved usability with sub-panels
- Add compact mode to control box
- Several sample template charts
▽ August 08, 2020 Additions
- Signal tool linkage
- Auto-saving of trade images
- Change control box to preferred color
- Break-even line
- TP, SL lines
- Change display to PIPS
- Parameter整理
- PIPS-unit PipsGrid bundle
- Position display on synchronized charts
- SL standard trailing
- Auto-averaging on SL
- Line by percentage of funds for capital
▽ May 25 Additions
- P&L line for quick understanding of profit
- Auto on/off auto trailing
▽ May 1 Additions
- On TP/SL at order, set to 0 disable
- To maximize profit, enable trailing on limit orders
- PIPS display for P/L added
- Red color for negative P/L
- Currency name added to P/L ALL/RESULT
▽ March 27 Additions
- Show current spread (including live)
- Display limit/stop orders as triangular indicators
- Add limit/stop controls to control box (ORDER)
- P BUY and P SELL buttons perform limit orders
- Limit/Stop auto-detected, so pressing P BUY or P SELL places pending order
- Orders can be placed by SL-based risk % or lot size without showing TP/SL
- If TP/SL line is not shown, initial values are applied
▪
- Easy practice
- Line trading, limit orders
- Flexible Trailing Stop
- Strategic Close
- Total trades and win rate display
- Chart synchronization
- Speed control and automatic stop
- Past Verifier
- Restart, Time Leap
- Replay
- Auto-save of trading images
- Signal tool linkage
- Entry Assist
- AI Judgment
- Economic indicators display
- Standard built-in report function
- Other features
- Included tools, config files, etc.
- Free download from Support Blog
- From the author
Easy practice
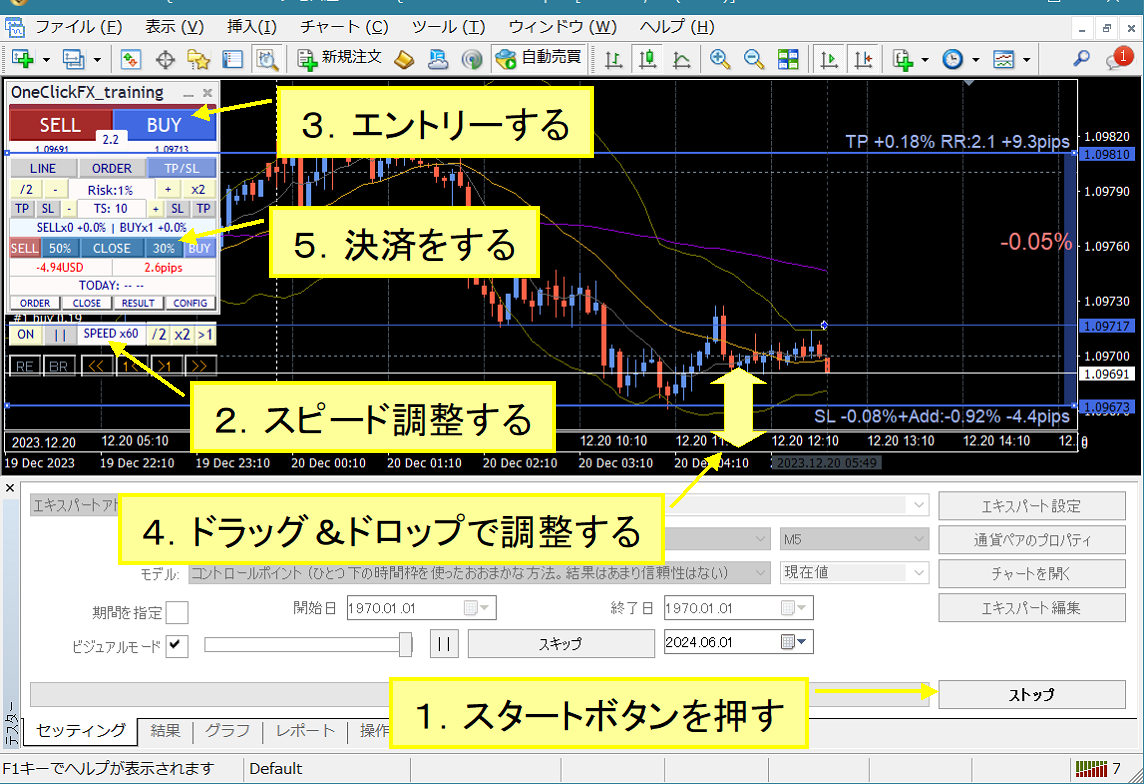
One-Click FX Traininguses MT4 tester charts to practice buying and selling. Trading is simple: enter with one click and exit with one click.
After downloading the product, copy the data into the data folder and press Start in Strategy Tester! If you have used MT4 before,you can start practicing in about 3 minutes.
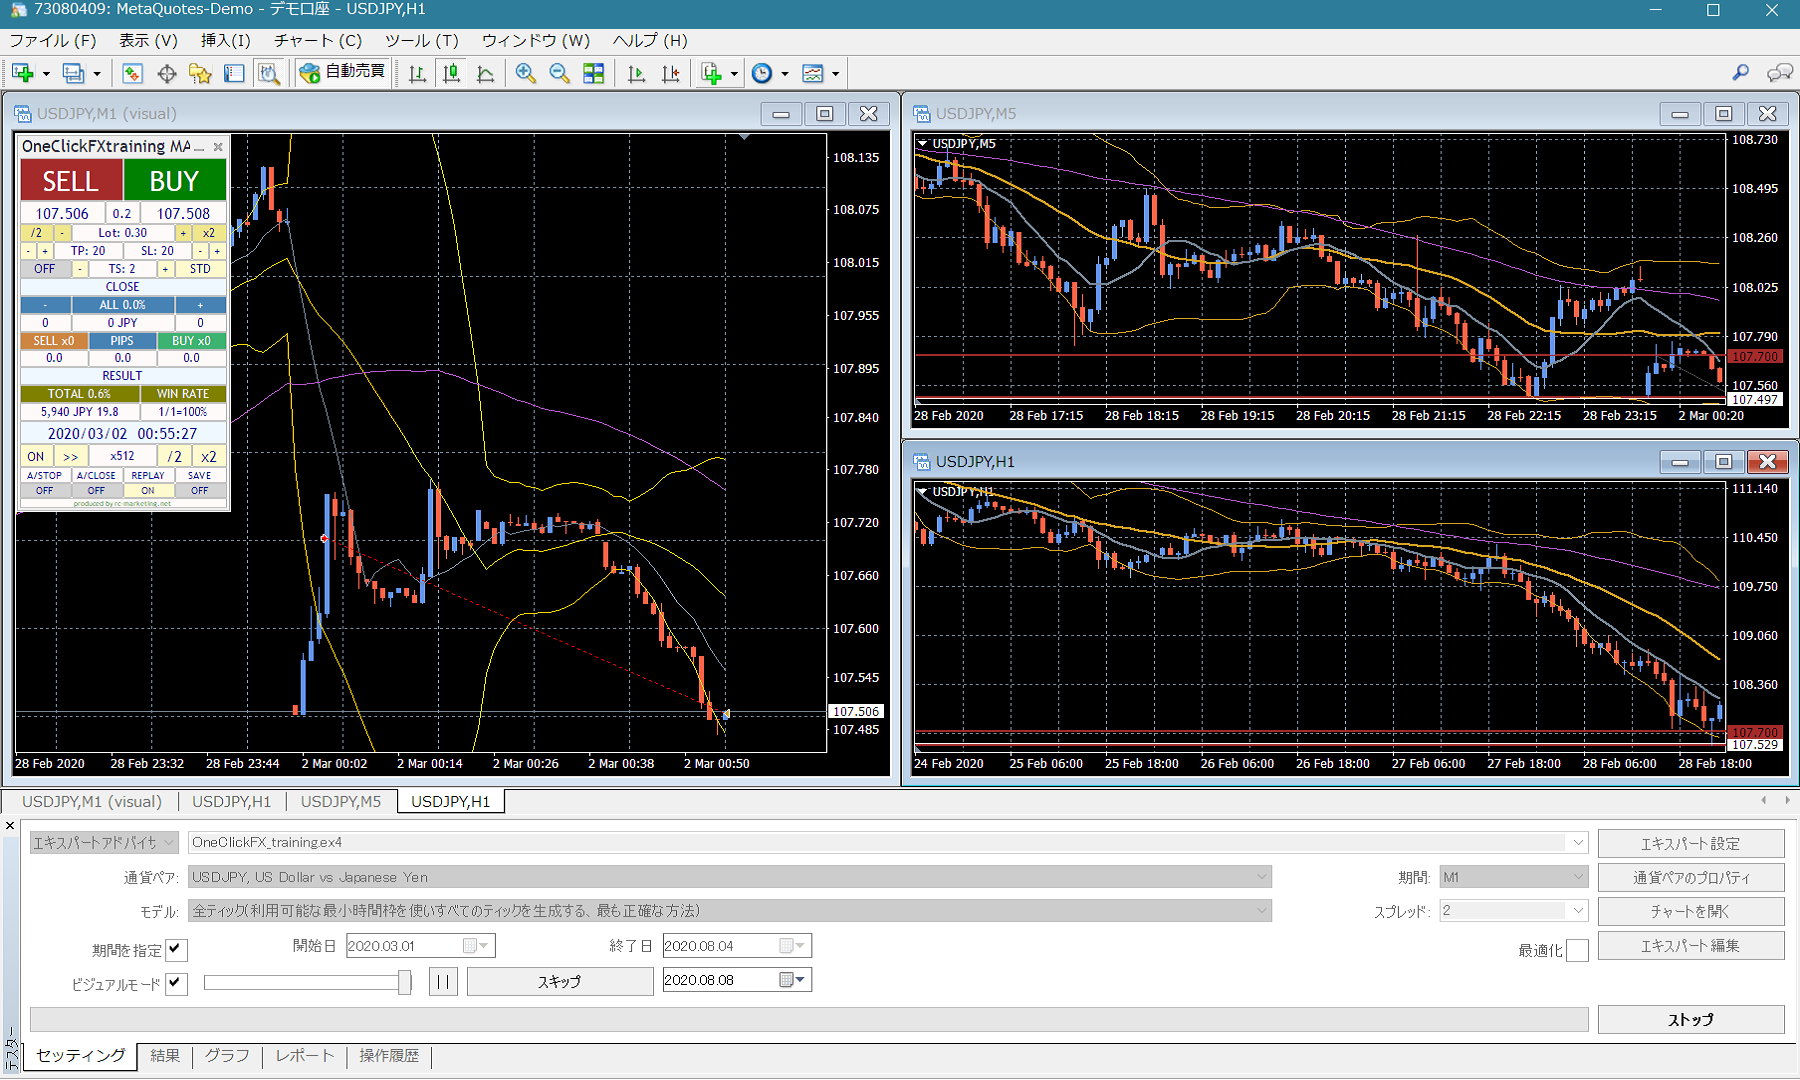
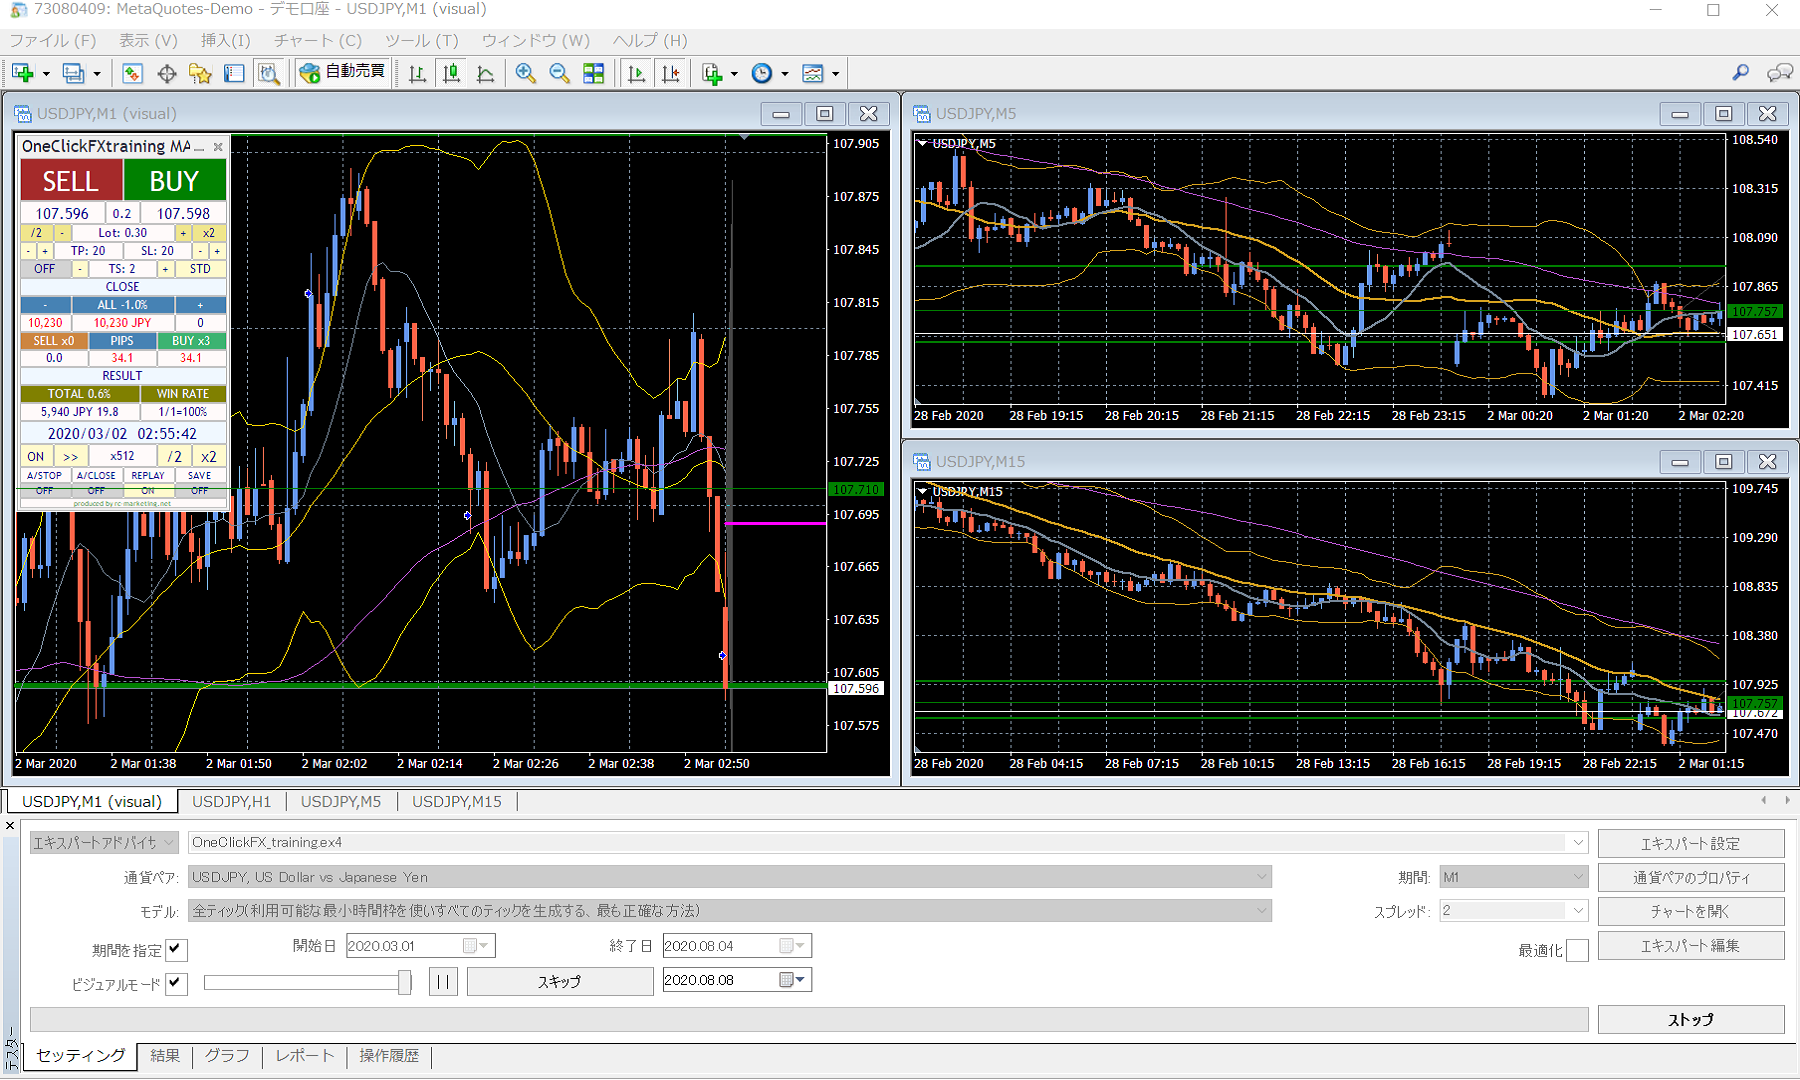
Here is the overall screen layout.
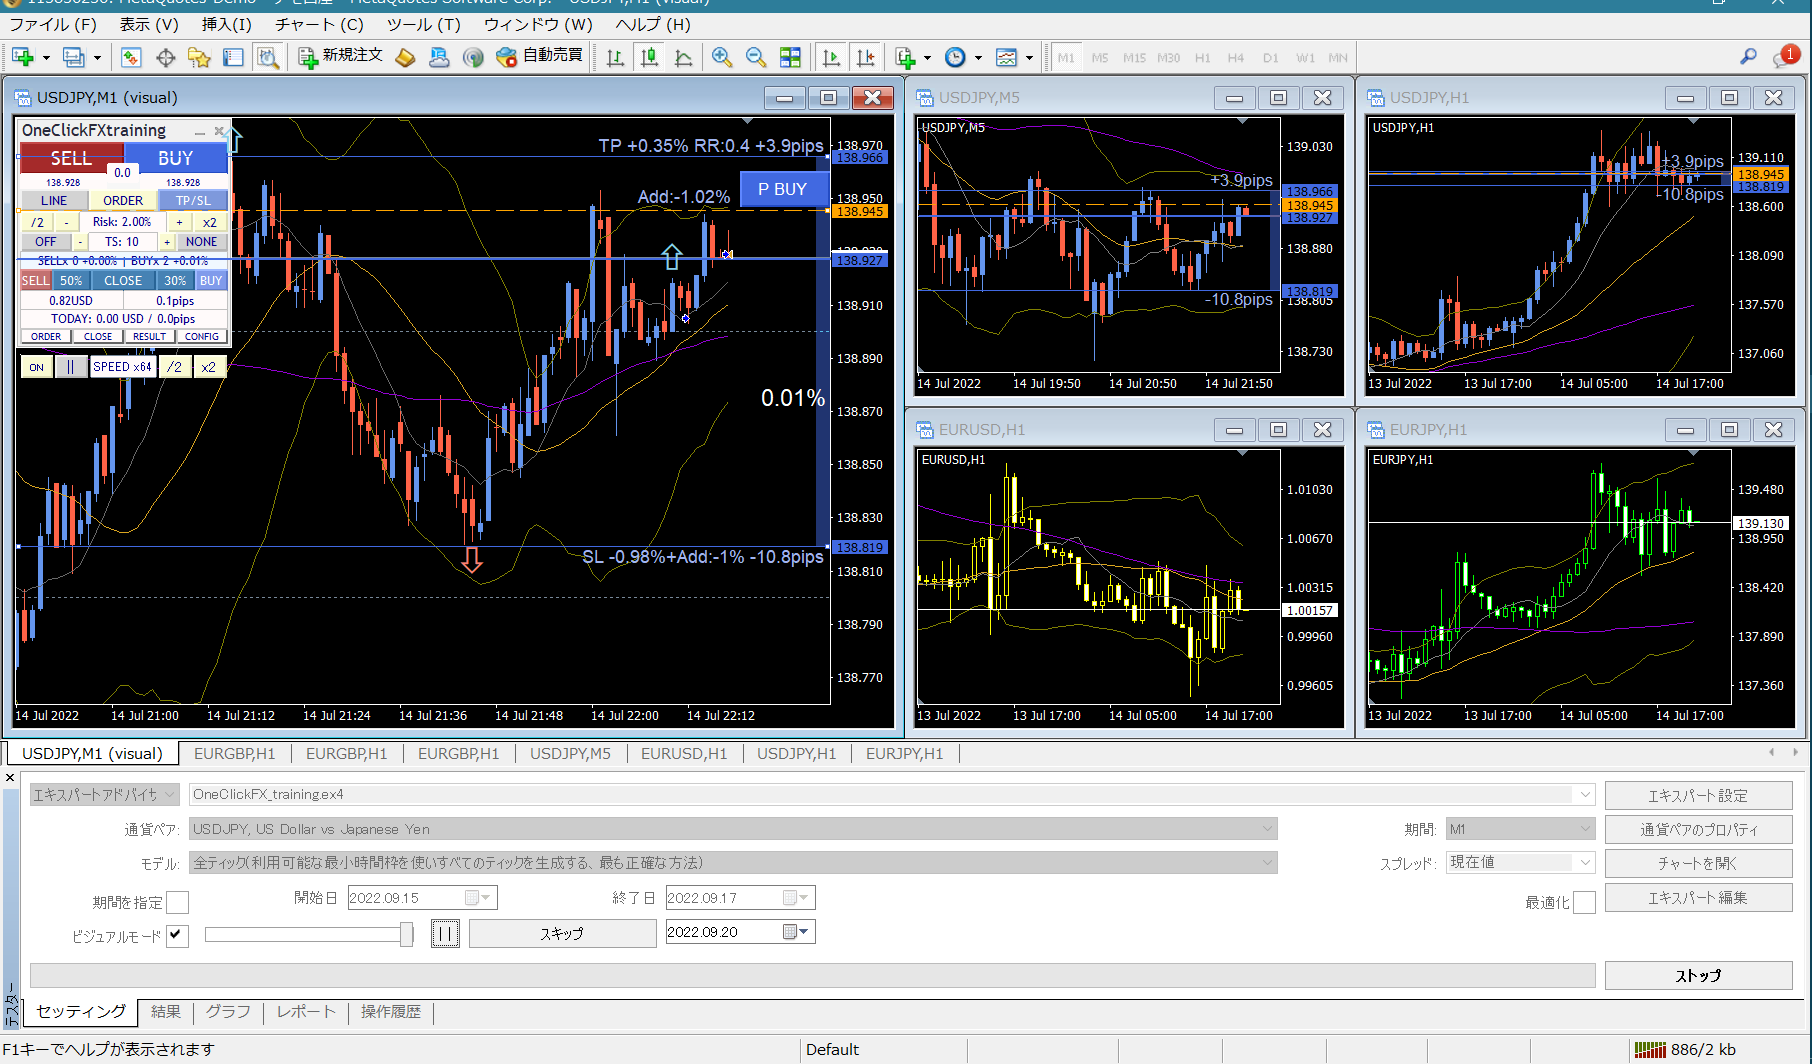 In the upper left corner, there is the control box forOne-Click FX Training.
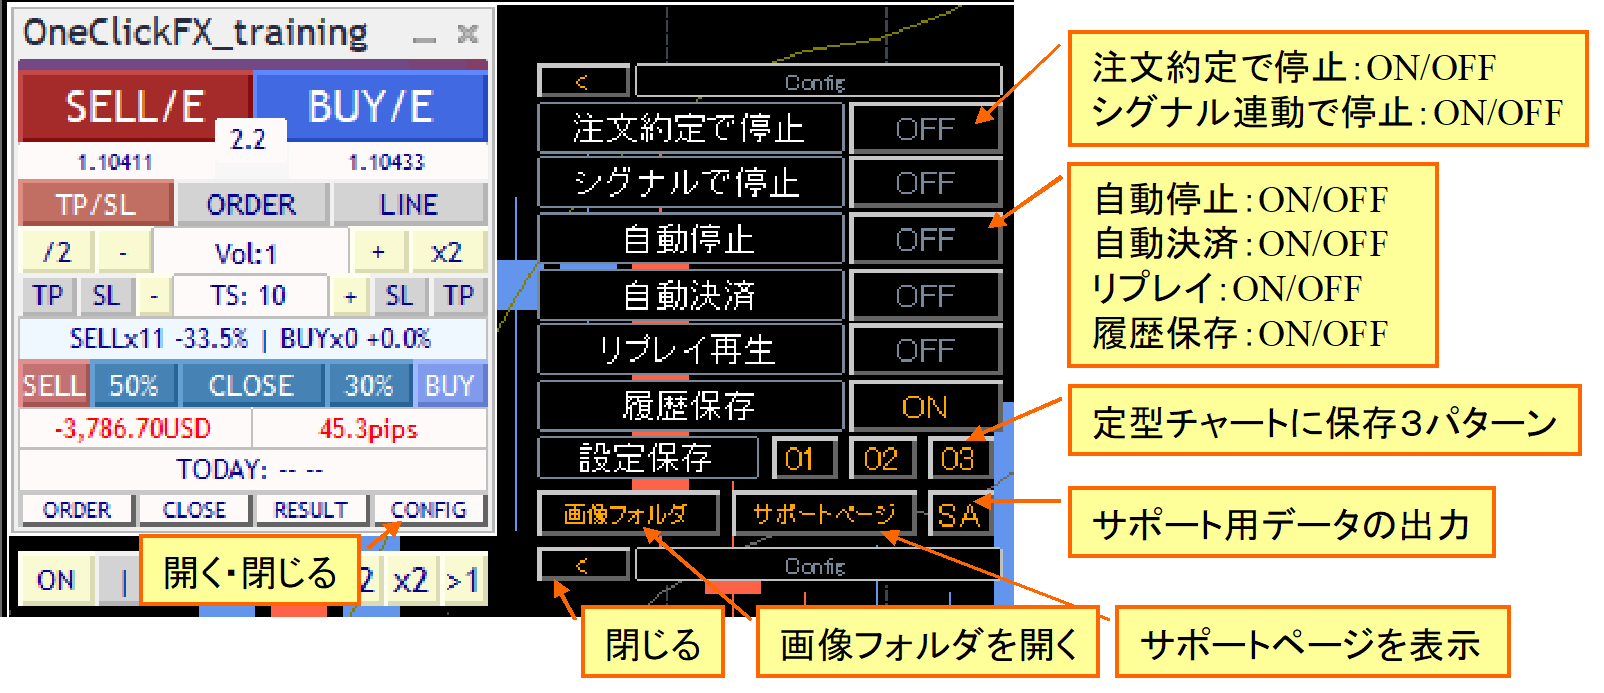
Enlarged image and explanations of each part.
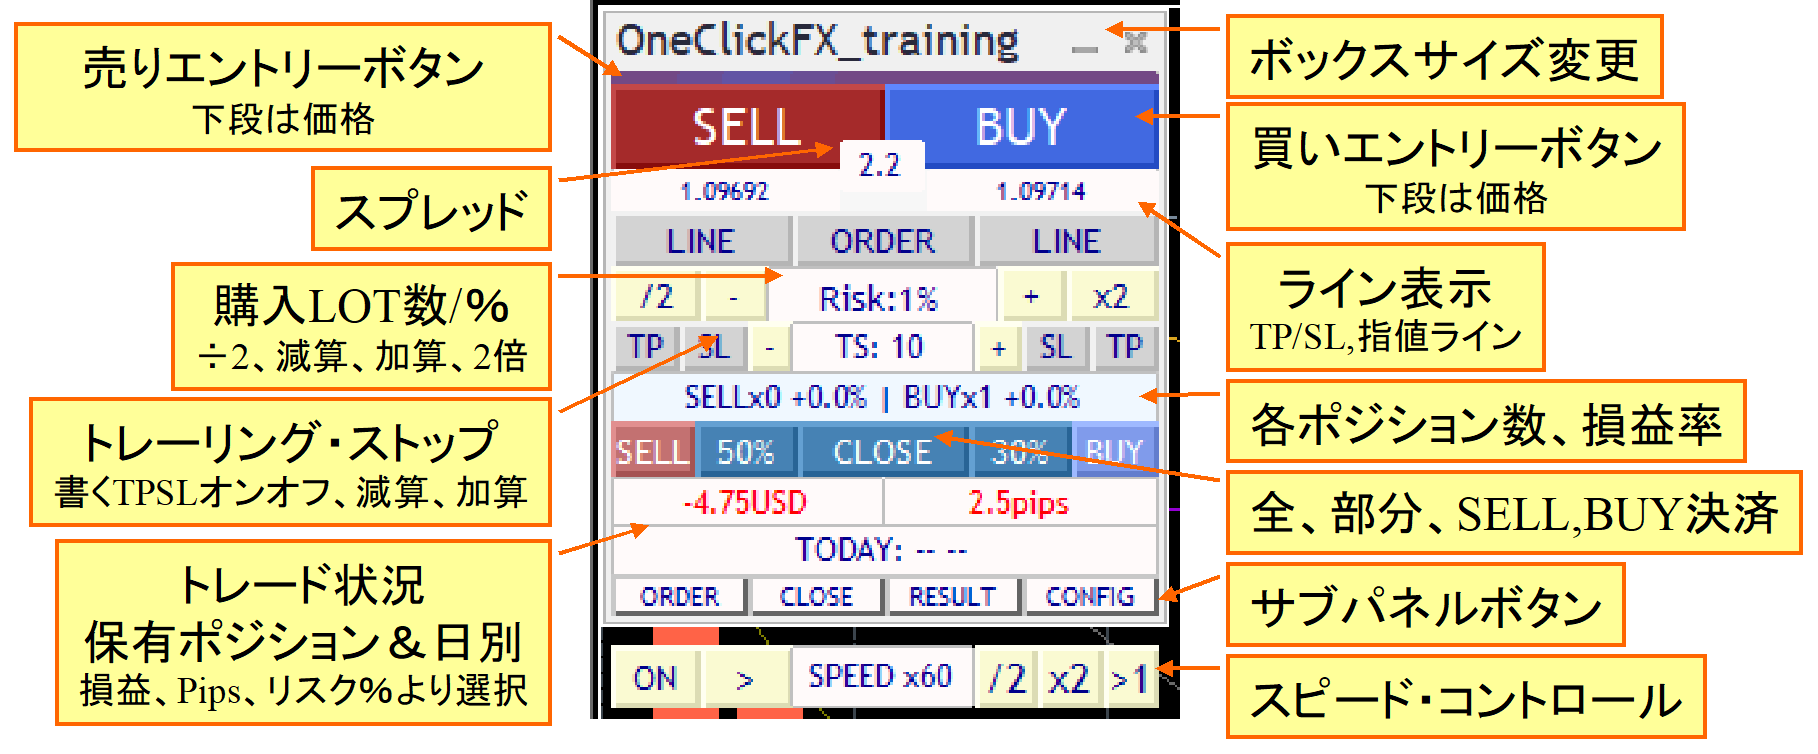
To enter, you use SELL/BUY above, but unlike MT4 standard, you can set limit (T/P) and stop (S/L) orders; pressing the buttons automatically adds them.
Normally you cannot change order details in Strategy Tester, but with this product you can freely modify tool-controlled limit price, stop price, and trailing stops.
The number of lots you purchase can be adjusted with plus/minus buttons that increment or halve, like martingale. Risk % can automatically compute lot size from loss potential.
PIPS display added, so you can view only PIPS changes regardless of lot size for objective P/L insight.
Partial settlements of 50% or 30% in addition to full settlement exist. This can be configured via parameters. Note: partial settlement settles a portion of the allowable order units.
Simple focus mode that does not hide the chart, with a simple control box.
▼ If you just want to practice easily, this is enough
One-Click FX Training MAXis vastly more feature-rich than other verification tools, so continuing reading this page may feel challenging. However,if started with default settings, MT4’s standard order methods become simple operations for generic trading.
Start with the Start button, enter with buy/sell, operate TP/SL lines, and close with the settlement button. This basic operation is not special.FX beginners, or those new to trading tools, can quickly feel the ease of use and improve trading skills.
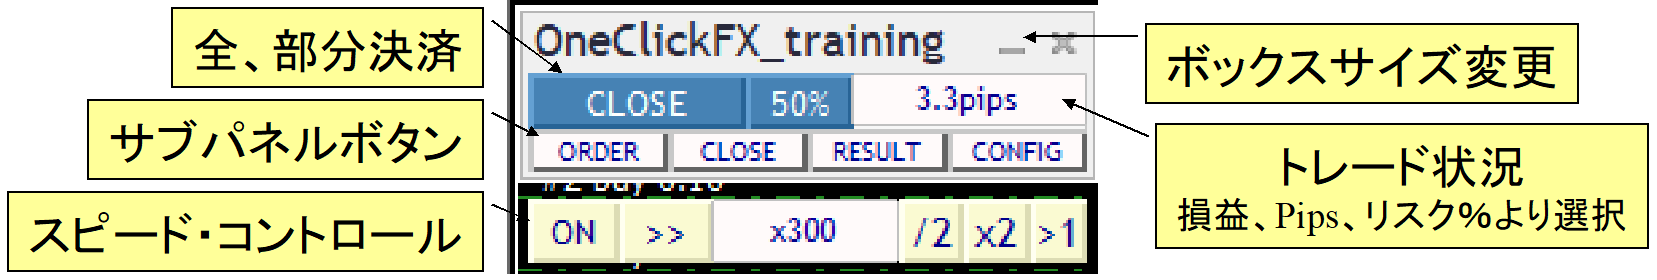
Sub-panels with fine-grained settings!
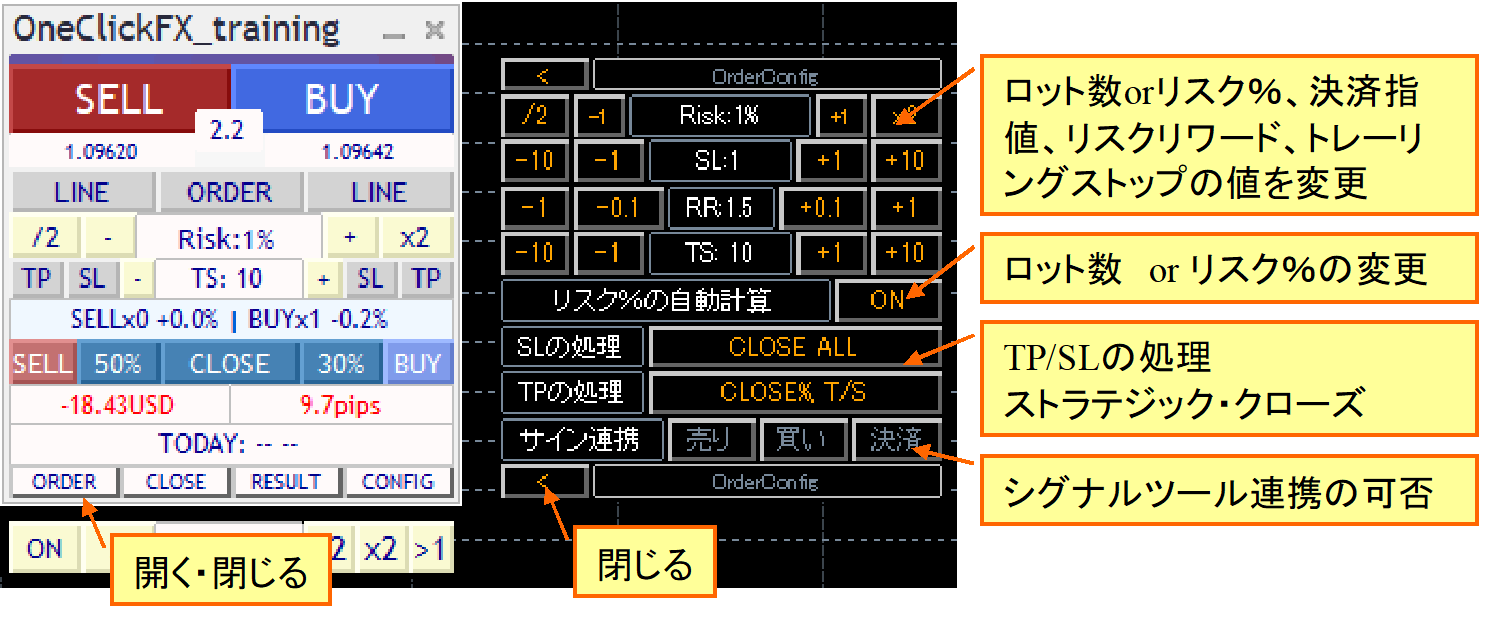
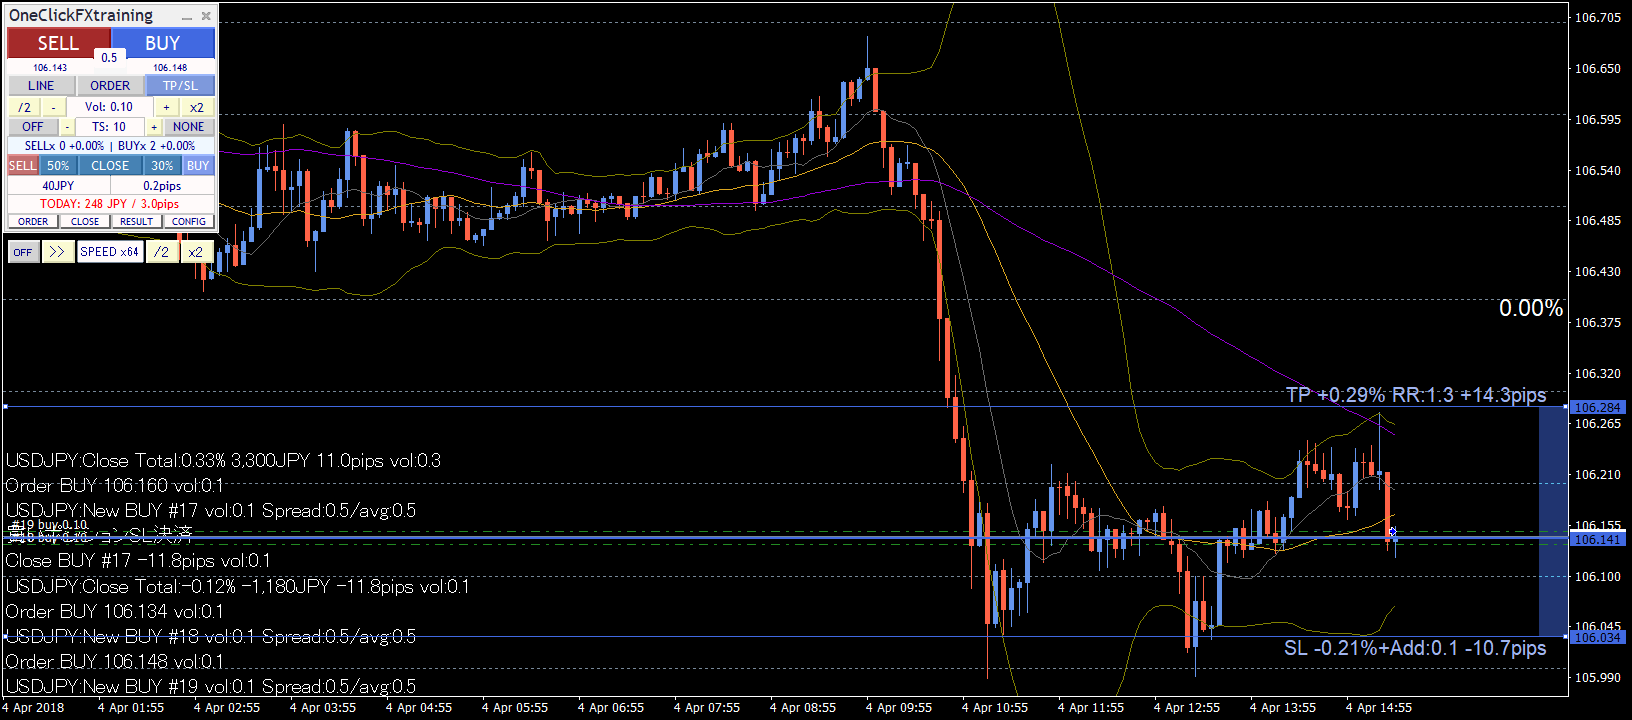
From order statusOne-click settlement for individual positions. Individual positions’ PIPS are displayed on the chart. Limit orders can also be canceled.
Daily aggregation displayed in settlement history after settlement. Daily profits/losses and past five days total/average are shown. The chart shows trade history and each PIPS amount.
Auto-settlement and replay features are simply displayed in a sub-panel
Line Trading, Limit Orders
■Auto-calculation of order lot size
Shift from traditional lot-based orders to risk% calculation that caps loss to a percentage of margin based on the SL line.
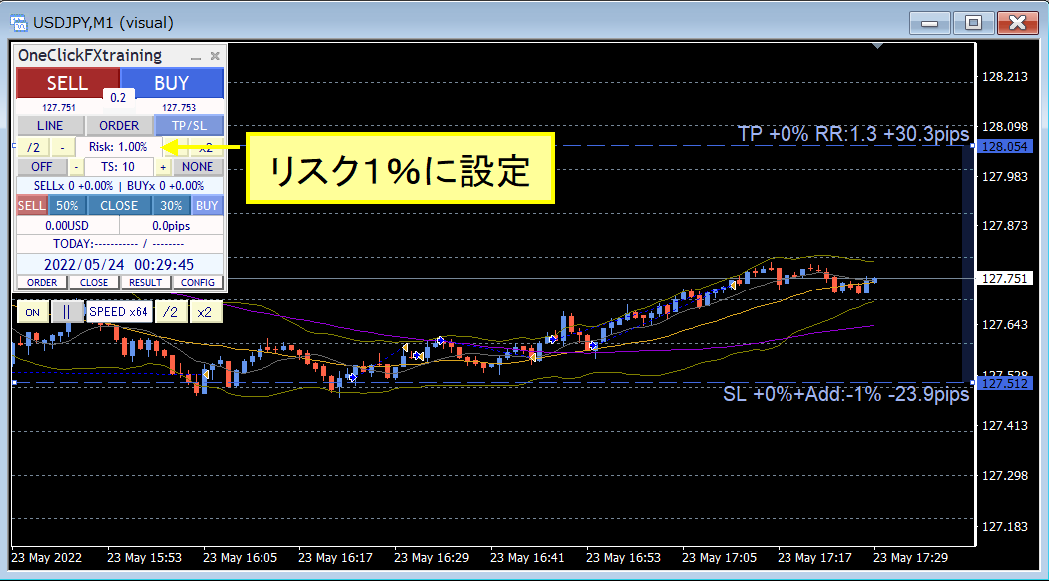
Always automatically calculated, so when the position moves positive you can raise the SL line and add more lots without increasing risk %.
Conversely, set initial risk to 0.5% and when price goes negative, raise risk to 1% and adjust the SL line before averaging down, enabling flexible risk control.
■Limit orders
You can place limit orders when price reaches a specified level.
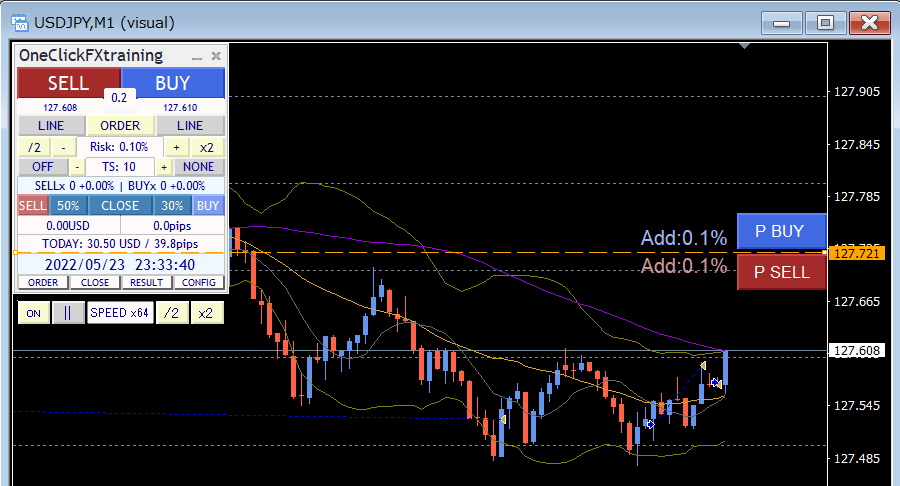
Press the ORDER button in the control box to display the limit line. There are P BUY and P SELL buttons to place BUY/SELL limit orders. Limit/Stop are auto-detected, so pressing P BUY or P SELL places a limit order (unfilled).
You can place orders based on risk% from the SL line, or by lot size. If TP/SL line is not shown, the initial values apply.
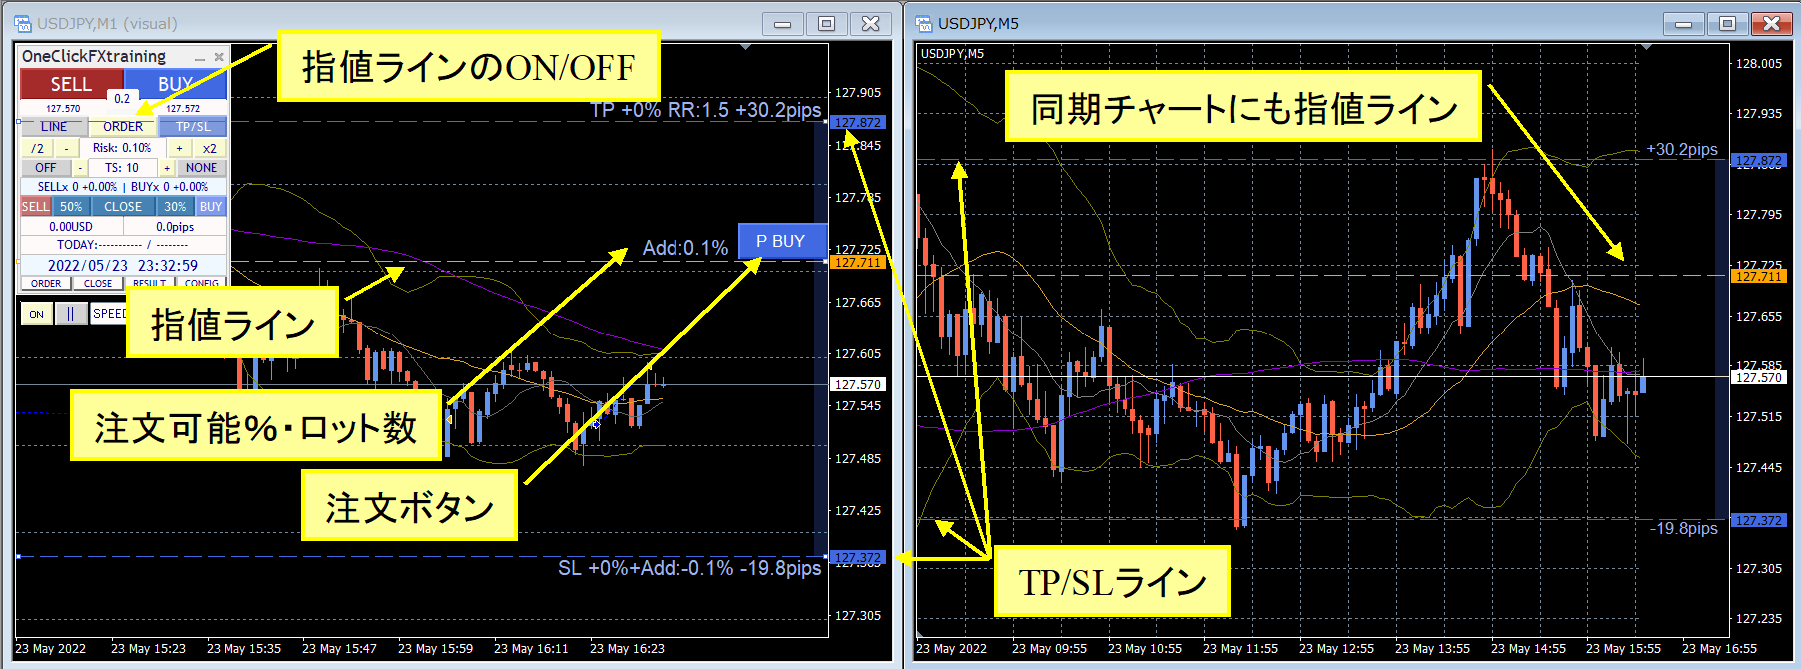
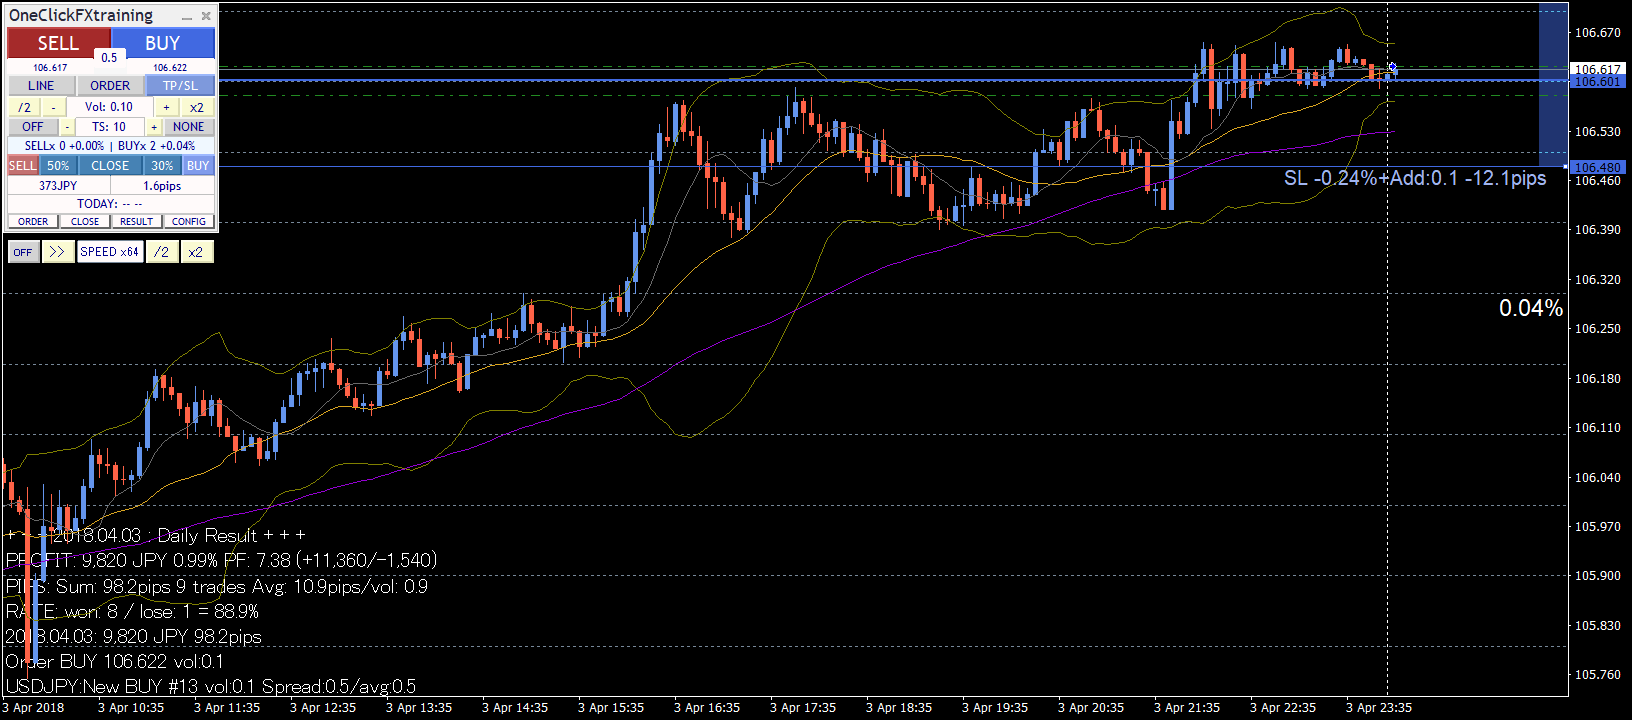
■TP/SL lines are easy to see and can move flexibly.
To clarify ownership of positions, Break Even, TP, SL, and trailing stop will display lines with a base on the break-even line, showing the margin variation rate (risk %) and risk-reward/additional % or lot size, and the PIPS amount.
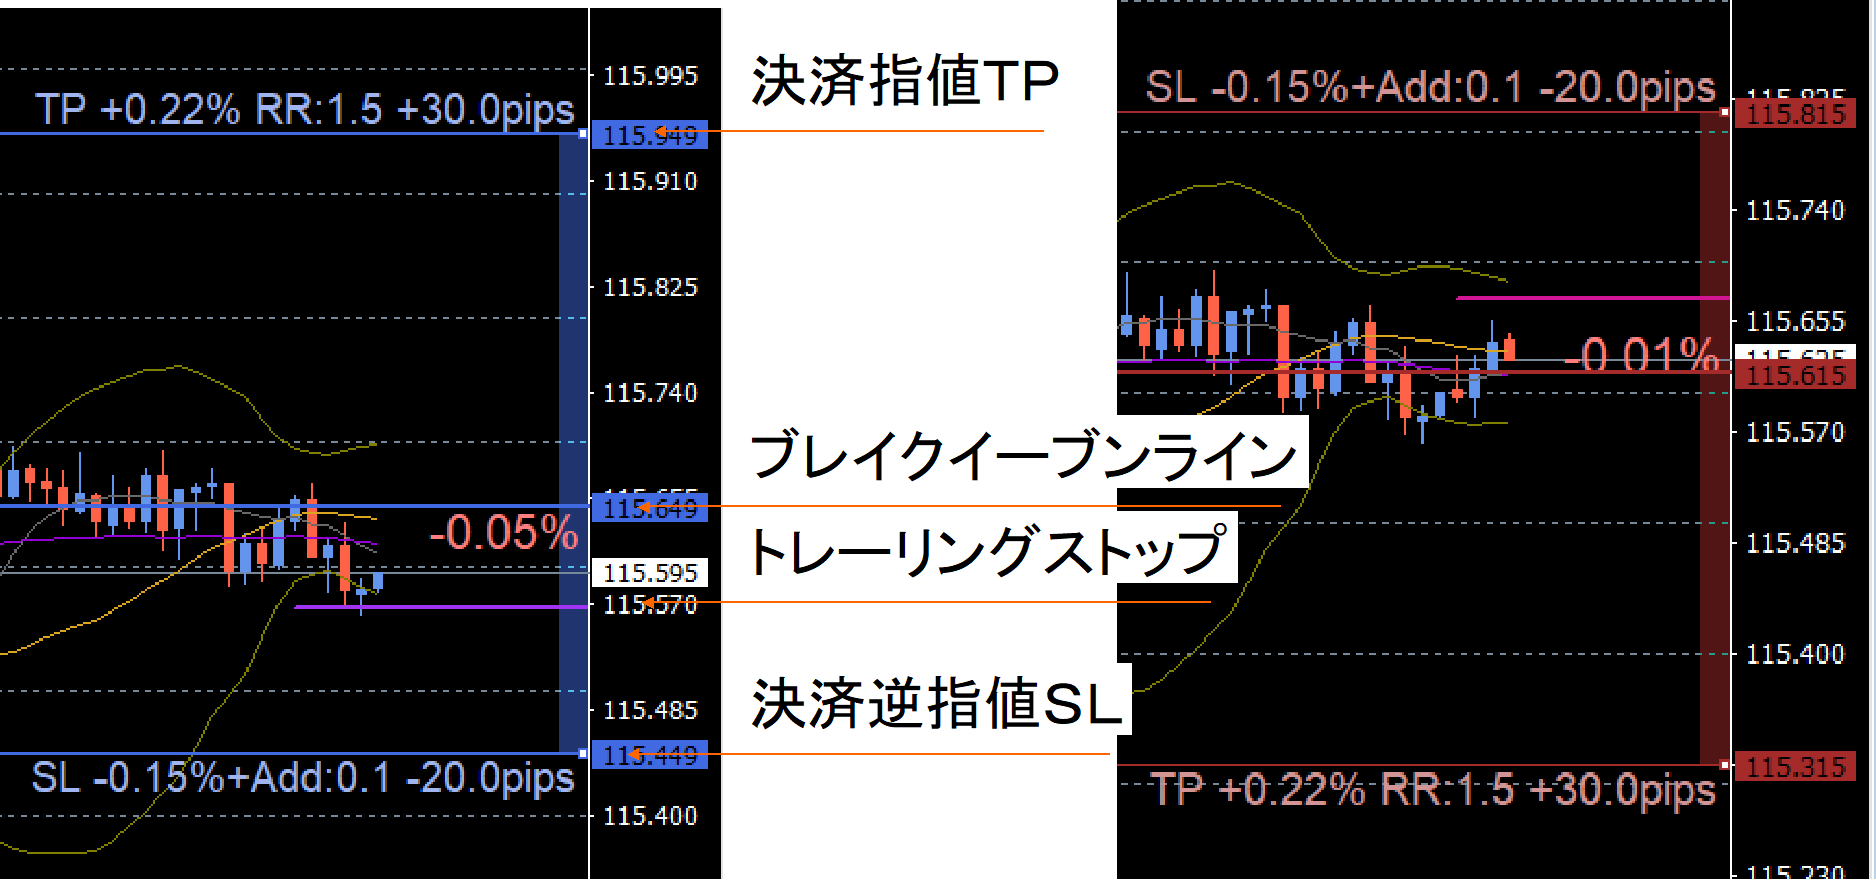
TP/SL settings can be displayed as needed, or hidden if not required. Not only control via software, but you can also place orders with the server and set TP/SL there.
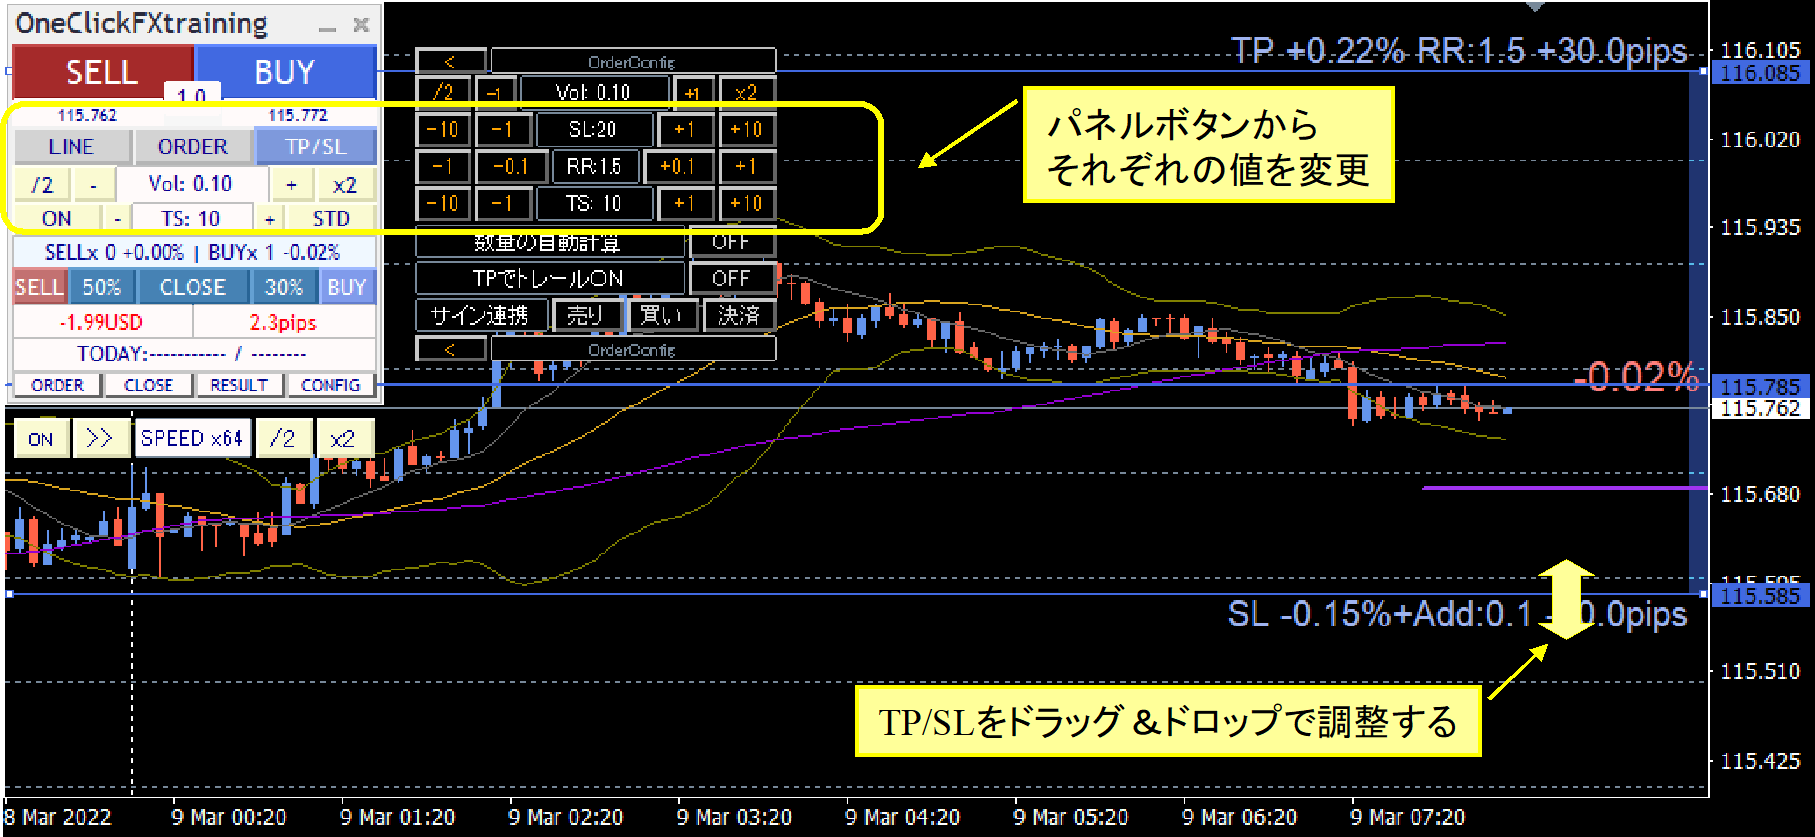
TP, SL, trailing stops can be adjusted while running. The tool-controlled TP/SL lines can be changed bydrag & drop.
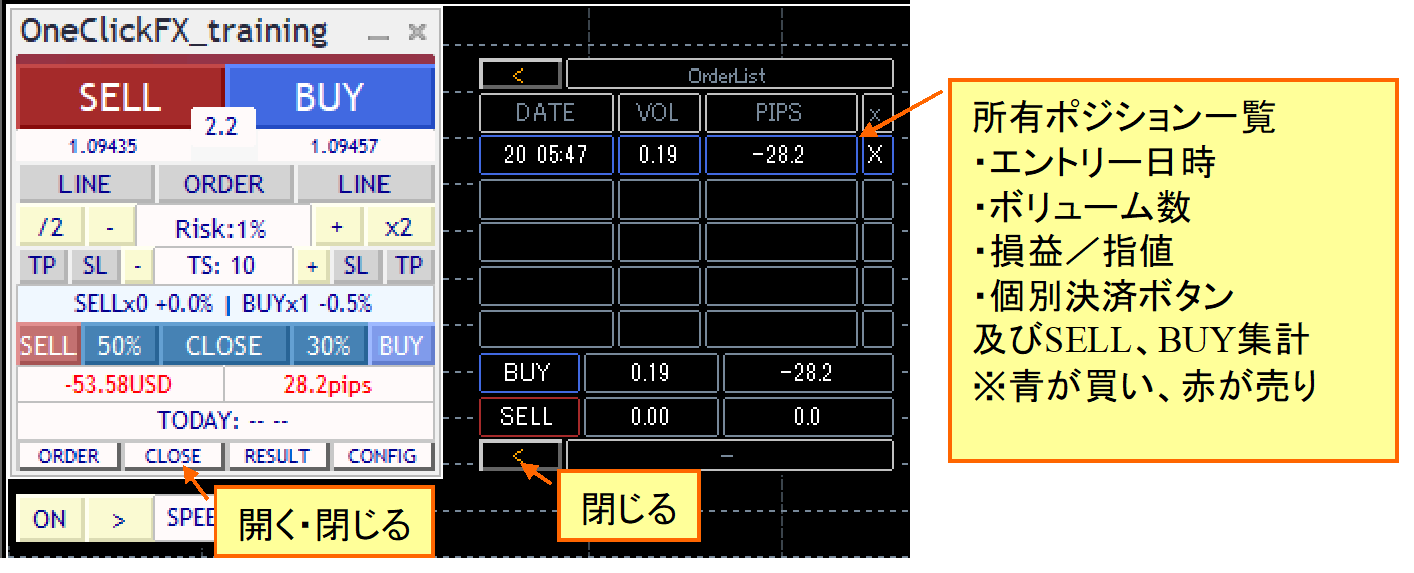
■Status of each position
From the CLOSE button, opening the OrderList sub-panel shows detailed lists of individual positions and current status on the chart.
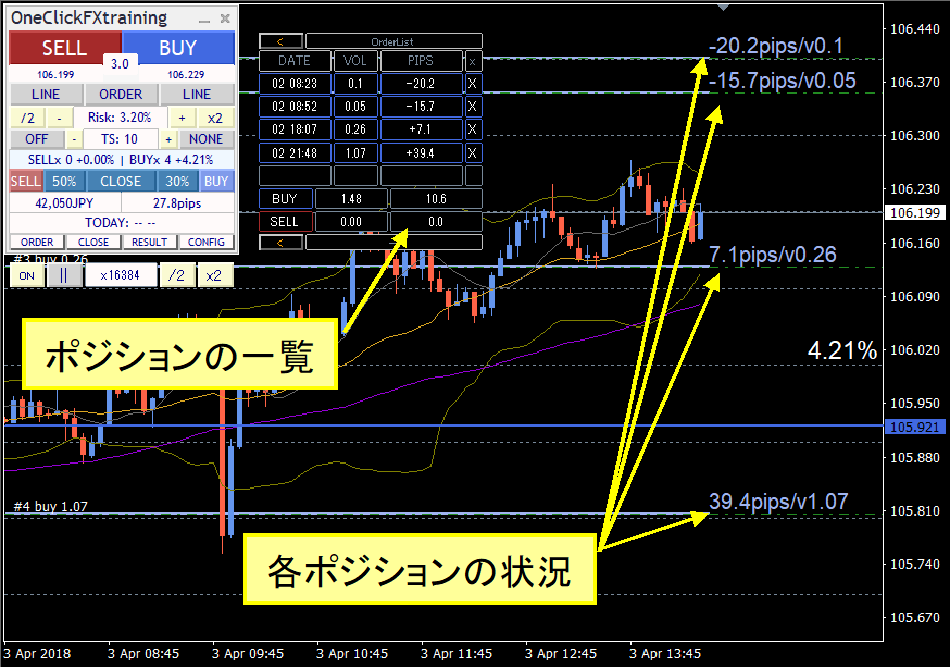
Shown in sync with the sub-panel's visibility.
Each position’s lot size and current PIPS are displayed.
Flexible Trailing Stop
The trailing stop blocks in the operation panel can turn ON/OFF for each trailing stop. There are areas to set TP for SELL, SL for SELL, and TS value, followed by BUY SL, BUY TP, allowing separate control of four trailing stops.
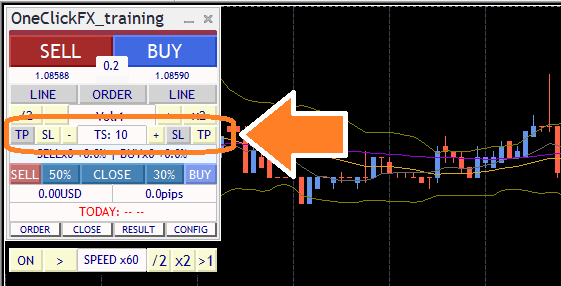
The purple line for trailing stops shows as dashed when OFF and becomes active when ON.
Trailing stops come in many modes.
From standard fixed trailing stops to Shrink that follows tick-by-tick, tick average, moving average, Bollinger bands, SAR, Chandelier Exit, etc., you can select the optimal pattern.
This video compares a standard fixed trailing stop with Shrink L. Both follow higher price highs, but Shrink moves the exit line toward the current price if the high is not updated, aiming for closer profits to the peak.
Fixed trailing stops lock in losses up to the selected value from the peak, whereas Shrink moves toward the peak to capture more profits.
■Chandelier Exit
Chandelier Exit uses ATR to automatically adapt to volatility changes. It becomes wider in strong trends and narrower in ranges or when volatility changes little, providing stop loss management that matches market conditions.
Strategic Close
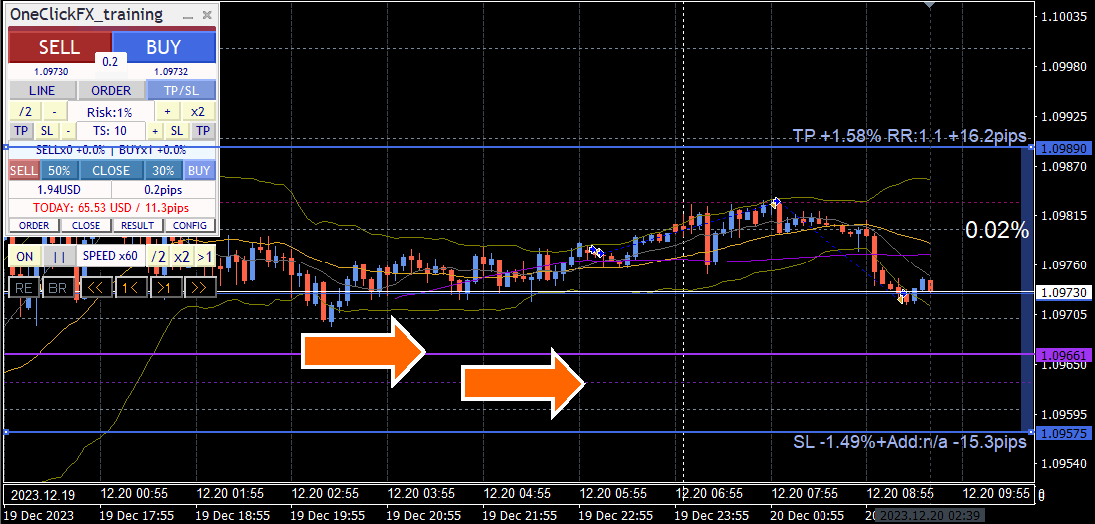
Typically, settlements occur when price reaches TP and SL lines, but Strategic Close allows multiple actions at that timing to improve future possibilities.
You can automatically turn on trailing stop when profit reaches the TP limit. If you settle then, you may miss extra profit, but triggering trailing stop can increase profits further.Increase profits furtherPossible.
By combining full settlements, partial settlements, trailing stops, TP/SL line resets, and additional purchases, you can pursue your own strategic settlements.
In this image, when TP is reached, 30% is settled to secure profit and reset TP/SL lines, sothe SL line moves above break-even, ensuring remaining positions do not incur losses.
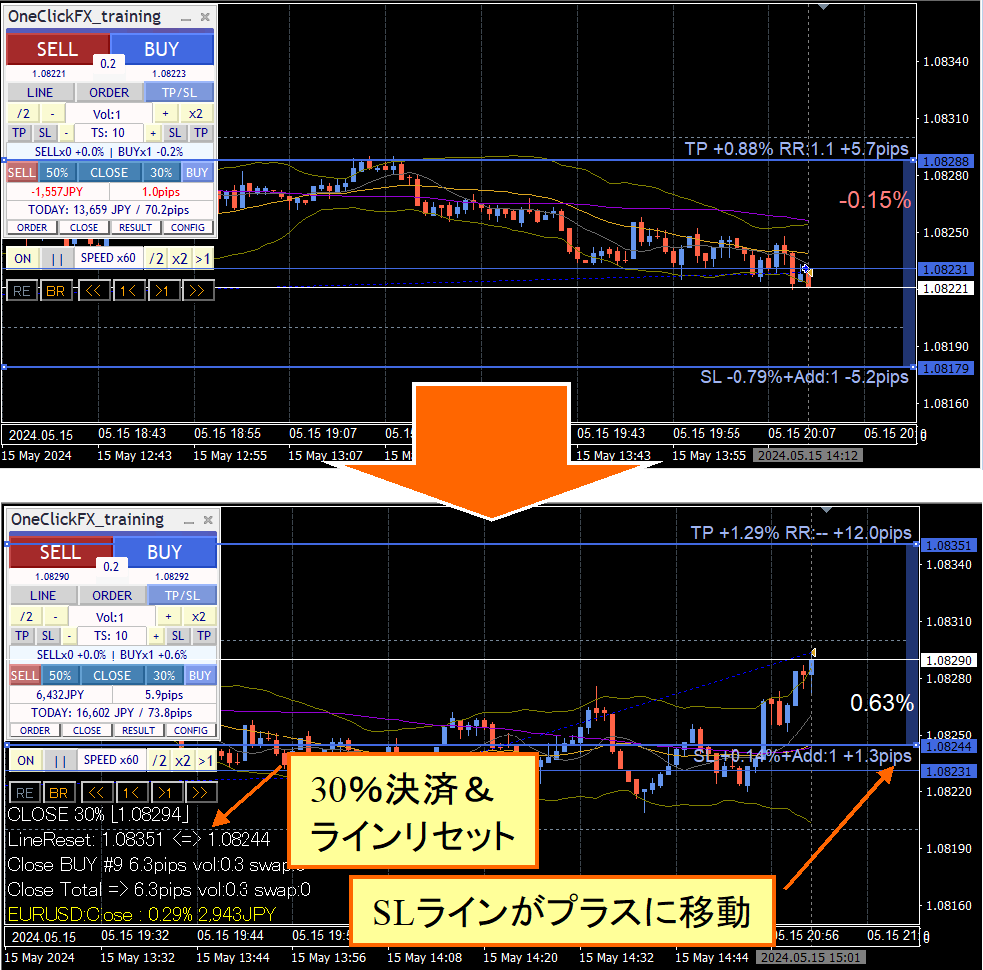
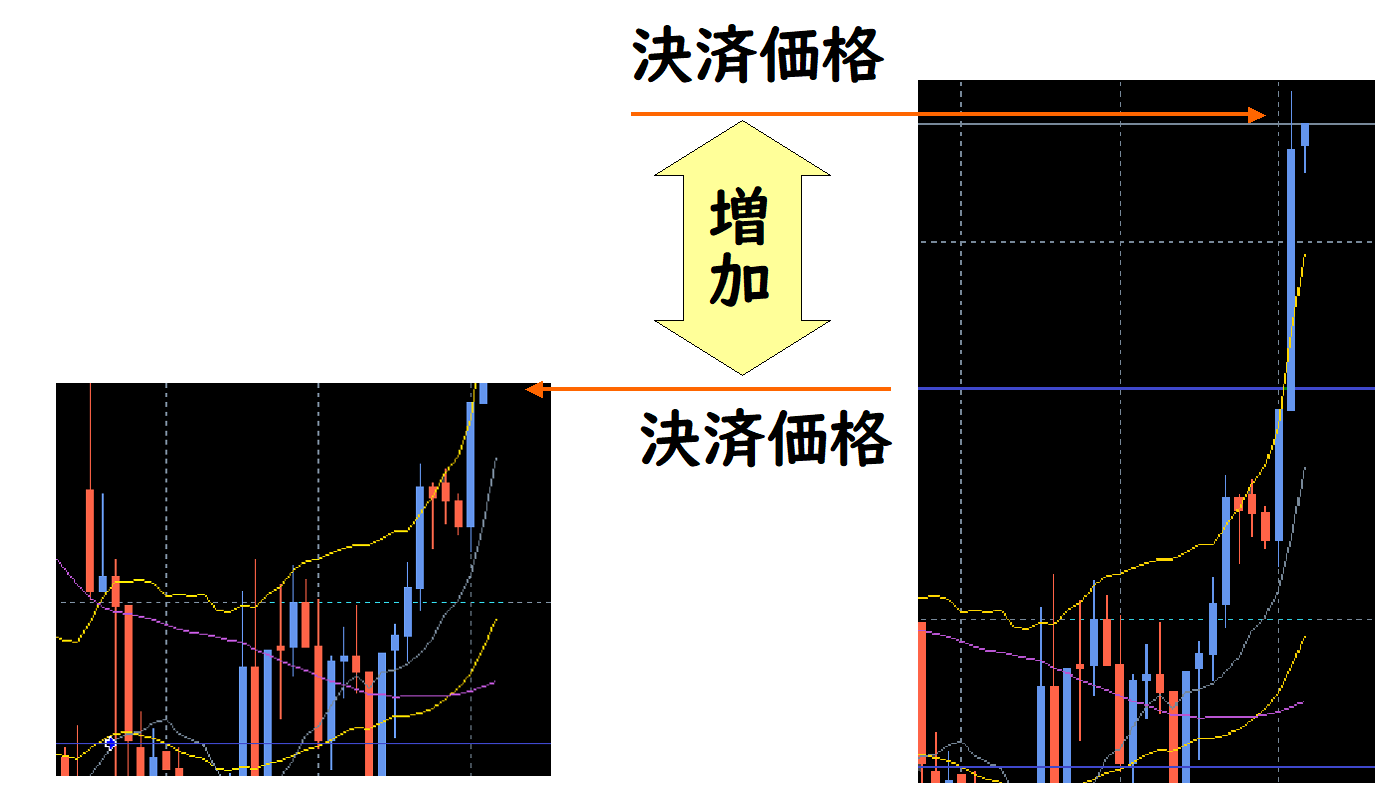
This video sets TP line to settle 30% and line reset, while an additional order is placed on the SL line. Left is the main chart at 1-minute, right is 5-minute. When TP line is reached, partial settlement occurs and the TP/SL line resets. For clarity, viewing the 5-minute left chart will show TP/SL line changes more clearly.
In principle, as the price goes up, partial settlements occur and as it goes down, additional orders are placed, soas long as the trend continues, infinite profits are possible. Of course such favorable markets do not exist, but with a rising index it might not be a dream. Please test it.
Using this method of adding entries, averaging down and placing buy orders on dips can be automated. By specifying actions on the TP/SL line rather than just settling, you can achieve strategic trading that was not possible before.
I believe the impact of this feature will be understood by experienced traders. One-Click FX is a pioneer, but it is normal for others to imitate; this feature may be copied, which is not unusual.
Total trades and win rate display
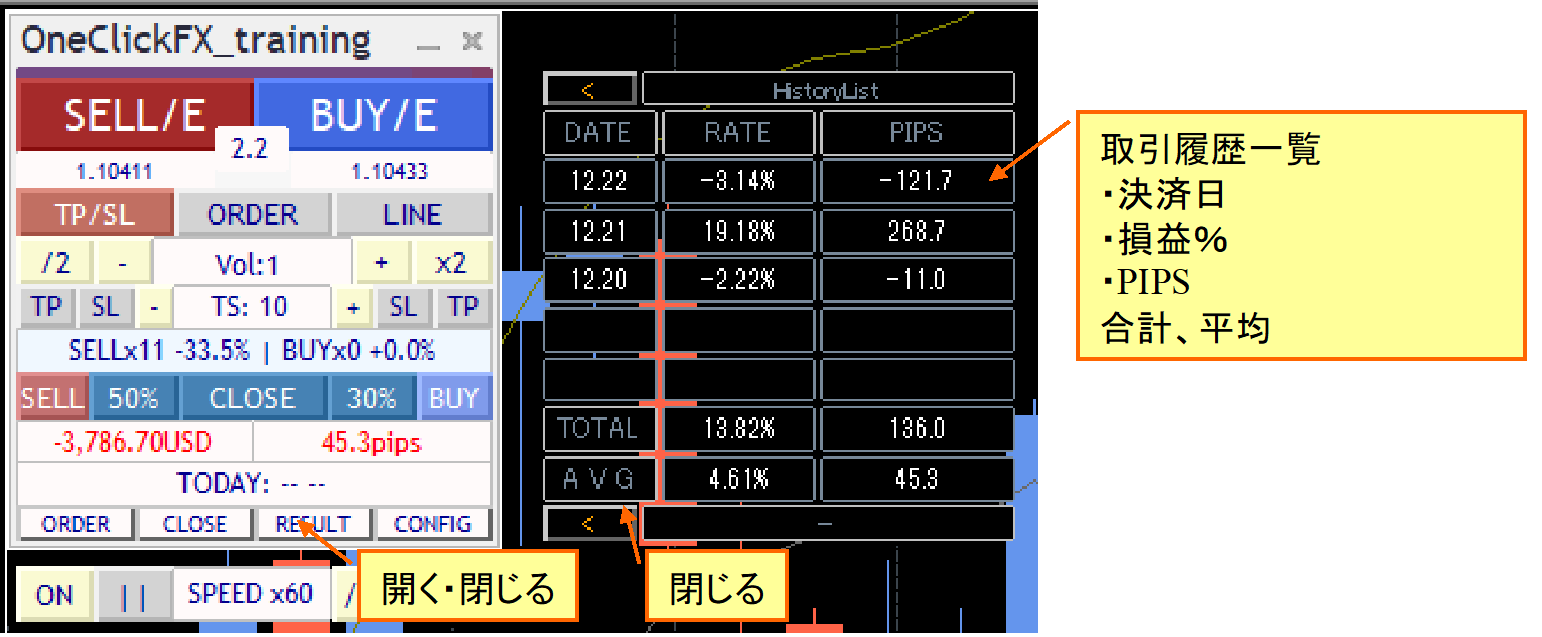
Today’s results can be selected from profit/loss, risk %, or PIPS.
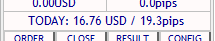
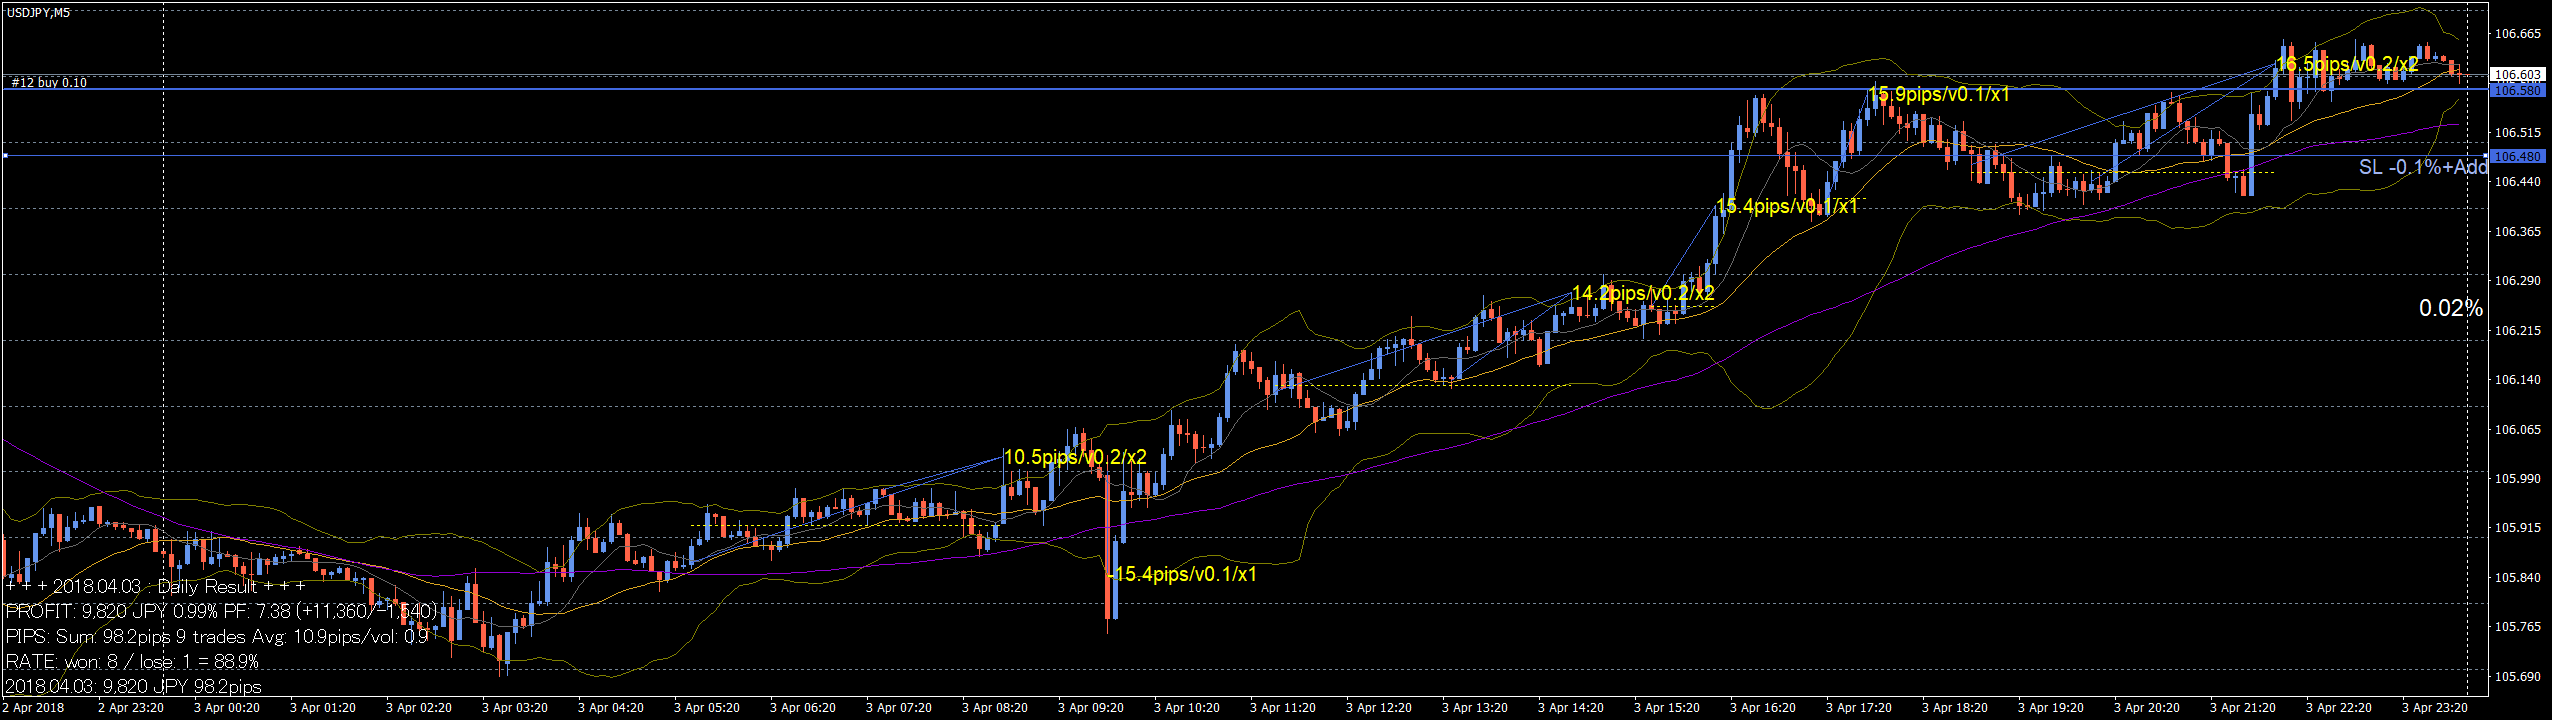
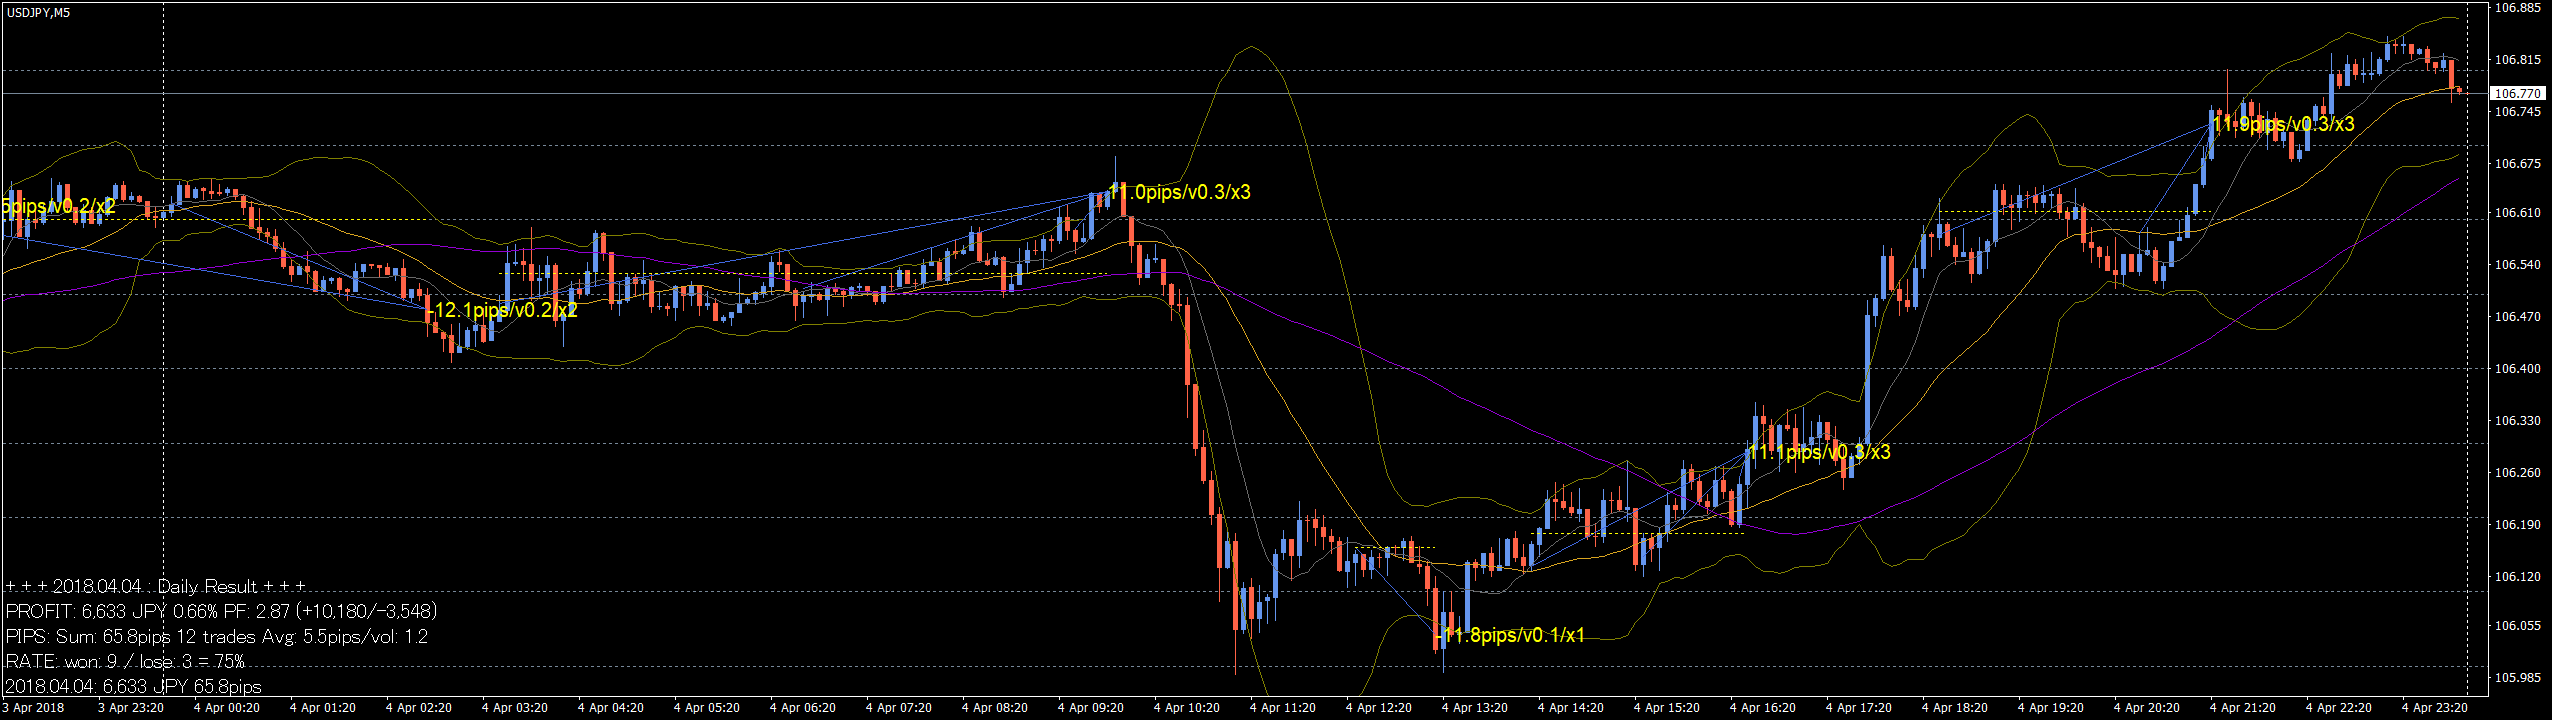
Open the RESULT sub-panel to see daily totals, past 5 days total and average. The chart displays trade history lines and results. Click the sub-panel’s date (or TOTAL) to see more detailed results in the bottom left of the screen.
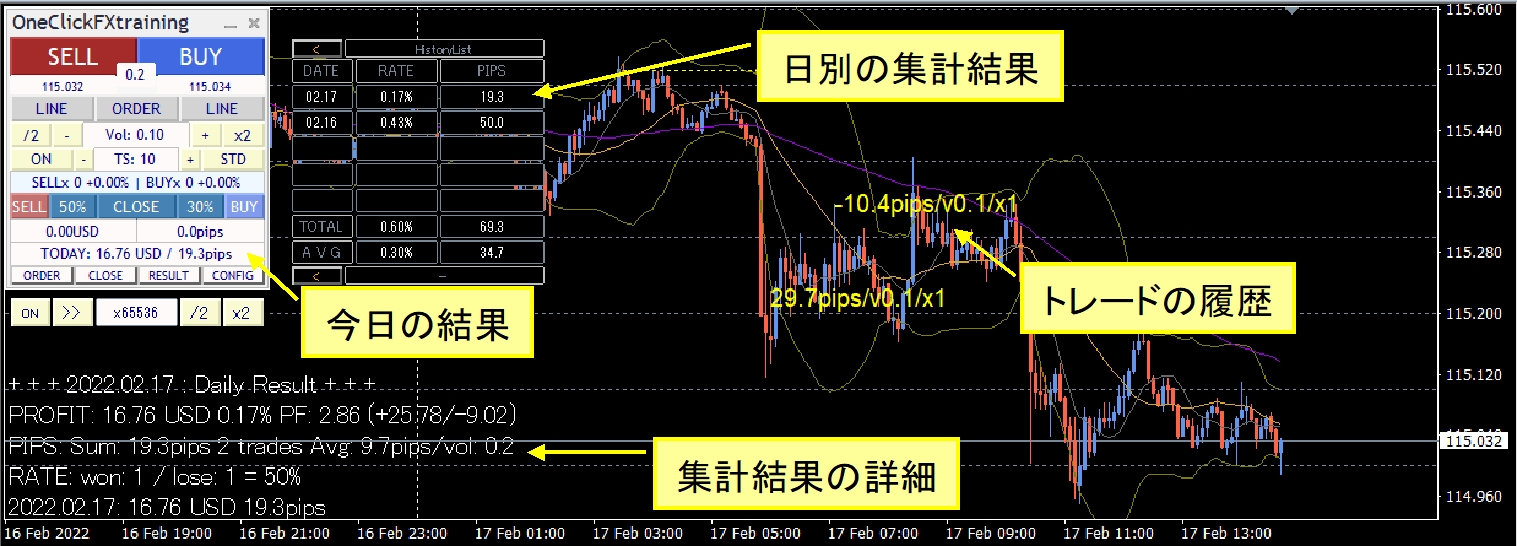
Positive values are shown in bright yellow, negative in dark yellow, with font size indicating the magnitude of P/L.
From November 2024 edition, not only daily totals but various aggregation periods are analyzable, and trade results details have been enhanced.
The history window shows total pips, average pip per trade, and volume average, enabling evaluation in amount terms as well as rate terms.
Current profit/loss status is graphed using MT4 standard features.
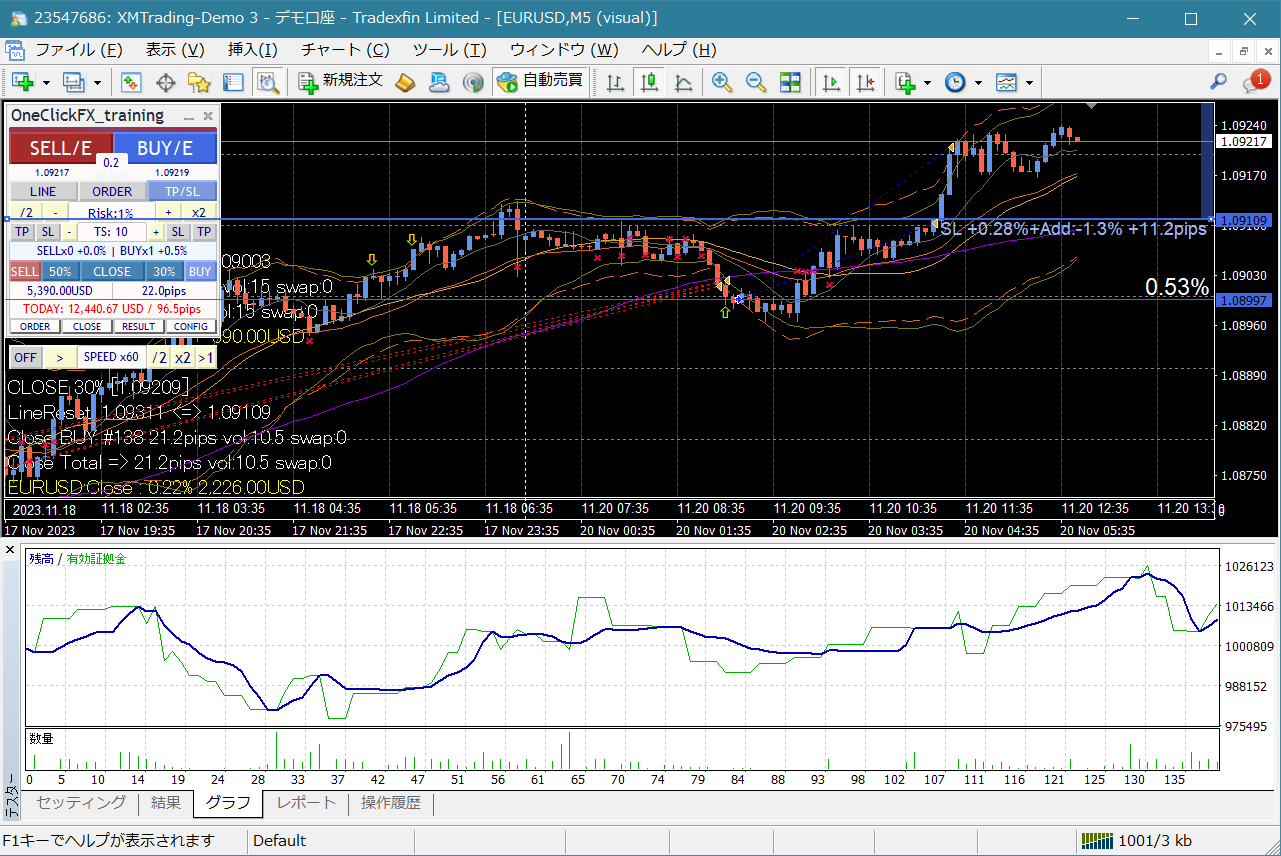
Chart Synchronization
There is also a feature to synchronize different timeframes or different currency pair charts. Active synchronized charts can behave like normal charts as well.
In the image, the left is EURUSD 1-hour main chart, the right is the synchronized chart at 30 minutes.
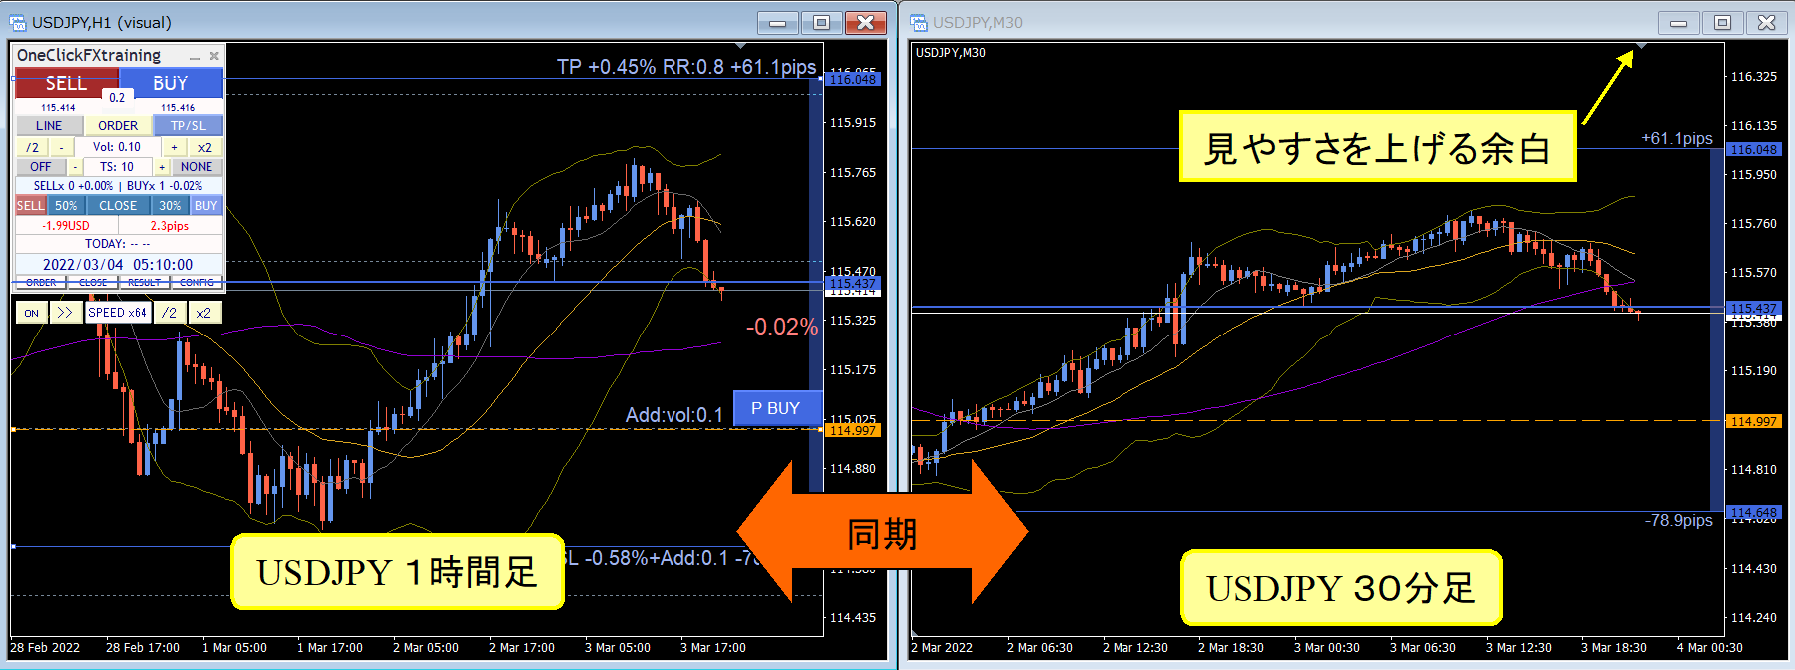
During synchronization, charts detect main-chart zoom changes and sub-charts align to the same scale. In simple synchronization, you can freely change time frames or currency pairs as with standard online charts. Main chart and sub-chart may have different roles, so you can freely swap to entirely different indicators for each.
This image shows USDJPY 1-minute, 5-minute, 1-hour on the top row, EURUSD 1-hour, EURJPY 1-hour, GBPJPY 1-hour, GOLD 1-hour on the bottom row.
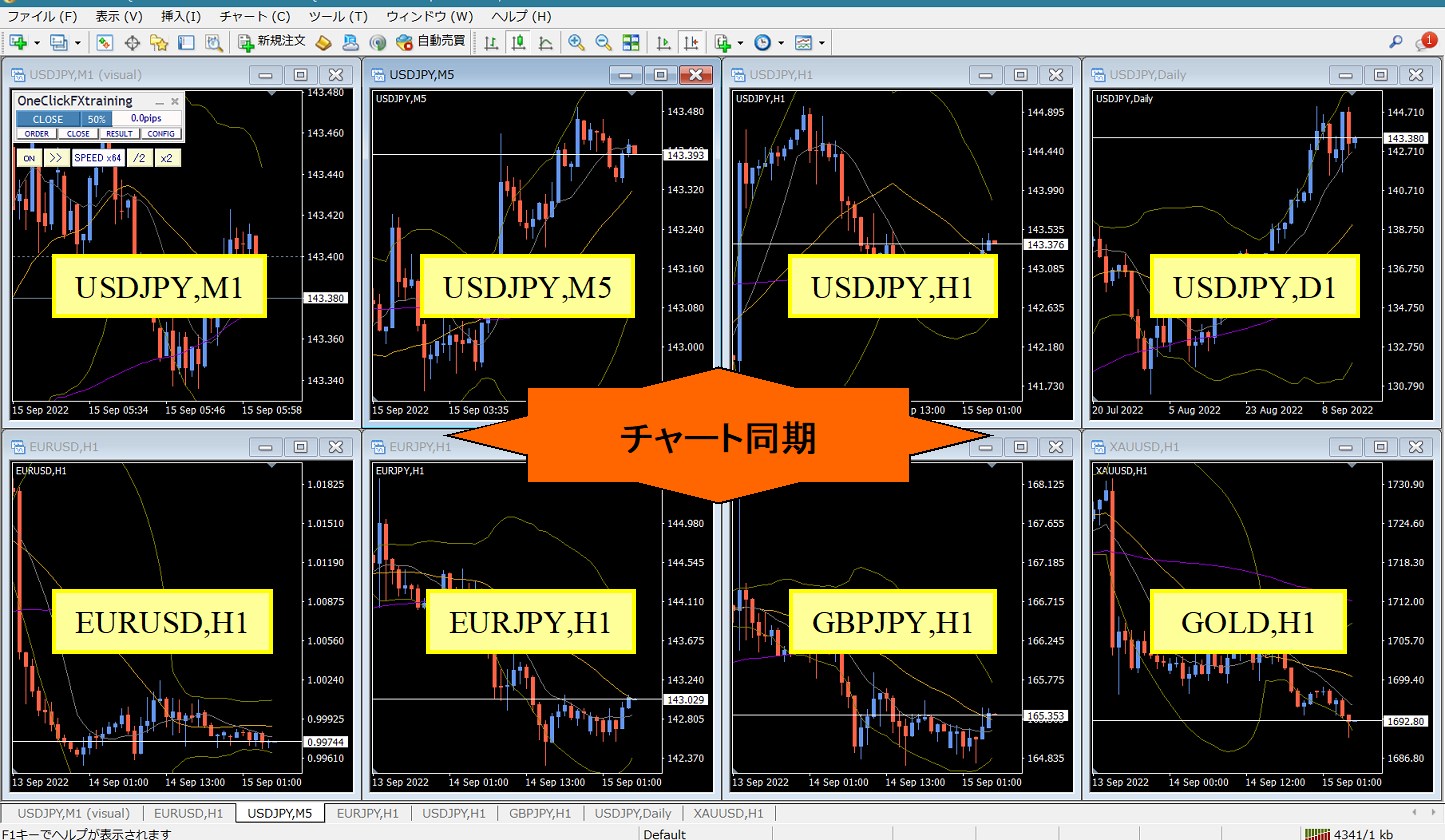
Synchronization is not limited to the same currency pair; it can apply to other currency pairs as well (synchronization timing for the same pair is 1 second, for other pairs 1 minute).
You may have seen famous traders’ setups with multi-monitor environments. It’s common to view many charts. You don’t need extensive equipment to synchronize multiple currency pairs without limitation, which is essential.
Speed control and time leap
The speed control at the bottom of the control box can be increased or decreased by values entered in the “Speed Control Speed List” parameter.
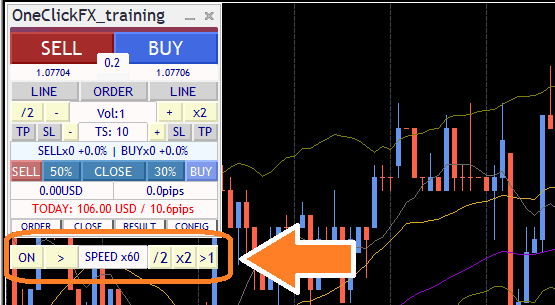
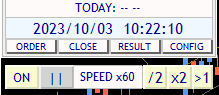
Final tick time can be shown or hidden via parameter.
Speed control ranges from 1x (1 second per real second) to 5x (1 second = 5 seconds), 60x (1 second = 1 minute), 1440x (1 second = 1 day), and you can set any multiplier. Maximum is 604800x (1 second = 1 week). However, it will not exceed the maximum speed of Strategy Tester. If speed control is OFF, the speed is the Strategy Tester’s maximum playback speed.
Clicking the “SPEED” area advances one tick, and the rightmost “>1” button moves to the next candle and stops at the first tick after the switch.
For scalping, you can play in a near real-time state to enter and exit.
Conversely, you can pause to examine an entry point and adjust limit orders or TP/SL,and fast-forward withAuto settlement to advance until an order fills, then automatic stop.
Using these features can significantly shorten practice and testing time.
Also, you can pause state while synchronized with charts of another timeframe and other currency pairs, enabling time-stopped analysis. You can analyze with time stopped.Even in paused time, you can swap indicators, adjust timeframes, or add other currency pairs to thoroughly analyze the current state.
Is this entry correct? Is this settlement correct? Is the stop loss line appropriate here?Pause time and think carefully
Past Verifier
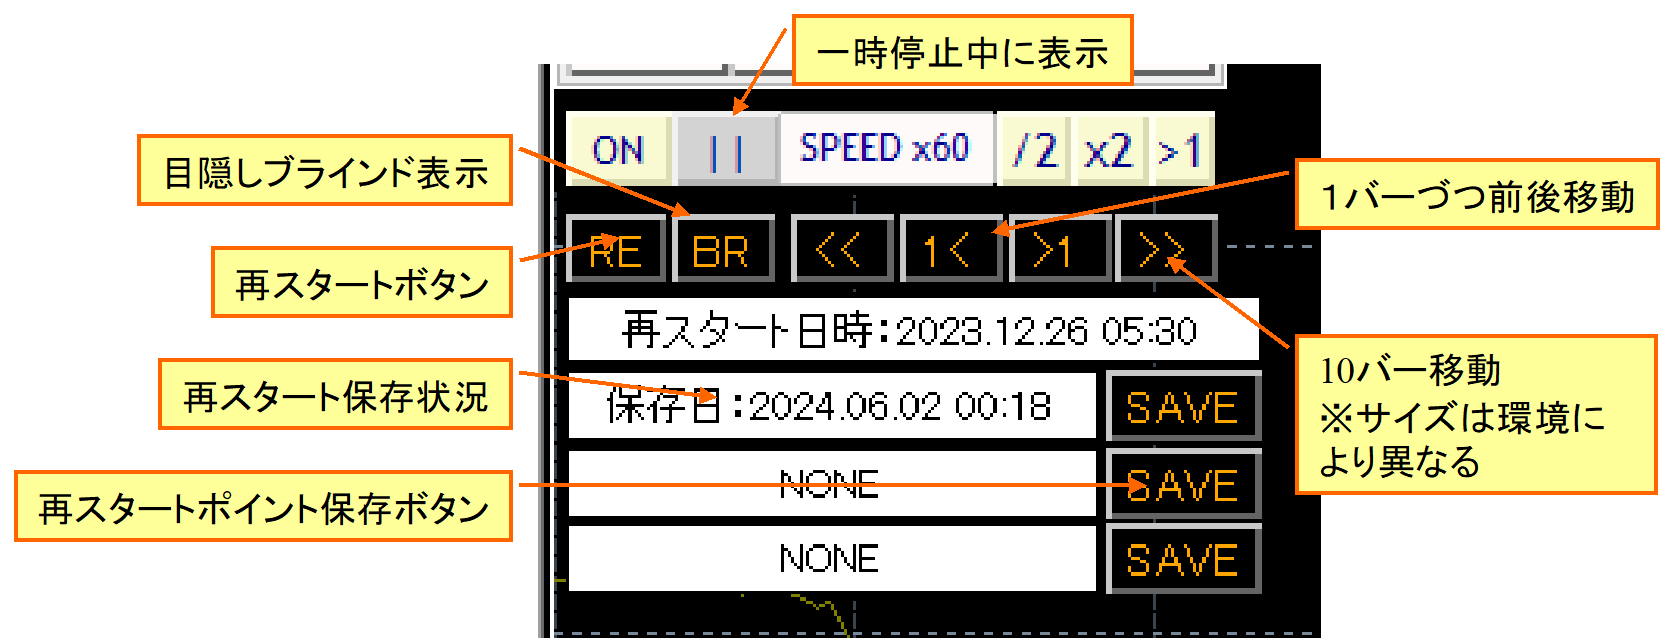
When you pause charts using speed control, control buttons appear below the speed control for Past Verifier.
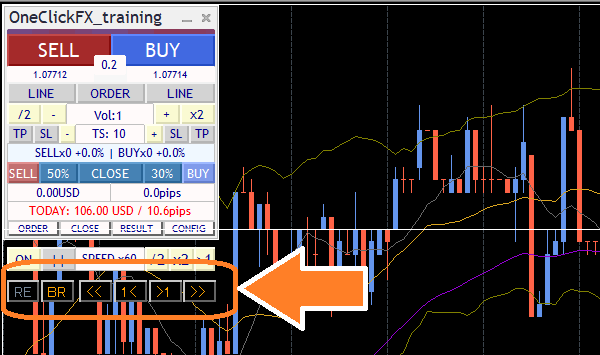
Synchronization lines on charts are faintly drawn; synchronized charts share the same time. Charts can be scrolled left and right, and when you scroll the main chart with the mouse or keyboard, synchronized charts align their sync lines accordingly.
Press "1<" or ">1" to move one candle at a time. "<<", ">>" move about 10 candles. The number moved depends on the chart zoom and environment.
Note: The simulator is paused, so you cannot go beyond the latest time. Also, changes to orders or settlements that modify the past are not possible. If you wish to change, use the next Restart feature.
In the paused time, you can review the past, view trading history, reflect, and if an unexpected result occurs, advance the candles one by one to examine causes or change indicators.Past Verifier can be effectively used for trade improvement and learning.
Restart, Time Leap
Replay function has been upgraded and reborn as Restart and Time Leap features.
Pause the chart, press the leftmost “RE” button on the Past Verifier state to display a panel. There are three save locations to store the current state.
After stopping, pressing the Start button displays a restart point selection screen.
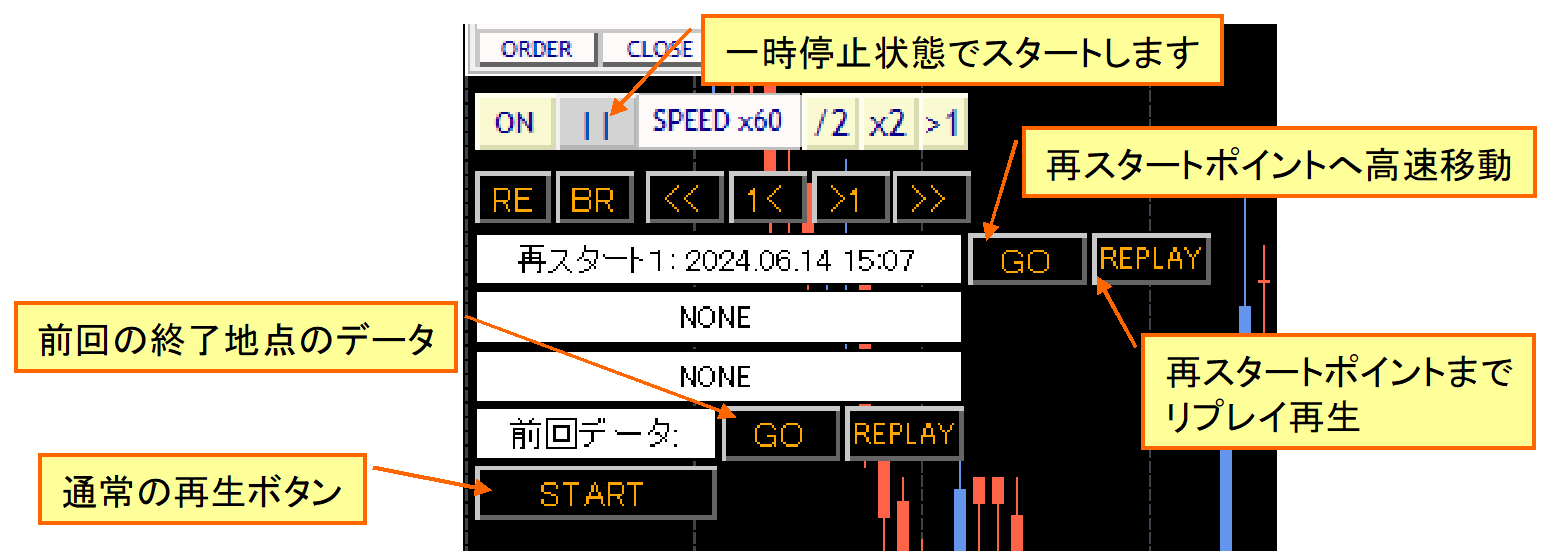
Press the “GO” button of a saved number to move there with fast-forward. The “REPLAY” button plays the same order in normal playback. Previous data replays from where you left off.
Not only the paused point, but if you scroll the chart back to a past point and save that time as a restart point, you can restart there.
This video shows restarting from a paused point to just before a settled point. You restart there and then finish, continuing from the previous data in the next run.
Of course, there is no fast-forward in the video.
Replay
Athletes analyze their own performances after a game to identify issues. Trading is similar: save your buy/sell history and review to find improvements. Note that the replay feature does not guarantee 100% exact reproduction.
During replay you may turn off replay playback. You can also turn it on later, and you can manually settle trades performed during replay. You can participate in the replay as well.
Replaying past trades helps calmly consider what was correct and what was wrong.
Auto-save of trading images
Automatically saves screen images at order placements and settlements.
You can save a single chart image or save a screenshot of the entire screen, including multiple synchronized charts.
■Daily image saving
Each day’s trading history and aggregation results are automatically saved when the date changes.
At the end, a horizontal panorama image from start to finish is automatically saved.

Case of trading for a few days on an hourly chart

Note: All trading images may not be saved correctly for very long periods due to size limitations.
Signal Tool Linkage
Linked with your signals or indicators, entries or pauses occur automatically.
For example, moving average golden cross, MACD positives/negatives, SAR reversals can trigger signals.
One-Click Auto Arrow Trade【AutoArwTrade】Just drop a signal tool that corresponds to signals into the same chart for extremely easy linkage trading.
One-Click Auto Arrow Trade【AutoArwTrade】is a function that links to One-Click FX series by standardizing the arrow names when signals occur. Compatible signal tools are provided on the support page for free and will continue to be added. If you request, development can also be done.
Moreover, complex conditions for signal linkage are possible!
For example, after a moving average gold cross, if a SAR reversal occurs, it links signals. If the current price is below the moving average and your signal tool shows an up-arrow… the combinations are endless.
With these features, you can drive signal linkage like an EA for easier testing. You can pause to practice discretionary trading using those signals.
Compatible with both object-type and index-type signals tools, but linkage to all signal tools is not guaranteed. For indicators that pull data from other timeframes or other currency pairs (as MT4 dictates), linkage may not work in Strategy Tester. Also there may be signal tools that are blocked due to protections (technical rejection possible).
If you have a signal tool you’d like tested for linkage, please contact us.
Entry Assist
Entry Assist detects price movement fluctuations and predicts price movement a few seconds ahead. It uses this judgment to automatically pause real orders at an optimal timing after pressing the entry button.
The judgment status of Entry Assist can be viewed on the color bar at the top of the control panel.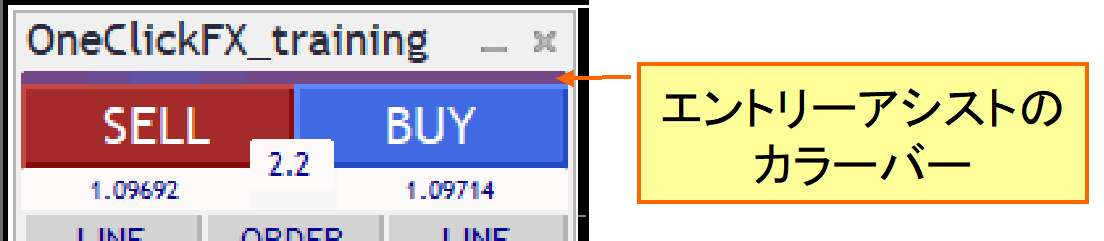
With a weak/medium/strong entry assist setting, pressing the entry button makes it lighter and the assistant waits for timing. Press again to force entry, and press the cancel button on the lower section to cancel the entry.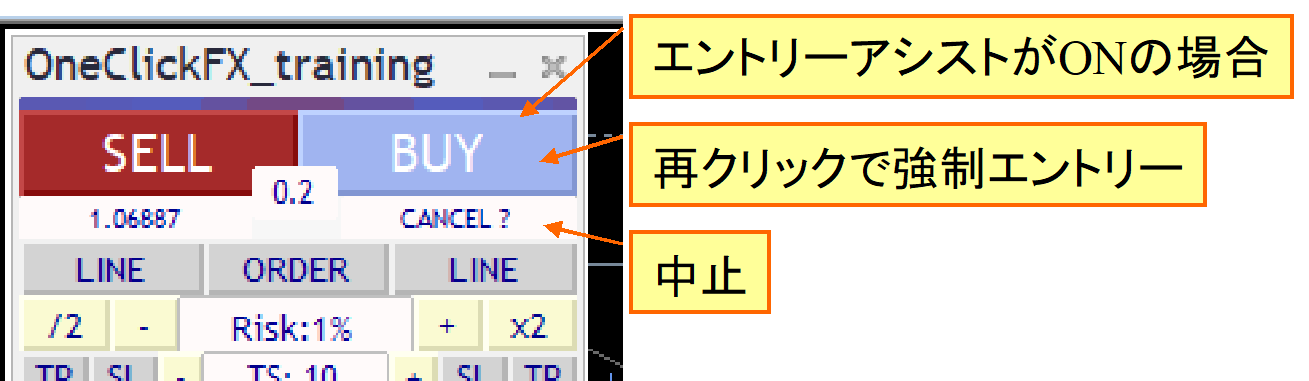
This feature predicts price movement a few seconds ahead, which can help suppress purchases when prices are falling significantly.
If you set the strength to “Strong,” the system may refrain from entering until prices rise completely, which can cause delays. Please adjust according to market conditions. It may not work optimally on testers or brokers with fixed spreads.
AI Judgment
One-Click FX Training MAXnow includesAI Judgmentwhich exports trade history and chart data in AI-analyzable formats, enabling objective review of results and AI-assisted improvement. This feature helps traders gain new perspectives and further enhance skills.
AI Judgment goes beyond simple history review and providesobjective, multi-angle AI analysis. It supports risk assessment, precision of entry timing, and scoring for strategy consistency, enabling quantitative evaluation of trading performance and informing future plans. In risk-managed investing, it supports evidence-based decisions.
NotesAI analysis requiresFree AI (perplexity.ai, wrtn.jp, ChatGPT) or ChatGPT Plus ($20/month). AI Judgment is a tool for analyzing trading results, not financial advice. Data and analyses are for reference and do not guarantee all future results. Please make final investment decisions at your own risk.
Economic Indicators Display
Included are perks like “Economy indicators are displayed subtly【EconomicData_rcm】” and “Local time,” so you can see economic release timings on the chart in Japan time.
Indicators display on synchronized charts and other timeframes/currency pairs, enabling multi-dimensional impact reproduction.
This video shows how major US indicators affect EURUSD on a 1-minute chart and compares synchronized charts of 5-minute EURUSD, USDJPY, EURJPY.
You can pause and step through one candle at a time in Past Verifier mode. If needed, you can save to restart later for replay.
You can verify across multiple currencies, so even US economic data can show impacts on EURJPY.
Standard Built-in Report Function
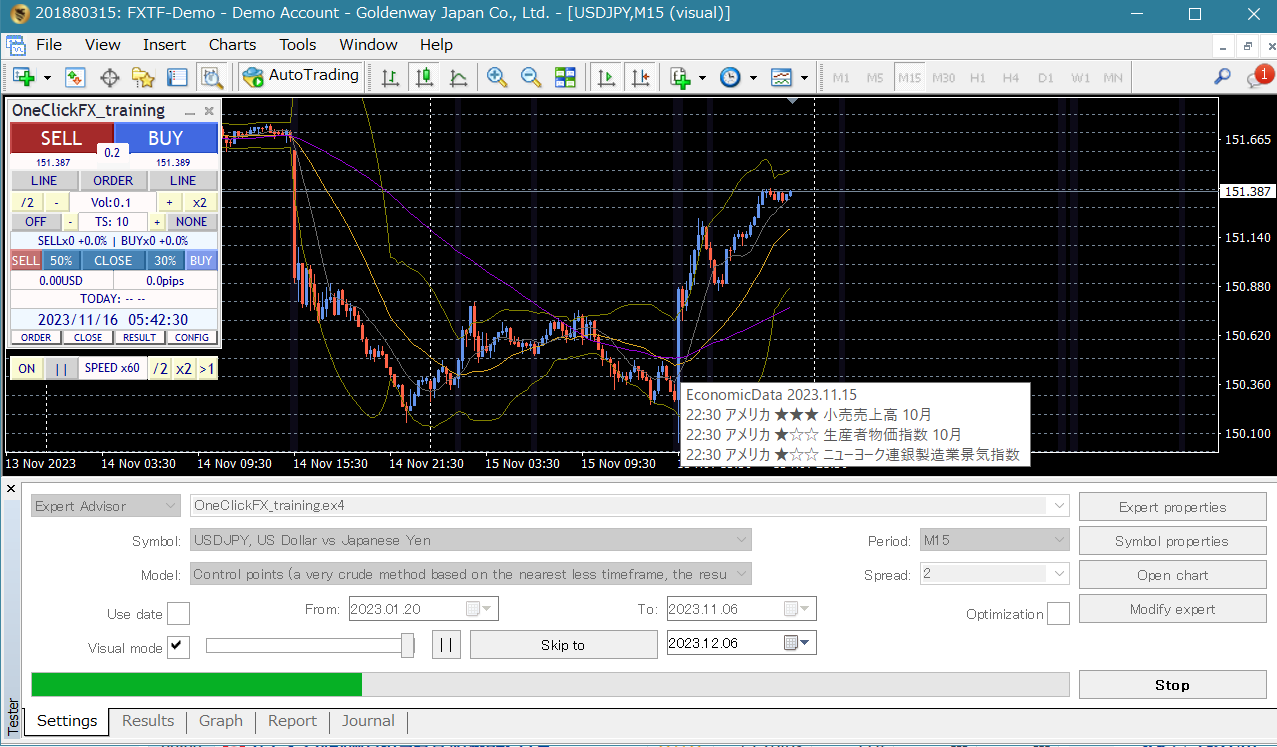
Finally comes the Strategy Tester feature.
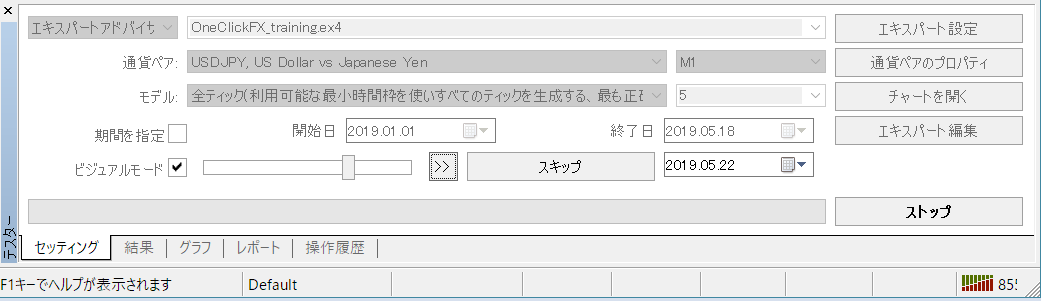
Standard MT4 functionality allows configuring currency pairs, tick accuracy, time frame, spread, and target period.
The standard feature cannot provide fine adjustments, but supports fast-forward, slow motion, skip to a specified date/time, and pause; rewind is not available. If Speed Control is ON, set Strategy Test speed to maximum (rightmost 32).
There are also results reports.
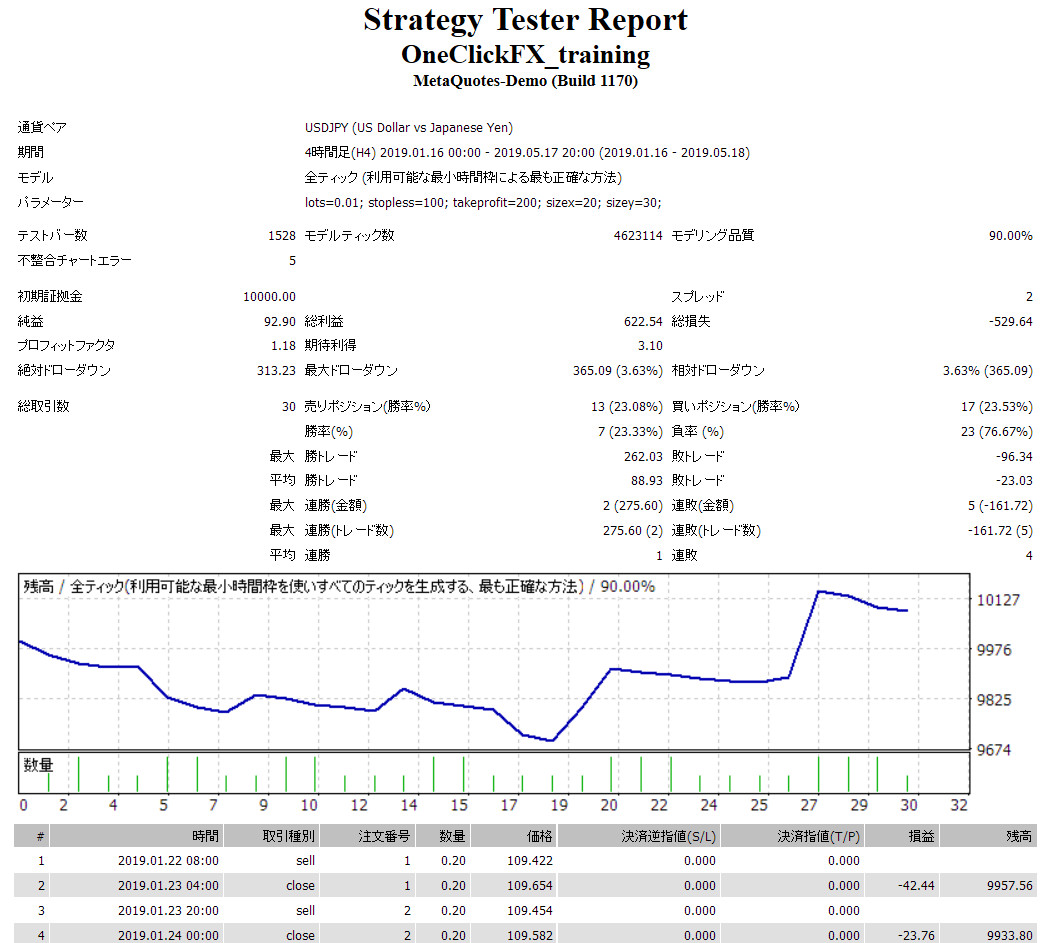 Note: The images shown are for USD/JPY results.
Starting with almost all losses and a bleak mid-game graph, two large wins later yield a final positive result.
This is a training trade, so you can smile; with real trading, you would have left earlier. Practicing won’t deplete money, so feel free to challenge.
Trading skill correlates with time spent viewing charts. Practice is possible in a demo, but you can only see charts at 1x speed. Change playback speed to 2x, 4x, 16x, 128x, 1024x to accumulate more experience for efficient skill growth.
By replaying your own trades, you may uncover drawbacks and issues.
Other Features
■ Forced settlement from keyboard
Press SHIFT+CTRL+ALT plus another key to perform forced full settlement. In scalping, this is a useful feature. Playback speed reduces.
■ Automatic splitting
Orders larger than one lot may cause slippage; splitting a single order into multiple parts reduces slippage, per customer requests. Differences may occur by broker; effectiveness varies. This function works, but very small lot splitting may delay orders and partial settlements may be blocked, so use caution.
■ Server orders
TP/SL line locations are automatically placed on the server at order time. If lines are changed later, change orders are also issued. However, if Strategic Close is set, server orders take precedence and you cannot use those features.
Server orders include a first-time only option to place the initial TP/SL and not modify thereafter. This enables per-position server orders.
■ Maximum number of positions
When the maximum number of positions is reached, additional orders are not accepted. If linked to signals, positions could be unlimited; implement restrictions. The same applies to martingale-like settings in Strategic Close.
The number of held positions is governed by broker limits. In auto-split it is allowed up to the limit; after exceeding, additional orders are not allowed.
■ Notifications
There are notification features for LINE and Discord. Not always necessary for practice, but can catch alerts for production use.
■ Support・Assistance
A convenient feature to collect information with one button when contacting support during trouble.
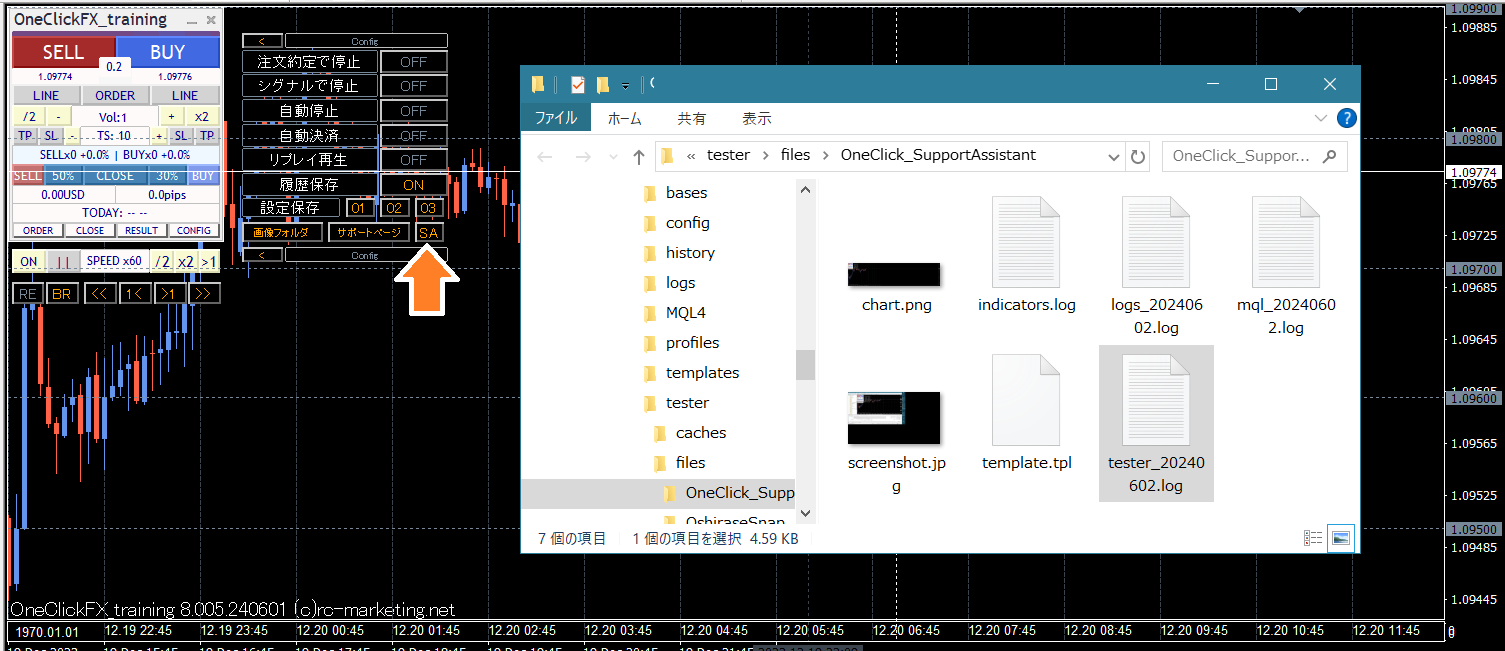
When trouble occurs or something unknown happens, sending the data produced by this feature can simplify explanations to support.
Pressing the button collects information and opens a folder; please email the output files.
Note: The same function is provided by scripts as well.
Included Tools, Config Files, etc.
■Volatility at a glance! Pips-unit Grid
Display is now in PIPS, so we add an indicator that grids volatility in PIPS for instant clarity.
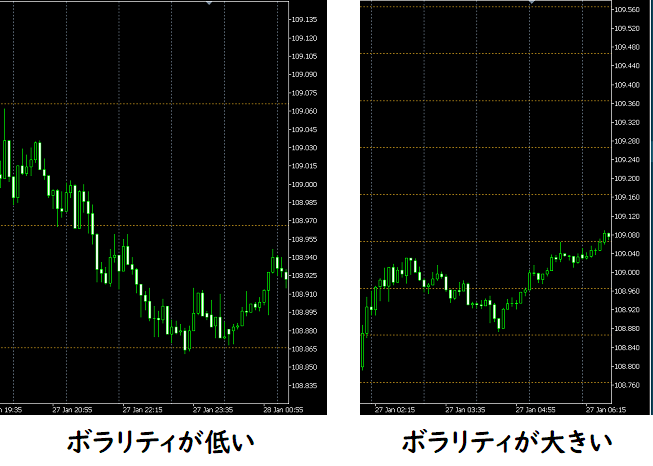
By making horizontal grid lines in PIPS units, when width is narrow volatility is high, and when wide, volatility is low. Note: Included in the main chart templated chart.
■Economy indicators always checked!
Displays economic indicator release information on the chart.
Data is sourced from Min-Kabu (みんかぶ).
Double-click the indicator lines on the chart to view details on Min-Kabu’s economic indicators page.
Indicators are displayed across the right edge of charts, so you can anticipate forthcoming releases.
■Local time
Japan time is displayed at the bottom of the chart.
Lightweight tool with minimal impact on performance. It supports past daylight saving times. Although simple, it’s convenient to compare economic indicators in Japan time.
■Keyboard operation tool
Tool to perform playback, stop, fast-forward, move one tick, move one candle, etc., from the keyboard.
■Sample templated chart for signal tool linkage
Sample templated chart or config that responds to signal tools or chart changes for linked-entry in training charts.
Just apply the config and turn linkage ON to connect to signals.
▽ Samples of linked signal tools
1. Bollinger Band breakout
2. Moving average cross
3. Parabolic SAR reversal
4. MACD, Moving Average, Bollinger Band combination
The bonus provides common entry points, and you can linkage-entry with your own signal tools (regardless of provider). If you’re unsure how to configure, contact us for support.
■Past data application tool
Tool to convert past data downloaded from Support page so it can be used in MT4’s timeframes.
Free downloads from Support Blog
■Past data
Past data prepared on the support page is provided; if you tell us the currency pair and period, we’ll prepare past data. Usually data available in MT4/MT5 formats.
■Object synchronization tool
Synchronizes trend lines and Fibonacci lines between tester main and sub charts. Drawing a trend line on one chart will place the same line on the other chart at the same point.
From the Author
Practice and verification tools that reproduce realistic price movements across multiple charts are ideal if they create an impression of real trading.
However, realism can be inconvenient. Practicing on a typical demo account is inefficient and takes a long time to see results. A near-real environment that still allows freedom is the appeal of a simulator.
The most basic possible feature in reality is to stop time. In paused time, you can display other timeframes and currency pair charts, move time backward and forward, and synchronize market changes across charts.
If you make an irreversible mistake, you can time-leap and try again at the same moment as many times as needed.
This isn’t a fantasy; it’s possible only with a simulator and is a valuable feature for practice and testing tools.
Excellent traders need excellent environments. Gaining this environment might dramatically improve trading skills.
Please try out your potential.
■Postscript 1
One-Click FX Training MAXis extremely feature-rich, so beginners might find it complex. However, with default settings, it provides standard FX functionality, enabling easy operations with typical FX knowledge. Server orders and full settlements via TP/SL lines are fully supported.
Starting with lower-feature tools is an option, but as skills improve, you’ll want to test more possibilities. If the tool lacks capacity for those possibilities, that would be a loss.
“Training for real trading is essential; a tool only for practice isn’t meaningful.” This is feedback we received previously.One-Click FX Trainingincludes a product for real trading, “One-Click FX MAX,” designed to reproduce training results in real trading with the same operations.
Beyond FX, using appropriate tools leads to better results. Training/verification tools are indispensable for skill verification and strategy development, so we will continue to adapt to trends and customer requests.
■Postscript 2
Note: This postscript is from the tool developer’s perspective. If you’re interested, please read it.
One-Click FX Seriesis continuing AI linkage testing, but currently offers effects beyond hype. However, this is only a matter of time.
One-Click FX Training MAXadds not only strategic close and flexible trailing stops and entry assist but also advanced assist features that go beyond simply following user-set limits.
We believe third-generation trading has just begun, and in a few years AI-assisted trading could be standard in MT4/MT5. But that doesn’t guarantee everyone will win. AI has its own personality, so the competition will focus on which AI is trained and integrated.
These discussions are endless, but usage now is up to the customer. However, the presence or absence of features marks the gap in technical capability.One-Click FX Training MAXproudly claims world-class performance, yet believes there is still room to assist traders.
One-Click FX Seriesaims to improve workflow, save time, uplift skills, and contribute to a more enjoyable trading life.