

Use of the "Visualization Indicator" (Part 181)
The use of "Visualization Indicator" (its181)
1. evolve the "28 Currency Pairs List Indicator" into a more advanced indicator
“8CPVisualization Indicator”to drawGBPUSD.
The “8CPVisualization Indicator” includesOceania version,London version,NewYork version,AnyCP version. This time, theLondon version was used.
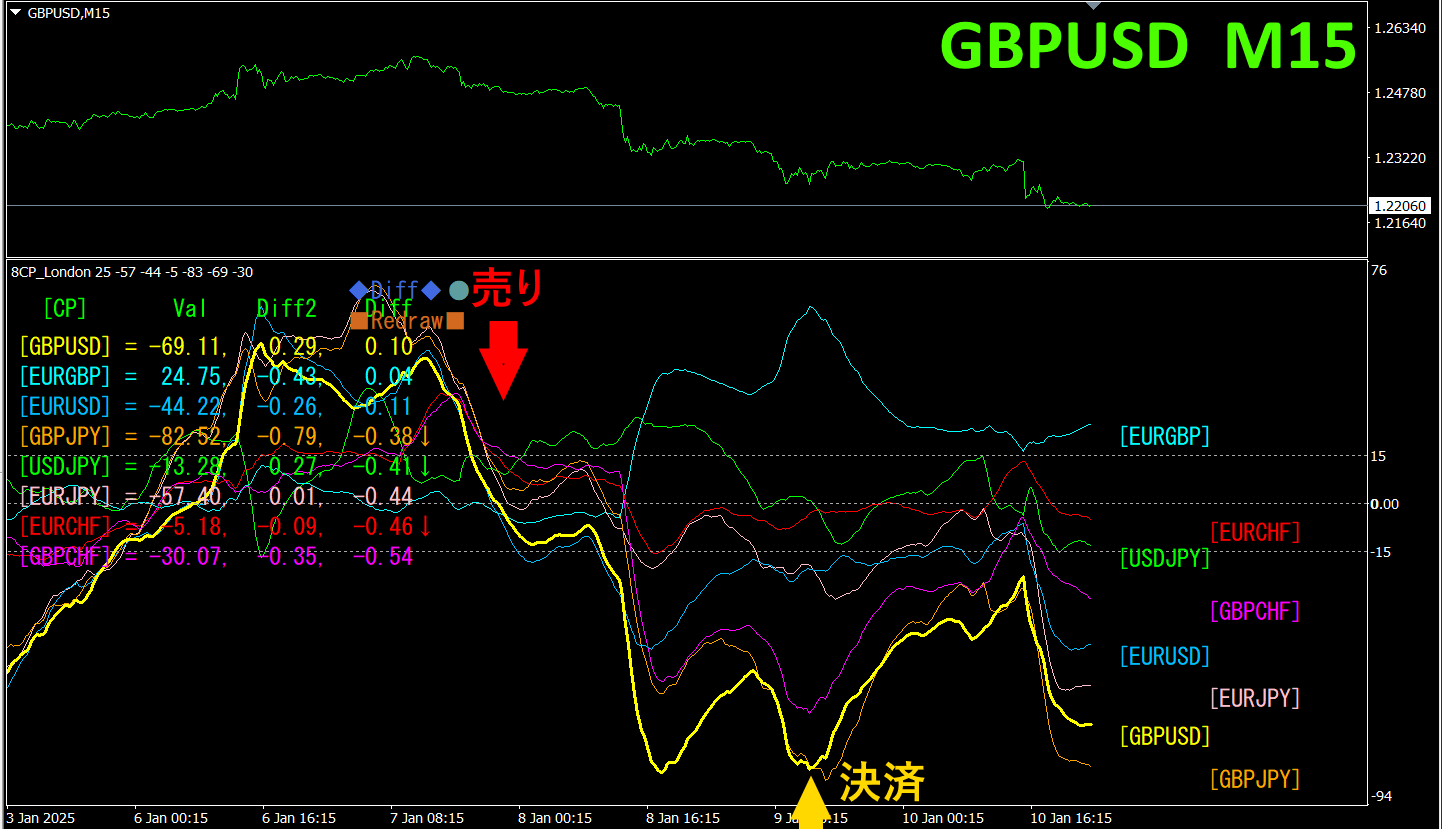
The upper half is the 15-minute chart ofGBPUSD. The lower half is from the “8CPVisualization Indicator”; the yellow bold line graph corresponds toGBPUSD.
GBPUSD's graph breaks the zero line and falls; when it breaks below from the other graphs, a sell position is opened. When the indicator graphs bottom out and reverse, close the position. About230pips of profit was earned.
You may draw a diagonal downward trend line and hold until it is broken upward.
If you use “TrendLine-EX”, you can automate entry and exit when the diagonal trend line is broken. You can simply leave it as is, enabling easy trading. “TrendLine-EX” is a semi-automatic EA that can short automatically when the trend line is broken downward and automatically close when it breaks upward.
2. Best SelectTry the indicator
The figure below is a screenshot fromJanuary 9, 2025,16:43 (JST).
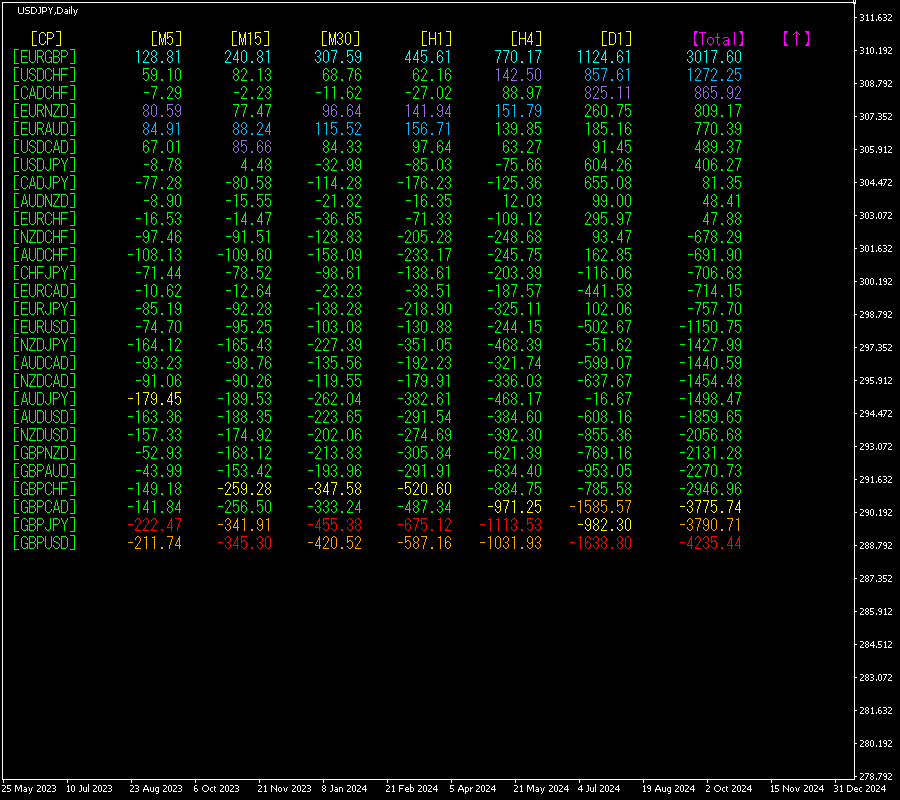
Total]numbers are arranged in descending order. At the bottom,GBPUSD shows red in all timeframes.Total value is-4235.44GBPUSD, a large negative figure. This suggests a significant downtrend for.
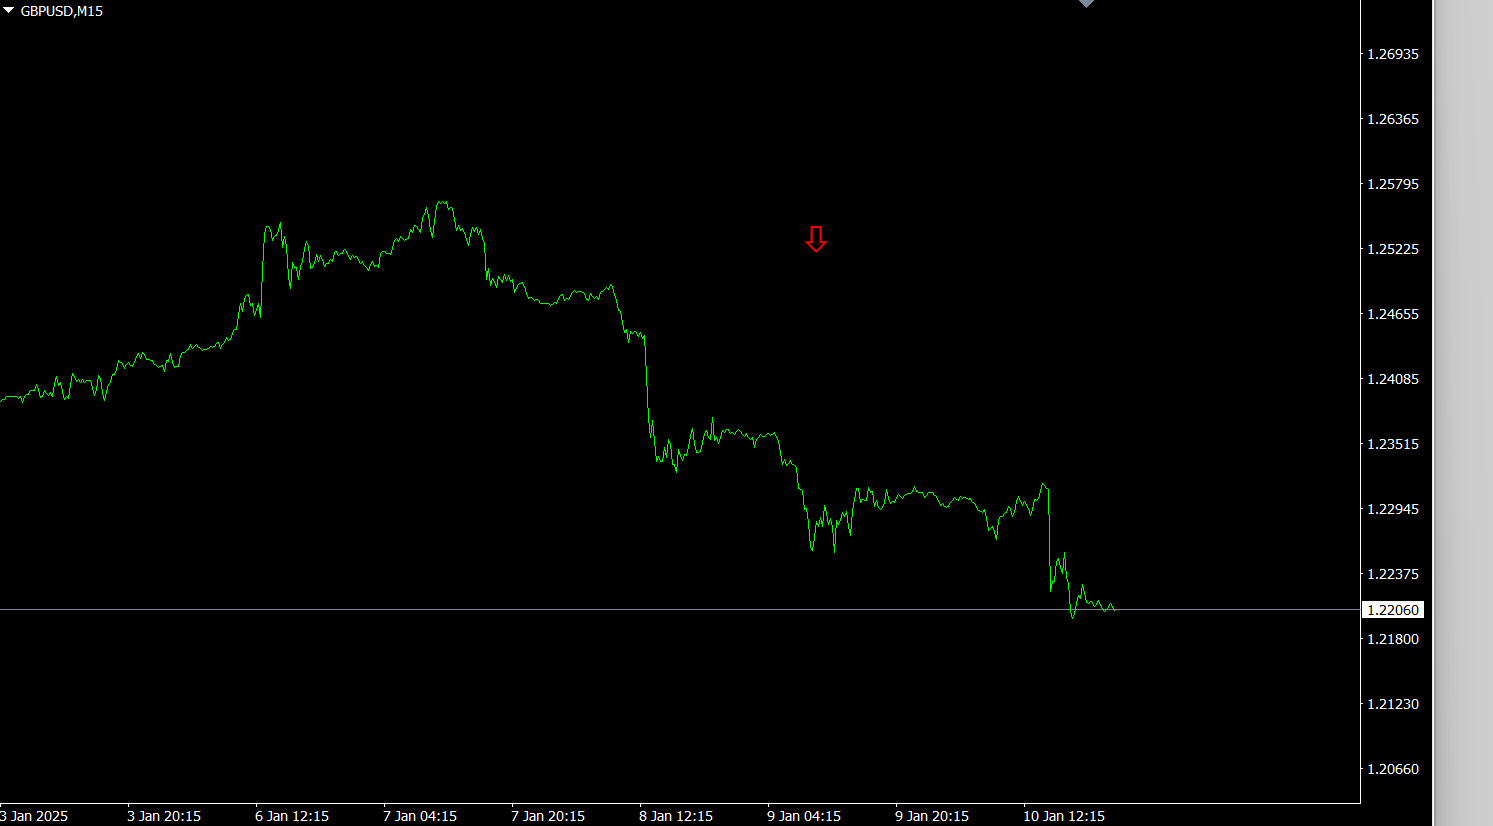
Now, let's look at the GBPUSD chart.
The red arrow marks the screenshot point, capturing a large drop mid-trend.
The “28 Currency PairsBest Select Indicator allows you to easily identify which currency among the 28 pairs has the strongest trend. It also tells you, by numbers and colors, whether you should trade now. You can assess all currency pairs at a glance with this excellent indicator.
“28 Currency PairsBest Select

https://www.gogojungle.co.jp/tools/indicators/35128
3. 2021 year5 monthto present EURJPY movement has been tracked?
We have been tracking EURJPY since2021 year5 month
To view the overall trend, we draw about30 minutes of the most recent3 weeks on a chart.
Last time, I wrote as follows.
Pink isEUR, green isJPY. The two form large waves, withEUR rising andJPY falling, soEURJPY is expected to move upward.
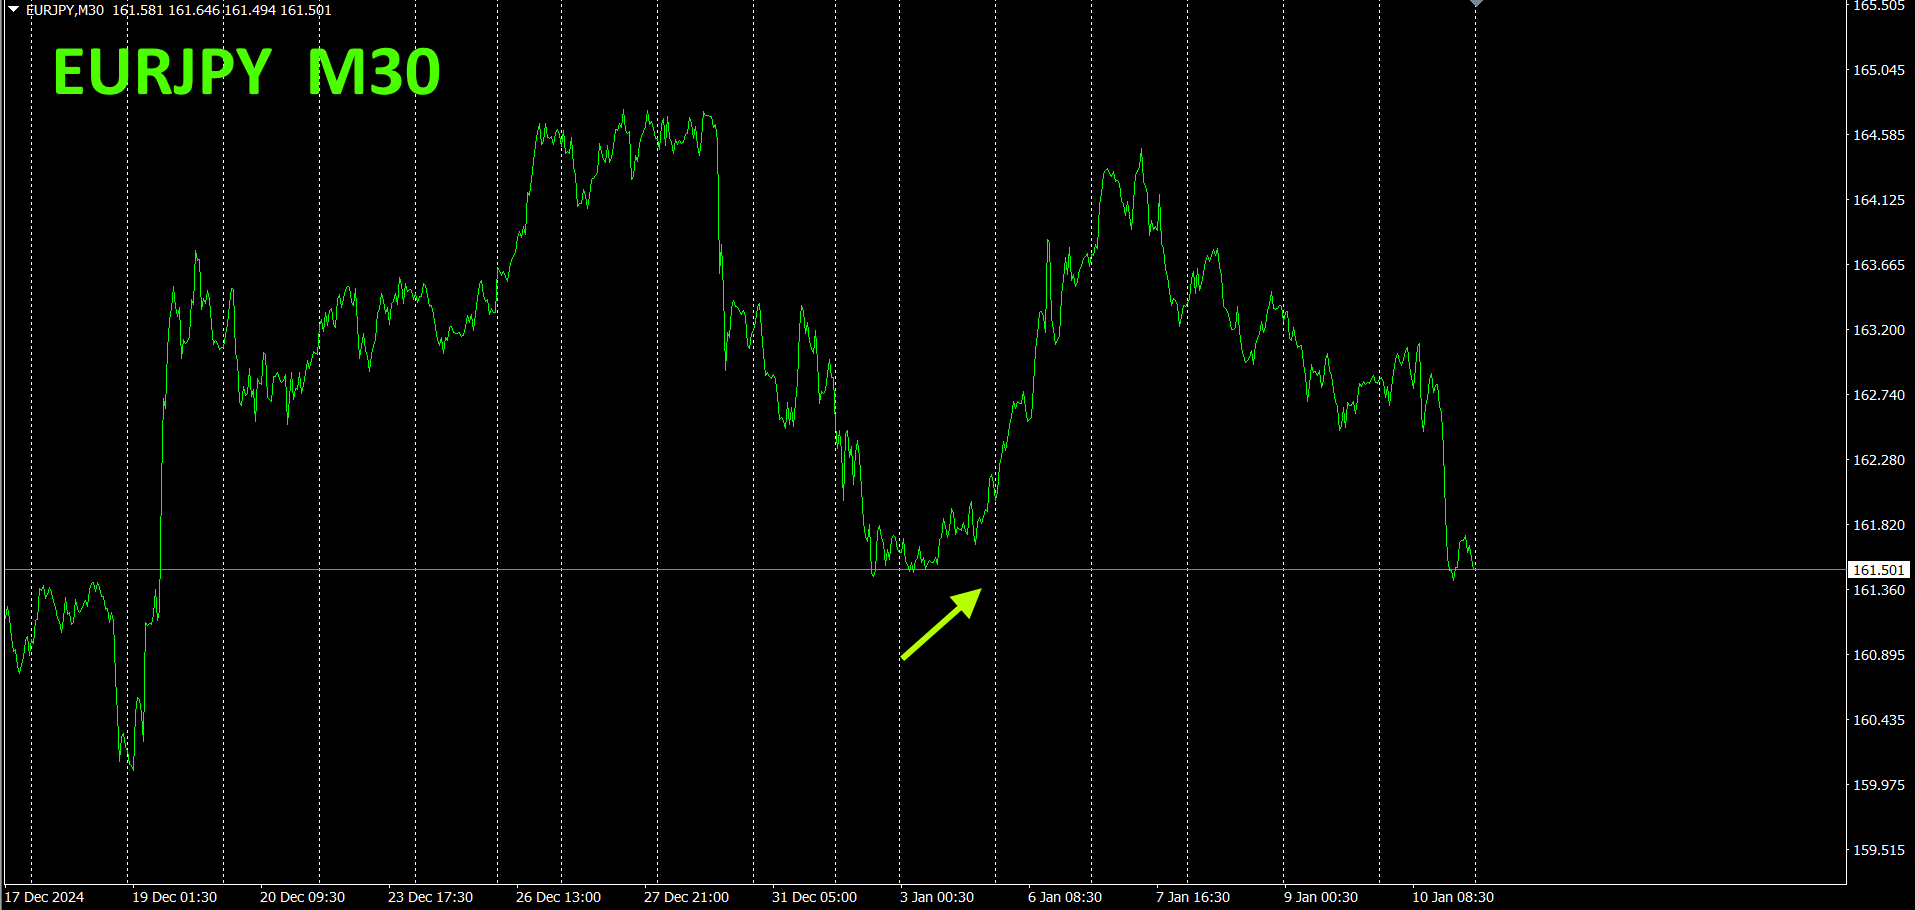
As predicted, it rose significantly. The extent of the rise was large, yielding over300pips in profit.
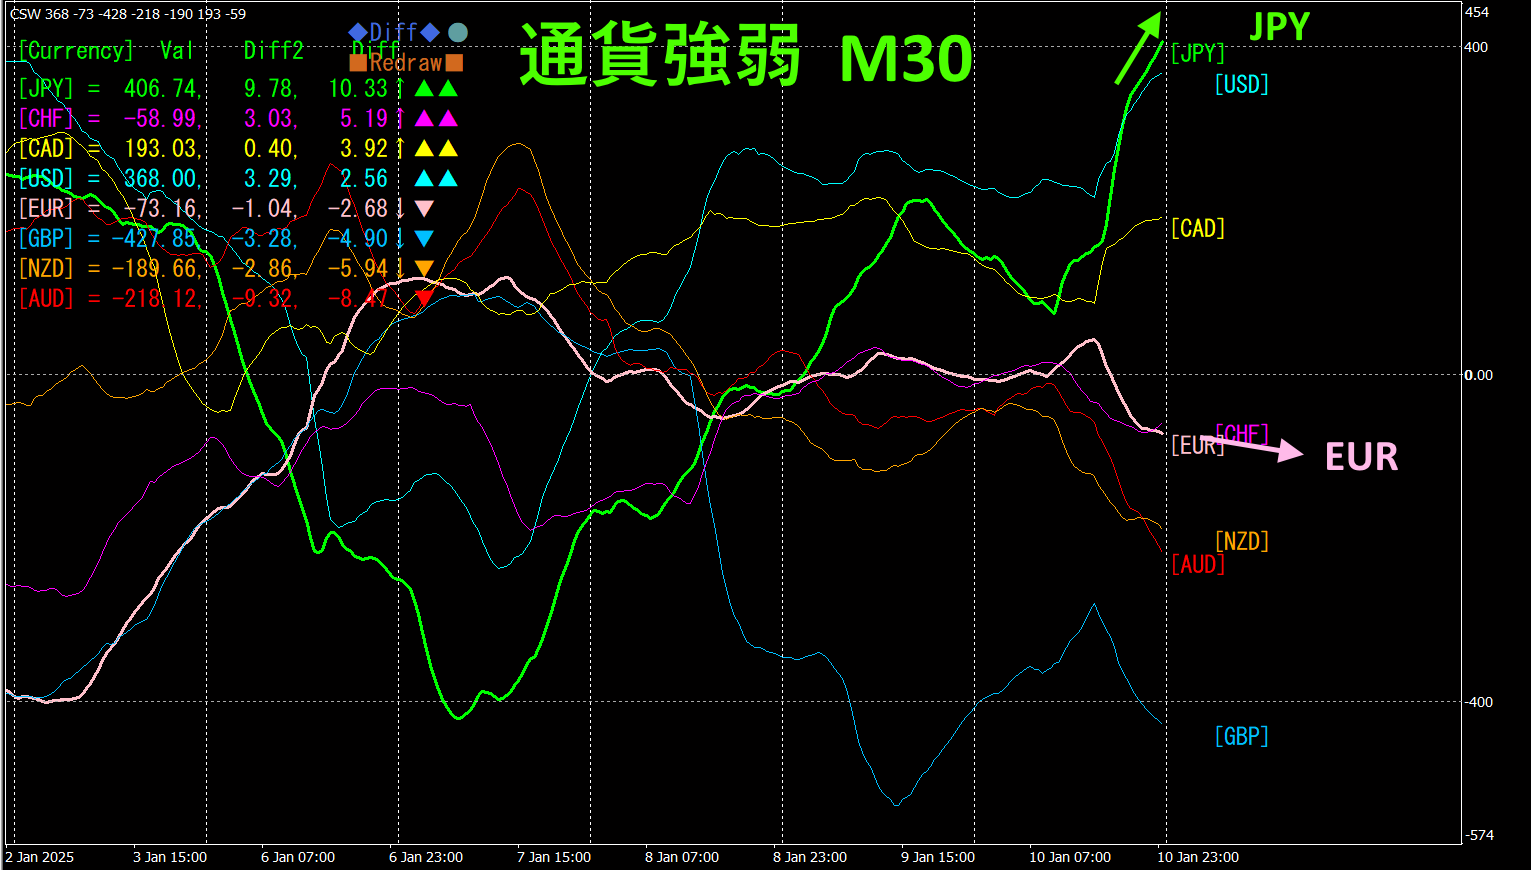
30 minutes of currency strength chart.
Pink isEUR, green isJPY. The two create large waves, withJPY rising strongly,EUR slightly downward, so going forwardEURJPY is expected to fall.
4.
Using the “Toretore Indicator”
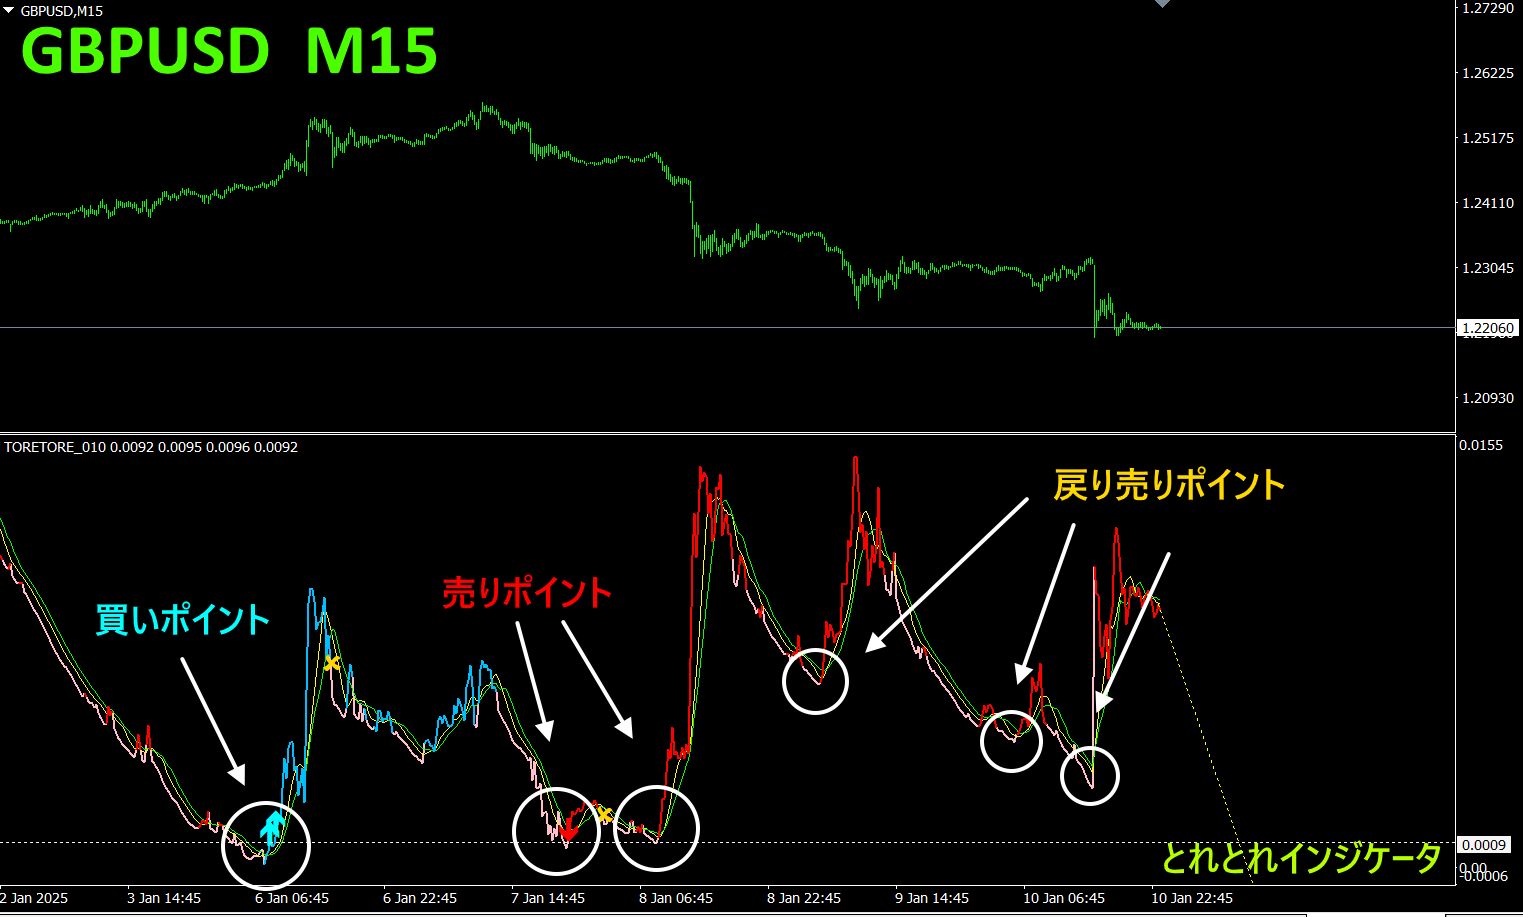
The “Toretore Indicator” is a versatile indicator that can be used in various places. The following are application examples. The currency pair isGBPUSD and the chart is15 minutes.
With the “Toretore Indicator,” you can clearly see where to buy and where to sell. It also tells you the “pullback sell point.” It also allows you to avoid trading in other areas, so you can minimize unnecessary trades.
5. Recommended indicators
“Toretore Indicator”
https://www.gogojungle.co.jp/tools/indicators/50115
“TrendLine-EX”
https://www.gogojungle.co.jp/tools/indicators/42257

“8C Currency Strength Visualization Indicator” please refer to the following page.

MT4 version https://www.gogojungle.co.jp/tools/indicators/39150
version https://www.gogojungle.co.jp/tools/indicators/39159
【Products I have on sale】


