

Utilization of the "Visualizing Indicators" (Part 180)
"Visualization Indicator" utilization (its180)
1. evolve the "28 Currency Pairs List Indicator" into an indicator
"8CPVisualization Indicator"to draw.
The "8CPVisualization Indicator" includesOceania version,London version,NewYork version,AnyCP version. This time, I used theOceania version.
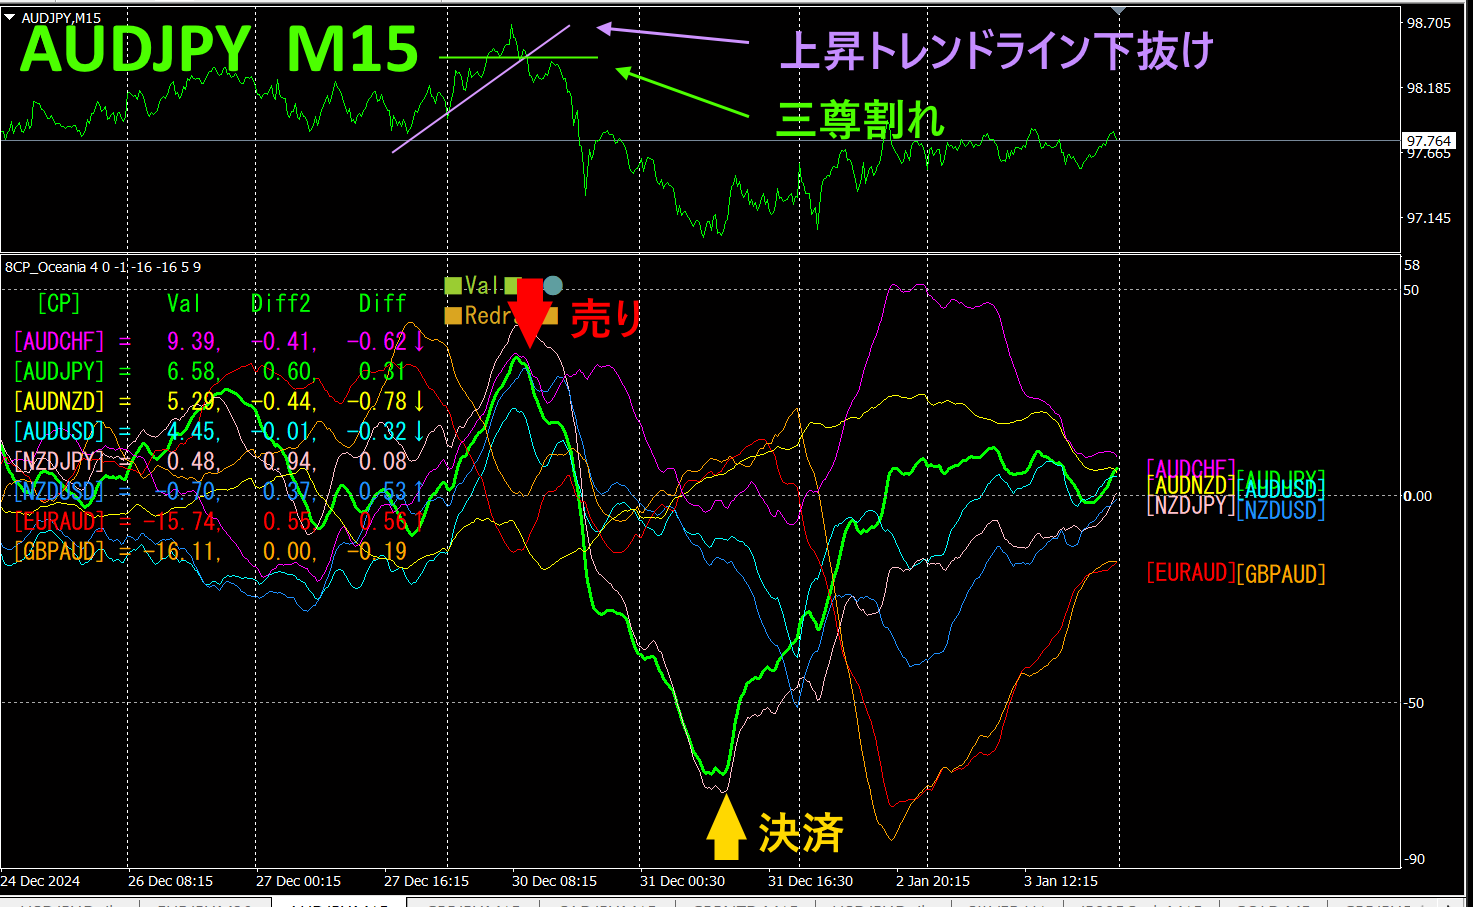
The top half is theAUDJPY 15-minute chart. The bottom half is from the “8CP Visualization Indicator”, where the green thick line graph corresponds toAUDJPY.
I drew a green horizontal line and a purple rising trendline on the AUDJPY chart. The point where the green horizontal line breaks below the three-crown top and the purple rising trendline breaks below are almost the same, so from here I will sellAUDJPY. The settlement is at the point where the indicator chart bottoms out and reverses, yielding about130pips of profit.
During year-end and New Year, markets are often quiet, but this was a solid gain. Generally, around Christmas and New Year, I believe it is better not to trade and to conduct backtesting and data analysis instead.
If you use theTrendLine-EX, you can automate entries and settlements by breaking diagonal trendlines. You can leave it as is, enabling easy trading. TheTrendLine-EX is a semi-automatic EA that can short when the trendline is broken below and automatically settle when the trendline is broken above.
2. Best SelectTry the indicator
The chart below shows2024 year12 month31 day00:42JST) Screenshot.
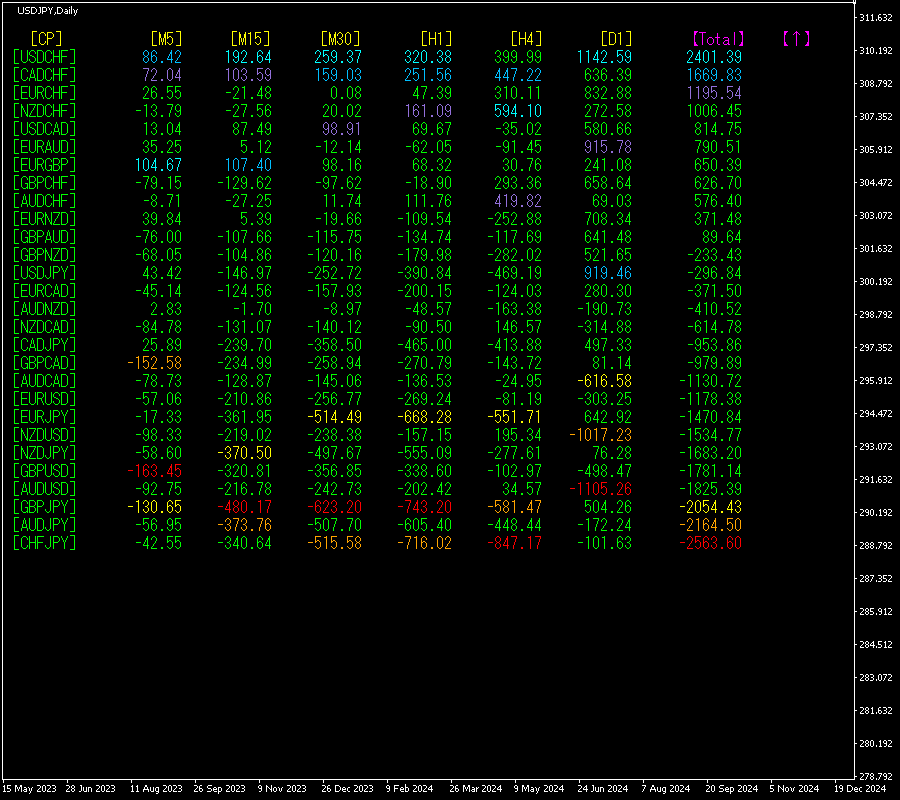
[Total]Numerical values are in descending order. At the very top,USDCHF is blue across all timeframes except [H4].Total value is2401.39, a positive number. This suggests an upward trend forUSDCHF.
Now, let's look at the USDCHF chart.
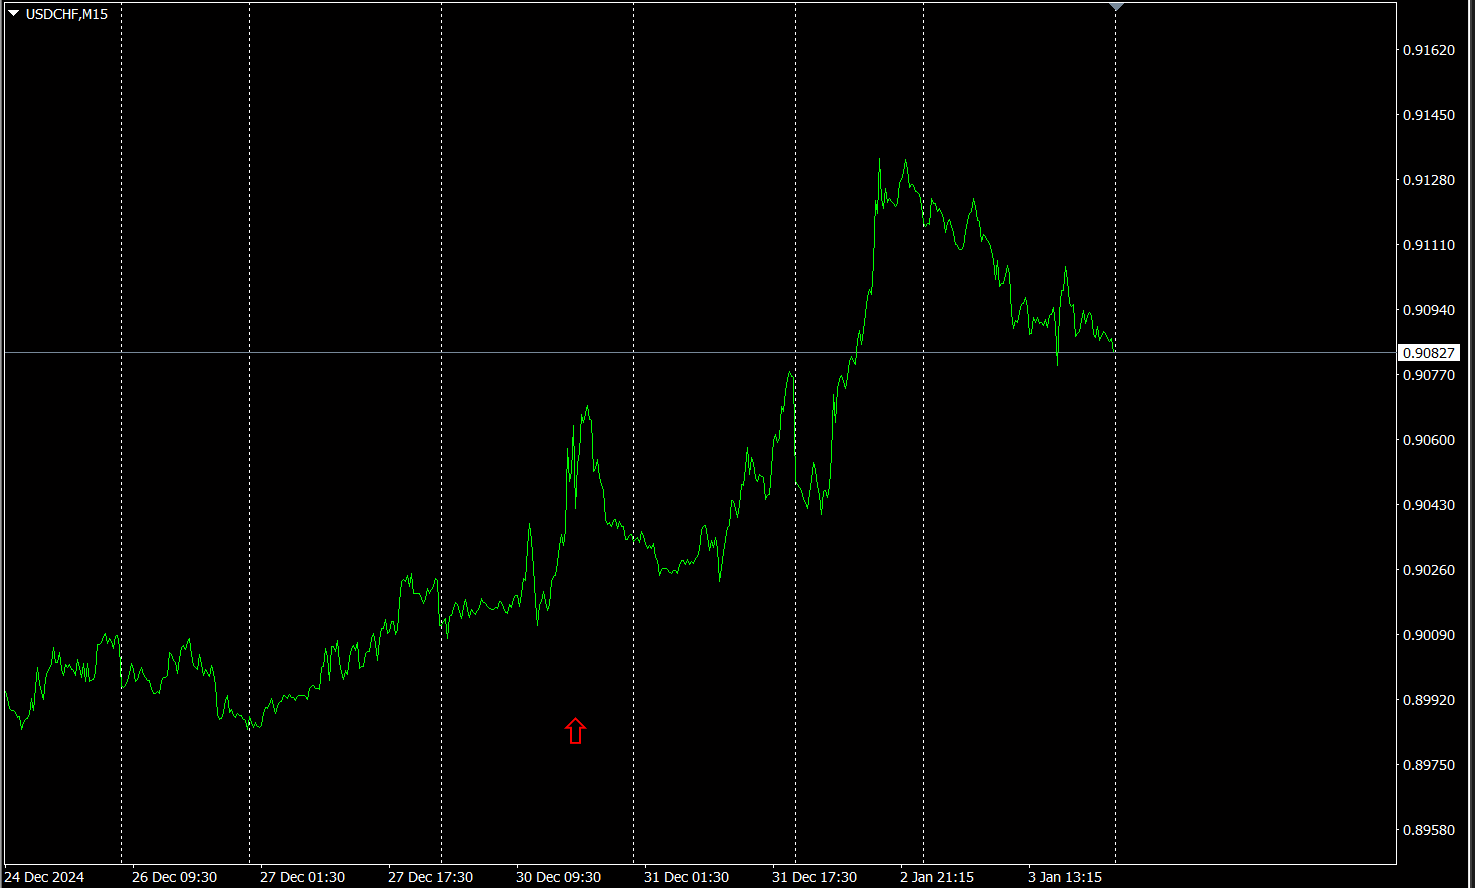
The red arrows indicate the snapshot location, capturing the upward trend portion.
“28 Currency PairsBest Select
“28 Currency PairsBest Select indicator

https://www.gogojungle.co.jp/tools/indicators/35128
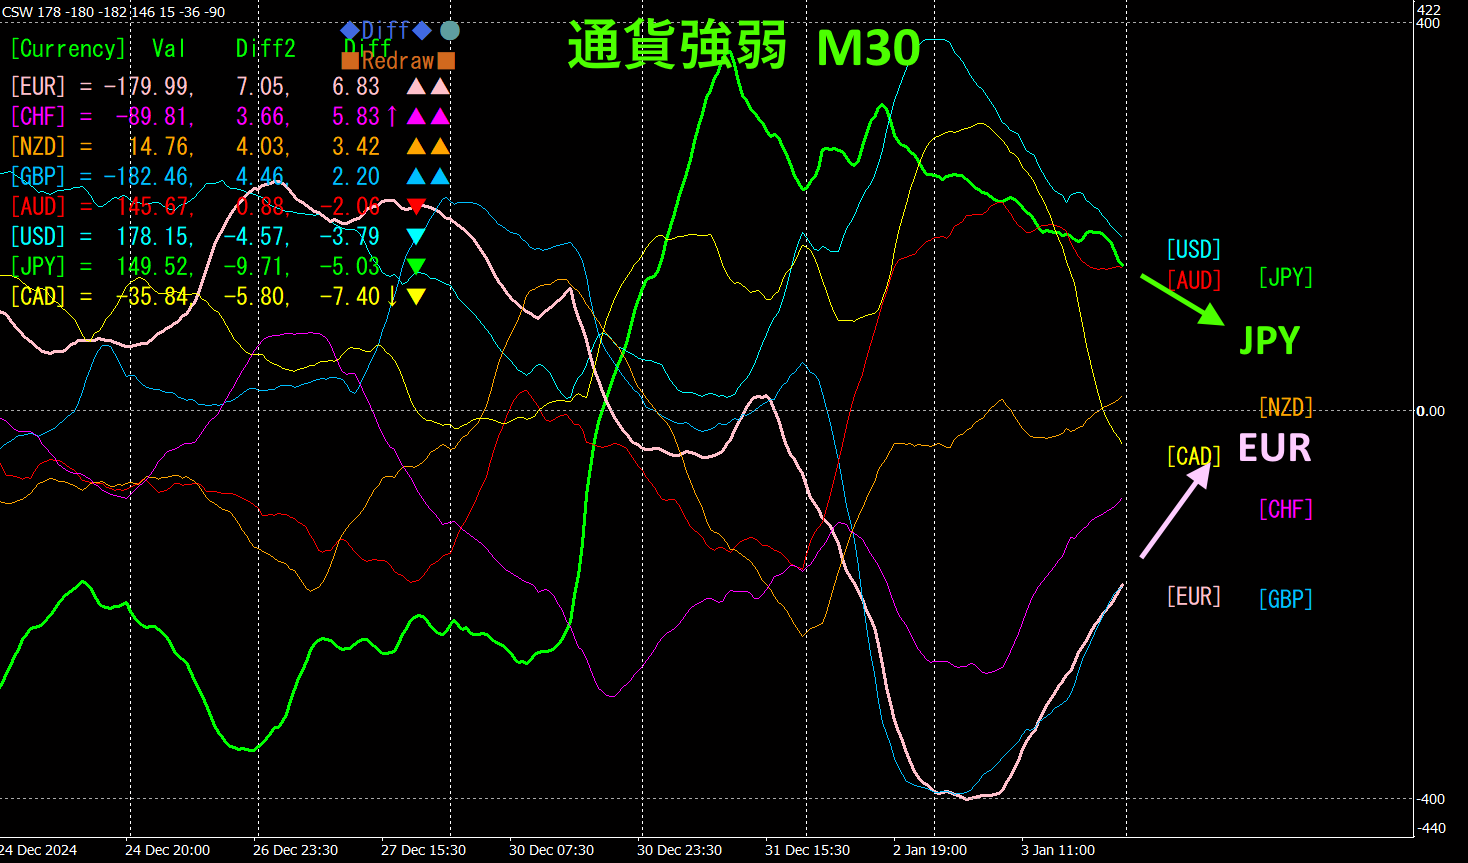
3. 2021 year5 month to monitorEURJPY movement?
year5 month fromEURJPY movement is being tracked.
To see the overall trend, a30 minute chart covering roughly3 weeks is drawn.
Last time, I wrote the following.
Pink isEUR, green isJPY. SinceEUR is down andJPY is up, going forward,EURJPY is expected to move slightly downward.
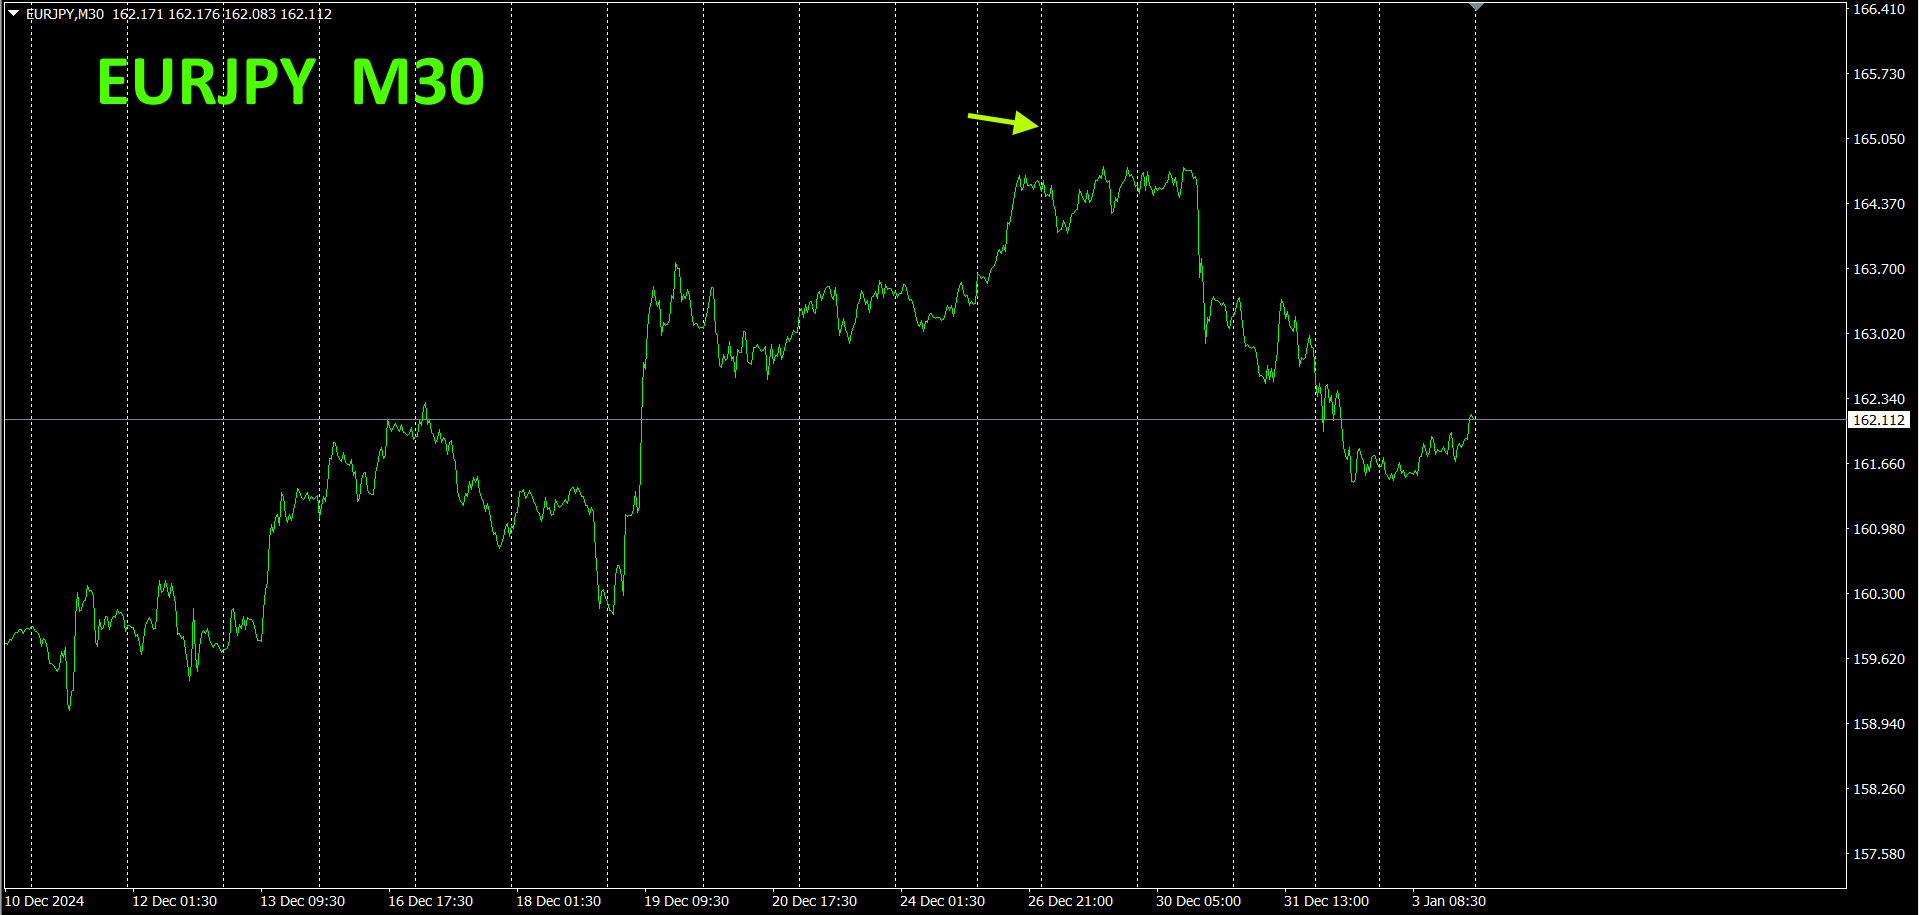
As expected, after hitting resistance, it moved downward.
30 minute currency strength chart.
Pink isEUR, green isJPY. They form large wave patterns, withEUR rising andJPY falling, so going forward,EURJPY is clearly expected to rise.
4. Using the "Toretore Indicator"
The "Toretore Indicator" is a versatile indicator that can be used in various contexts. The following are application examples of the "Toretore Indicator". The currency pair isEURJPY and the chart is30 minutes.
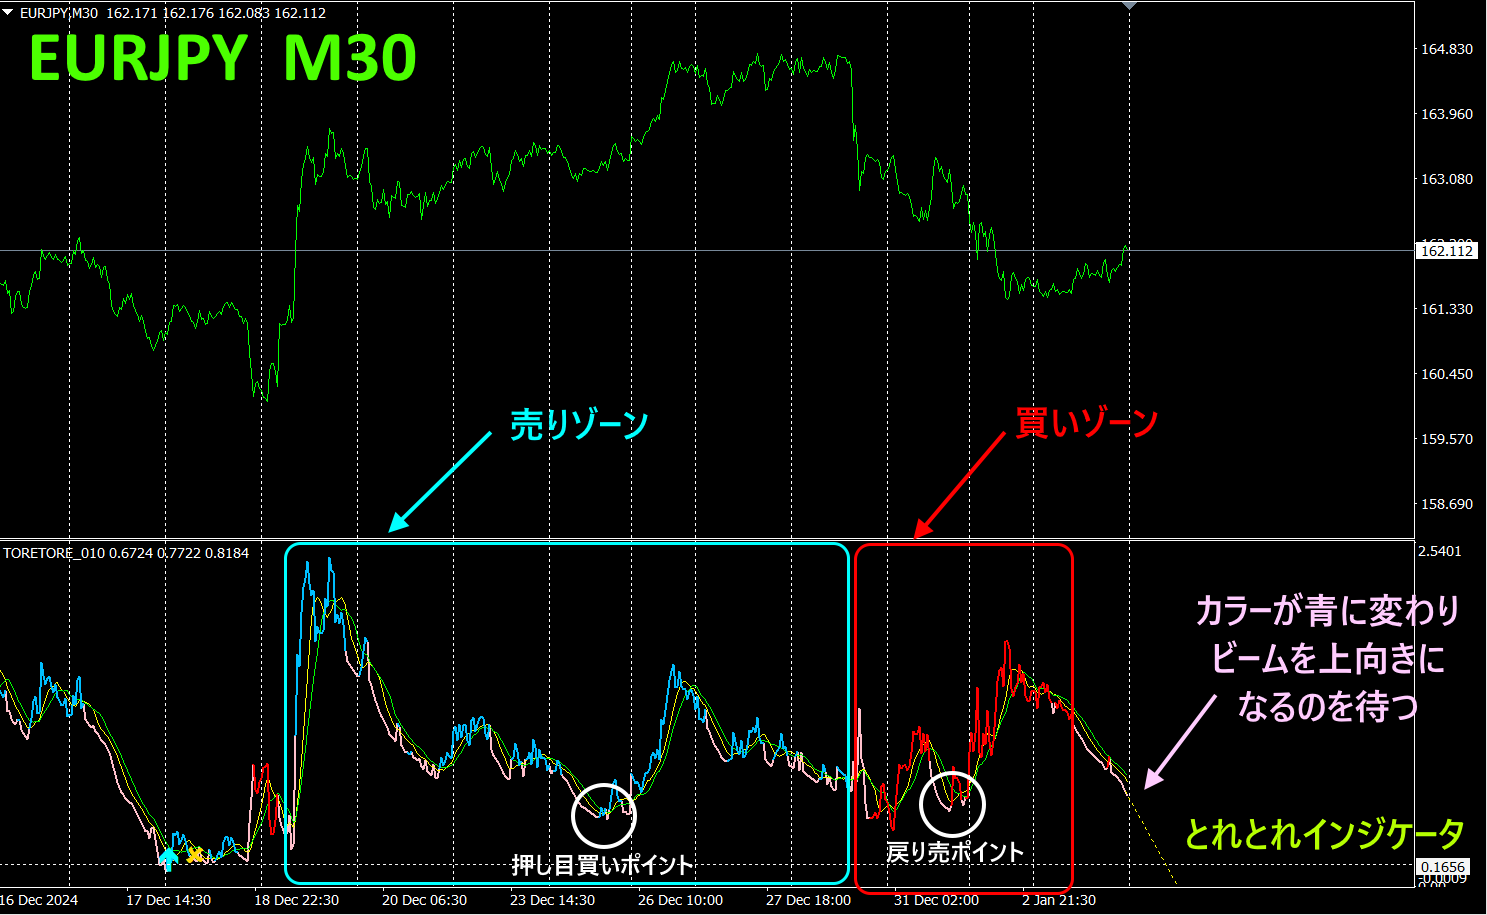
If you have the "Toretore Indicator," zones colored blue indicate "buy" and zones colored red indicate "sell." When the price approaches the baseline and reverses, it becomes an excellent point for buying dips or selling rallies. When the main line nears the bottom and the color changes from pink to blue and the beams move upward, you open new long positions. This can also be used to simply wait for trades."Wait".
5. Recommended indicators
"Toretore Indicator"
https://www.gogojungle.co.jp/tools/indicators/50115
"TrendLine-EX"

https://www.gogojungle.co.jp/tools/indicators/42257
"8C Currency Strength Visualization Indicator" please refer to the following page.
MT4 version https://www.gogojungle.co.jp/tools/indicators/39150
MT5 version https://www.gogojungle.co.jp/tools/indicators/39159
【My listed products】


