

Usage of "Visualization Indicators" (Part 179)
“Visibility Indicator” utilization (part179)”
1. Further develop the “28 Currency Pair List Indicator” into an indicator
“8CPVisibility Indicator”to plotUSDJPY.
The “8CPVisibility Indicator” includesOceania版,London版,NewYork版,AnyCP版. This time, I used theLondon版.
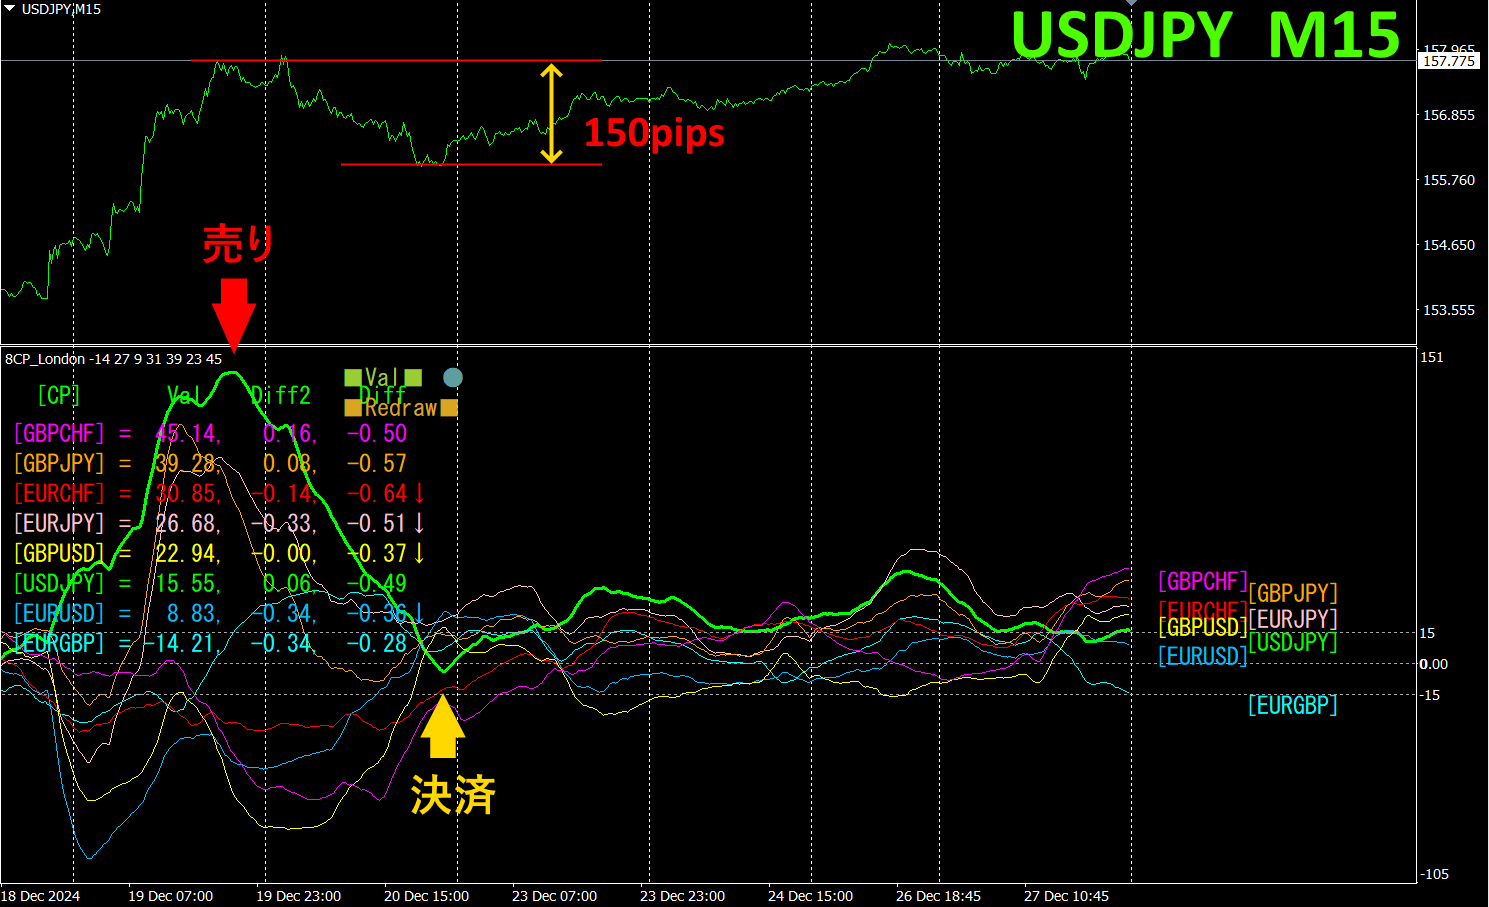
The top half is theUSDJPY 15-minute chart. The bottom half is from the “8CPVisibility Indicator”; the green thick line representsUSDJPY.
With the indicator, sell when the USDJPY chart begins to retreat from a peak and close at the bottom. About150pips profit was obtained.
Last week was a “Christmas market” with almost no price movement. Around Christmas, one option isnot to trade. There is no need to force trades during periods of low volatility.
If you use the “TrendLine-EX” you can automate entries and exits by breaking diagonally through trend lines. It becomes an easy trade by leaving it as is. The “TrendLine-EX is a semi-automatic Expert Advisor (EA) that sells automatically when the trend line is broken downward and automatically closes when the trend line is broken upward.
2. Best SelectIndicator to try
The figure below is a screenshot taken on2024 year12 month26 day23:42(JST)
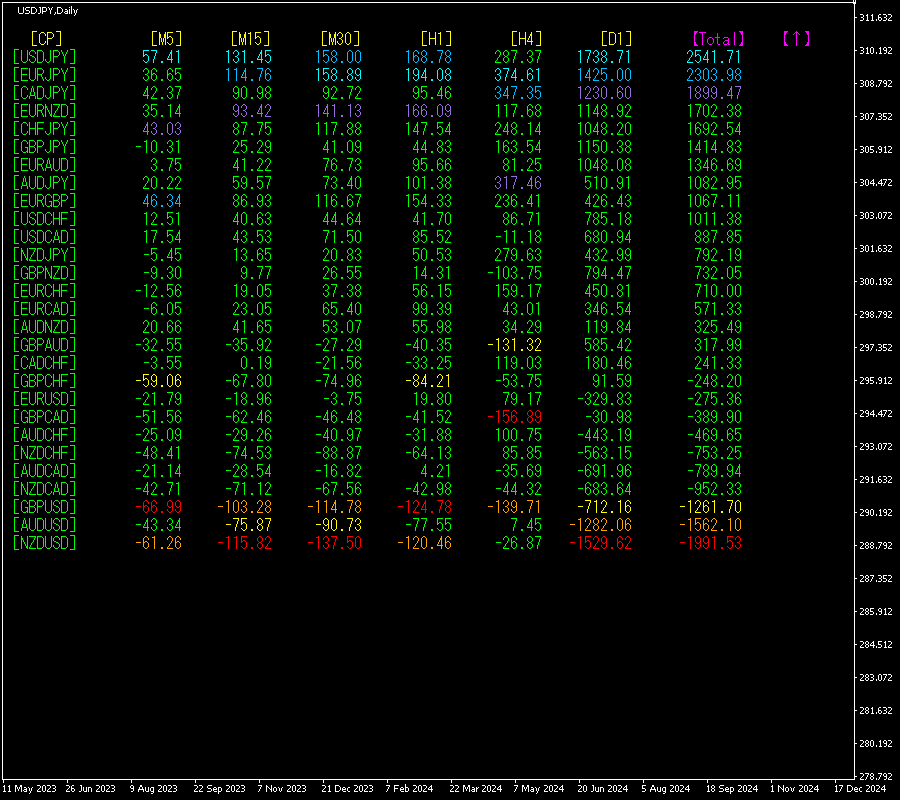
[Total]Numbers are arranged in descending order. The top item,USDJPY, shows blue color on all timeframes.Total value is2541.71, a positive figure.USDJPY indicates an upward trend is present.
Now, let’s look at the USDJPY chart.
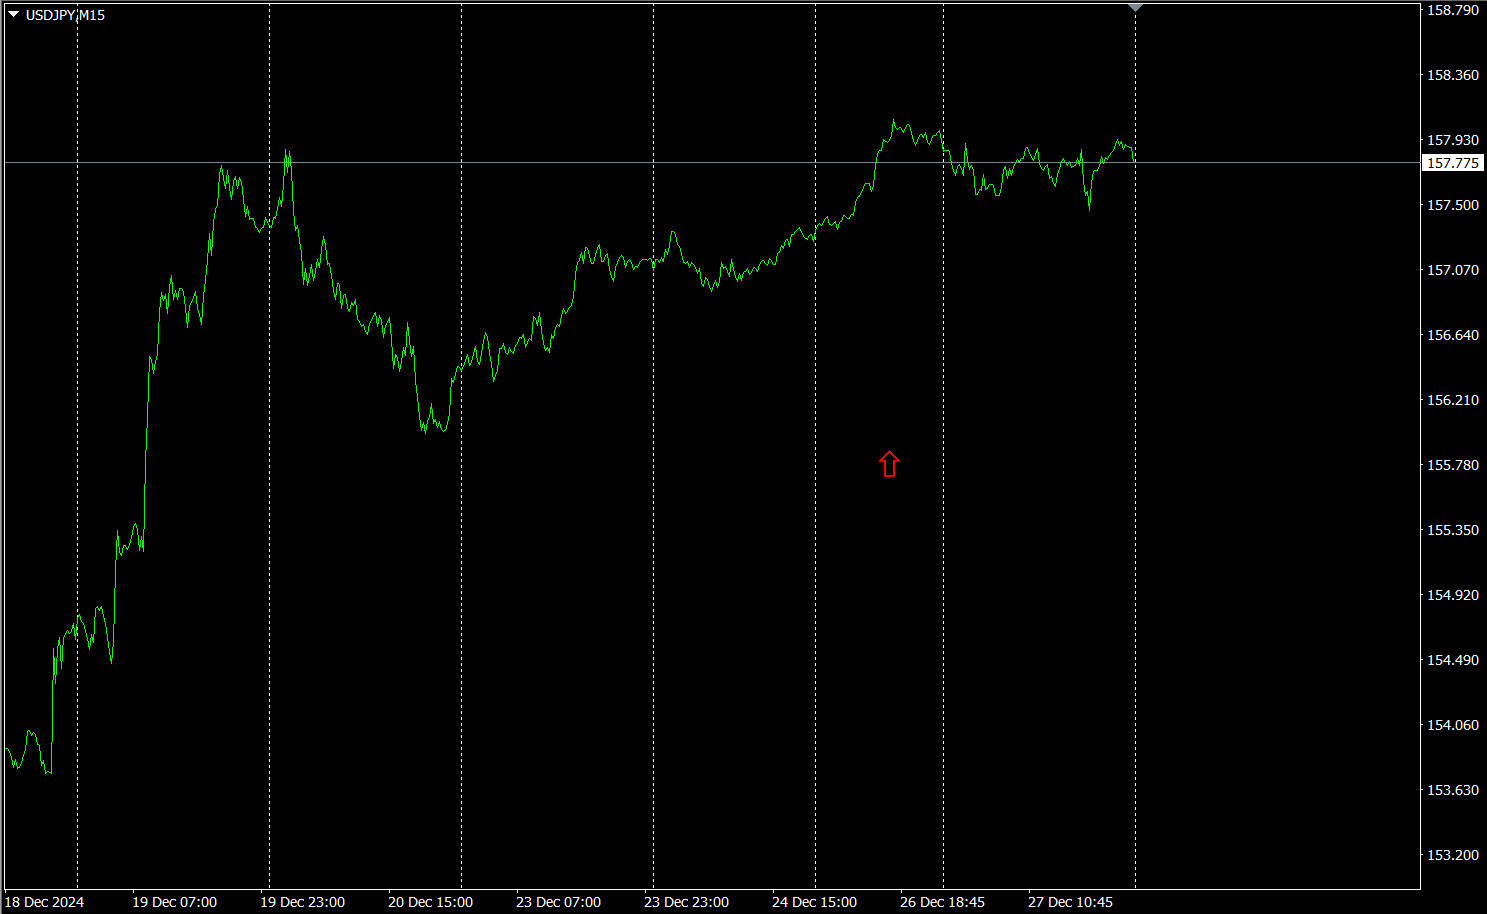
The red arrows indicate where the screenshot was taken. It captures the rising trend segment.
“28 currency pairs Best Select Indicator” enables easy identification of which currency among 28 pairs is exhibiting the strongest trend. It also tells you, by number and color, whether you should trade now. It’s an excellent indicator for assessing all currency pairs at a glance.
“28 currency pairs Best Select

https://www.gogojungle.co.jp/tools/indicators/35128
3. 2021 year5 month onward, how has EURJPY moved?
2021 year5 month onward,
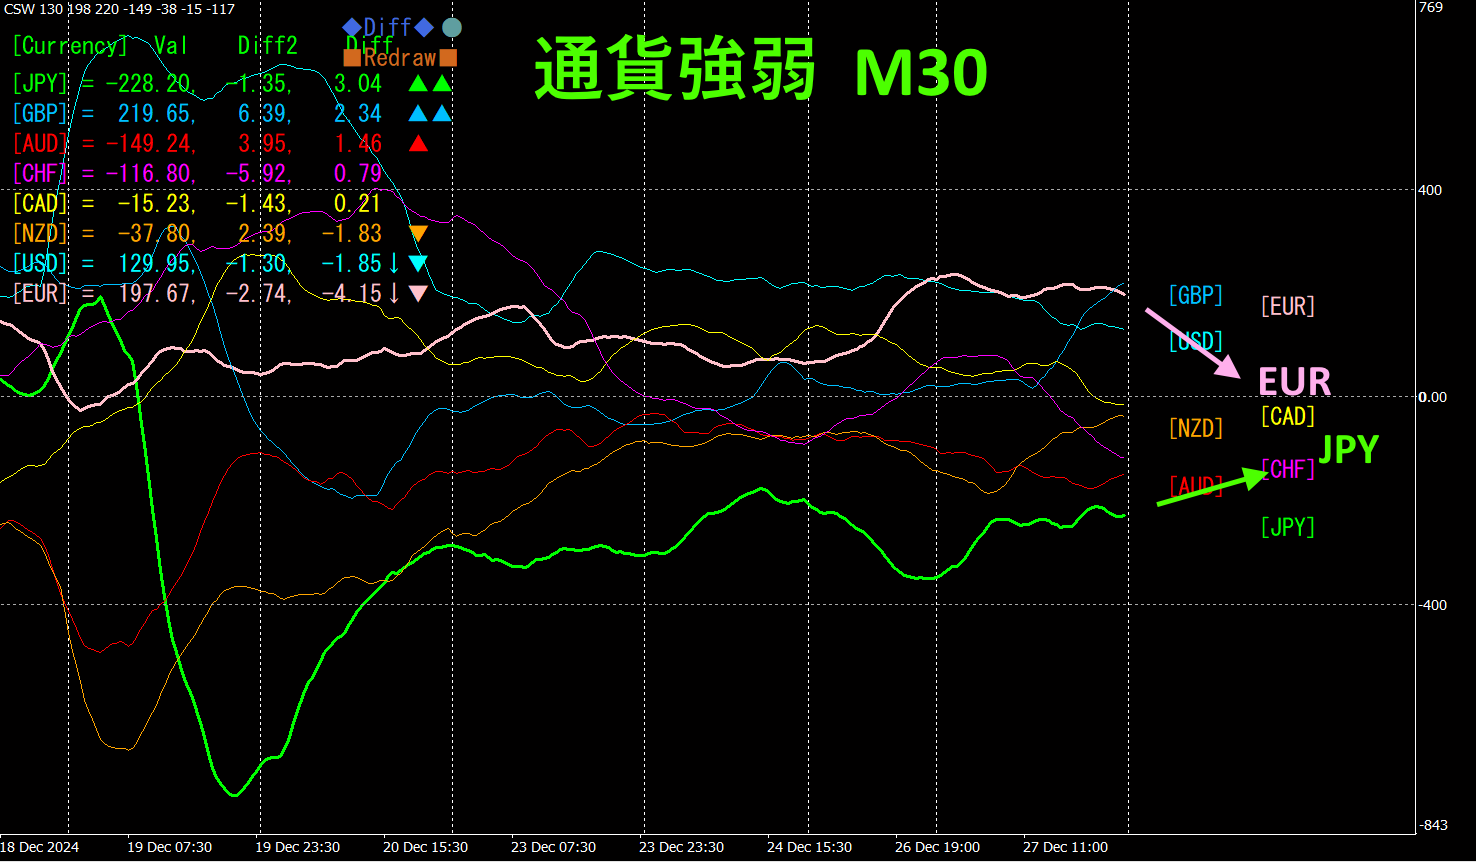
To see the overall trend, a30‑minute chart showing roughly the last3 weeks is drawn.
Last time I wrote the following.
Currently,JPY andEUR are both tilted upward with similar angles, but theEUR angle is larger than that ofJPY. In terms of currency strength, EUR>JPY remains, soEURJPY is expected to continue a gradual rise.
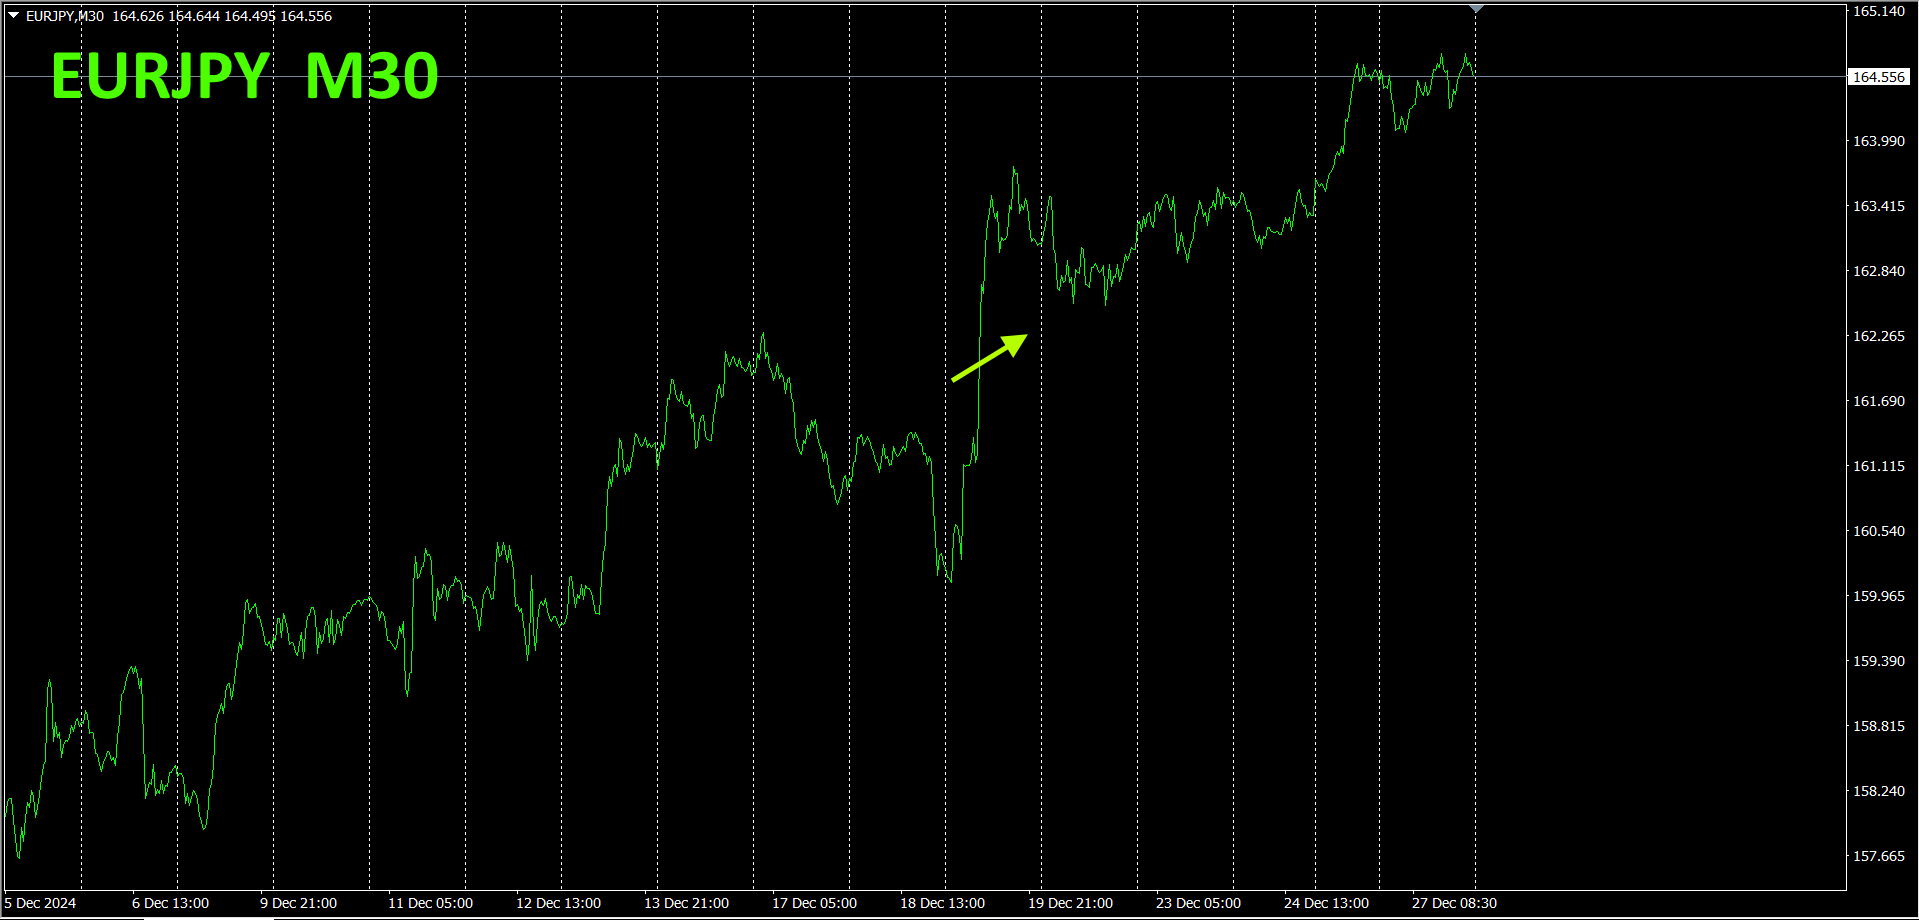
As expected, the upward trend continues.
30‑minute currency strength chart.
Pink isEUR, green isJPY.JPY is moving upward, soEURJPY
4.
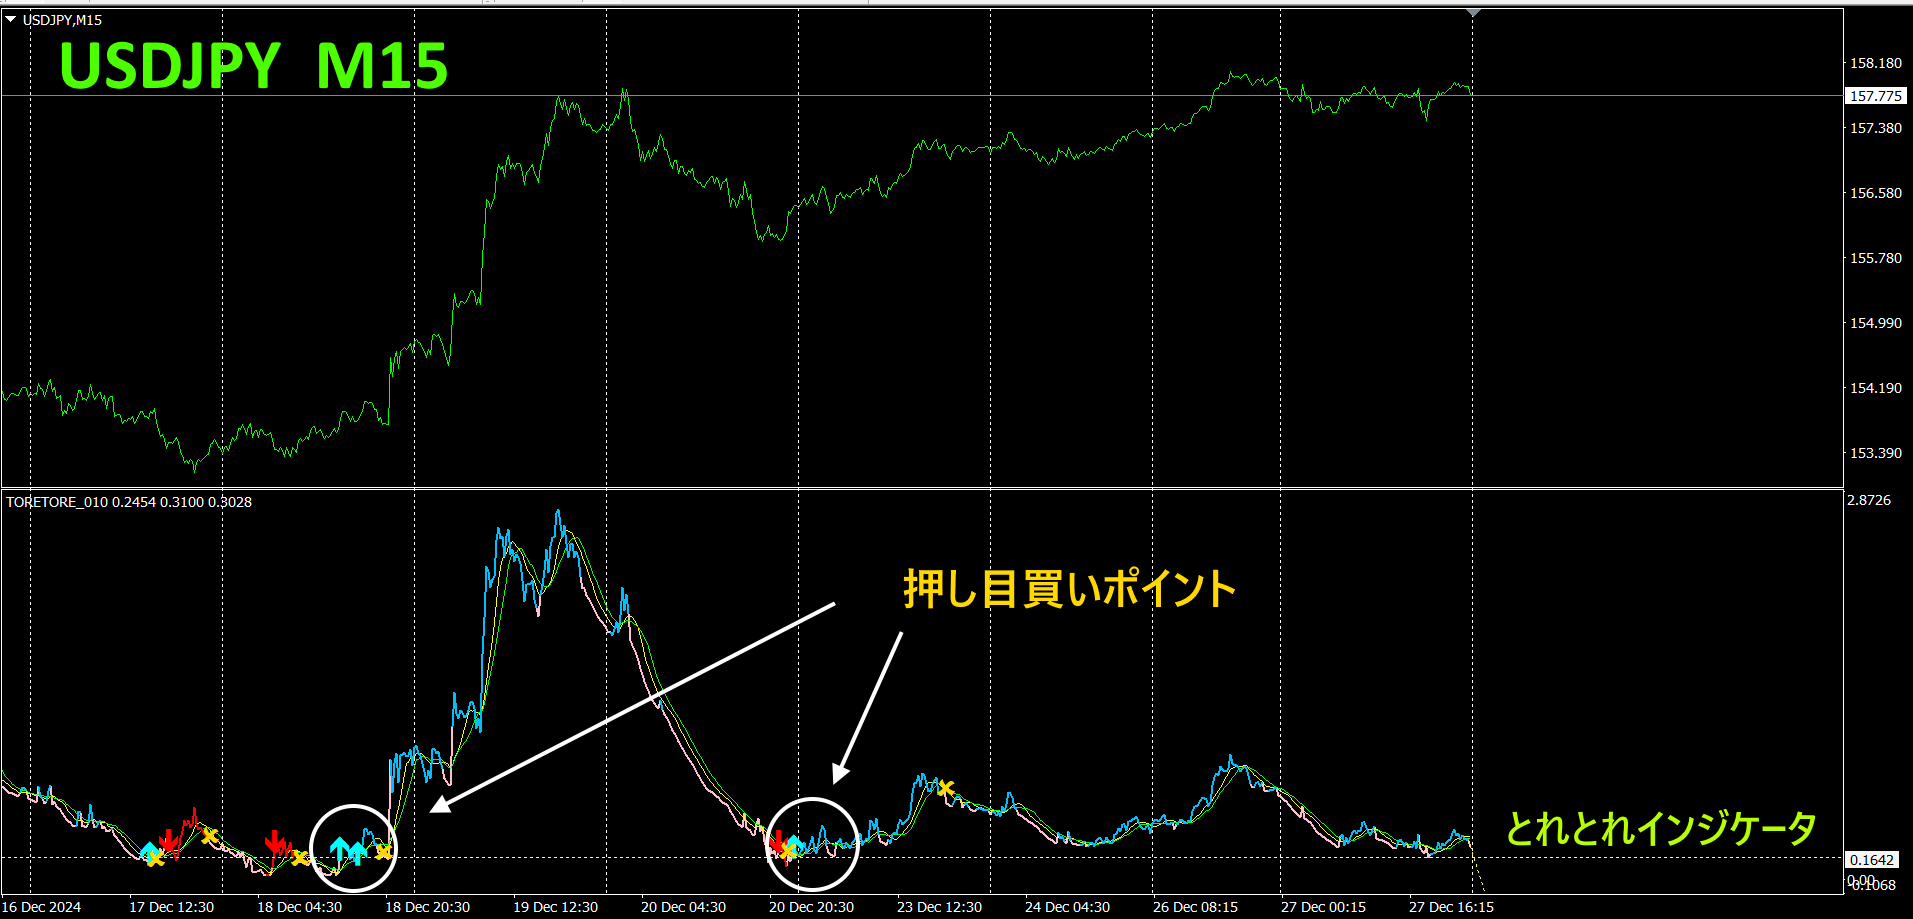
The “Tore Tore Indicator” is a versatile indicator that can be used in many places. The following are applications of the “Tore Tore Indicator.” The currency pair isUSDJPY and the chart is15 minutes.
The main line of the “Tore Tore Indicator” is near the bottom, and the color changes from pink to blue, with an upward arrow sign appearing at the point (circled in white in the figure above), which is an excellent dip-buying point. In other places, simply refrain from trading to avoid unnecessary entries.
5. Recommended indicators
“Tore Tore Indicator”
https://www.gogojungle.co.jp/tools/indicators/50115
“”

“8C currency strength visibility indicator” please refer to the following page.

MT4 version https://www.gogojungle.co.jp/tools/indicators/39150
MT5 version https://www.gogojungle.co.jp/tools/indicators/39159
【My listed products】


