
【Umaku-tore-ru】vol.3 Types of Technical Analysis (RSI)
How to Find Free Public Entry Points
Here are the basic methods for stock trading
Here are premium-grade trading techniques
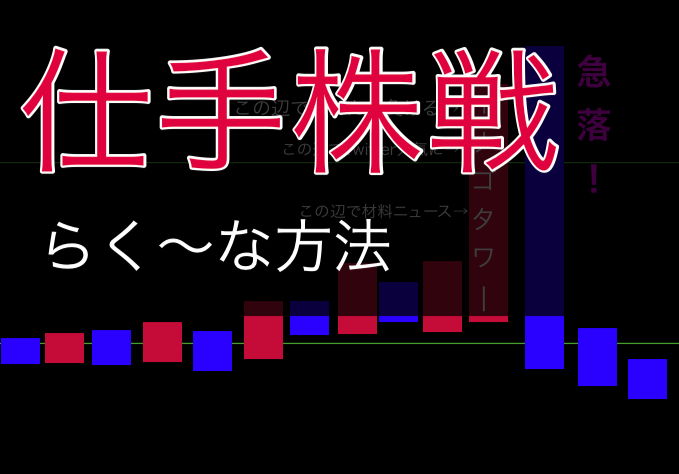
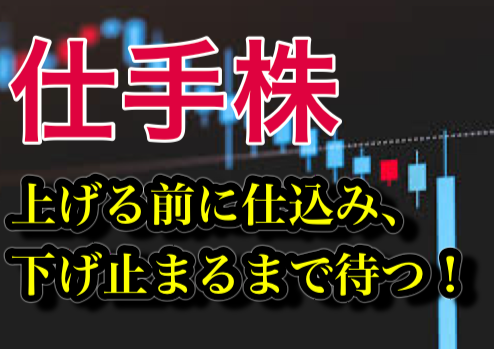
How to target rapid surges with quirky stocks that move in a manipulative way
Delivering techniques, market conditions, and fundamentals
A newsletter that will surely be useful.
Japan Stock Trading Essentials
When you start trading, everyone runs into this technical analysis.
On multiple monitors, you see charts and stock price screens that look cool and seem quite difficult.
For professional traders
“The meanings of various indicators hidden in the trading environment”
If you learn about them,
“If it’s this or that, I can understand it too!”
and you will surely gain confidence from trading knowledge.
About RSI
Here, we introduce the names of various functions that form the basics of technical analysis, and the roles and meanings of those indicators.
What is RSI?
RSI is an oscillator-type technical analysis indicator developed in 1978 by U.S. market analyst J.W. Wilder.
What is an Oscillator?
When looking at price charts, it measures overbought and oversold conditions and is used to predict reversal points.
RSI stands for Relative Strength Index.
The reading is pronounced “R-S-I.”
When you’re just starting to learn technicals, terms like these can be hard to grasp, but once you memorize them, RSI appears frequently.
It is an index that graphs how much the price has moved up and down over a certain period.
That graph serves as a basis for judging whether the asset is overbought or oversold.
A high RSI is a sell signal, a low RSI is a buy signal.
By combining with other indicators, you can improve your win rate.
The RSI value always ranges between 0 and 100. You can interpret around 50% as a center, with higher values indicating a sell signal and lower values a buy signal.
Three common RSI trading signals:
(1) Sell signal at 80% or higher, buy signal at 20% or lower (2) Sell signal at 75% or higher, buy signal at 25% or lower (3) Sell signal at 70% or higher, buy signal at 30% or lower RSI shifts when you change the period setting.
In a 5-minute chart it may be rising, but on a daily or weekly chart it may be falling.
When using RSI, adjust to your trading style.
Generally, looking at longer timeframes like weekly charts reduces false signals.
Actual trading screen using MT4
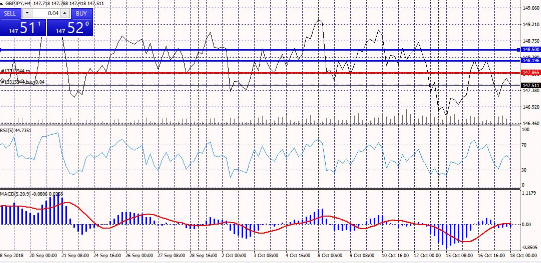
The image above shows a pound-yen chart on MT4 with MACD and RSI technical analysis overlaid.
From top to bottom: (1) line chart (2) RSI trend (3) MACD trend
MACD and RSI give the same buy/sell signals (when MACD is a buy, RSI is also a buy) and trades are placed accordingly.
RSI below 50 around 20–30, and MACD has risen from a downward trough to touch the middle zero line.
First, on the (1) line chart, support and resistance lines are drawn.
There are blue lines (sell signals) and red lines (buy signals), and there is also a blue line in the middle.
The middle blue line marks a point within the box center that is “a point traders pay attention to” for buying and selling.
Here, it is a point where it is easy to place a partial close or hedge when making small takes profit.
When hedging, you divide your usual position size by half for each side.
However, if you recently touched this line and fell, it’s unclear whether it will break through.
This point is often a place where selling is anticipated.
In this image, the middle blue line doesn’t break upward all at once, but it moves about one grid downward.
Trend markets may be missed, butfor people who prefer stable investing, this one-grid is a valuable investment guideline.
The top blue line is a breakout if it penetratesand can rise higher.
Both a wealthy trader friend and someone who exited have bought at this point.
What they have in common is that they trade more currency than their funds to take on risk in a trending market, but the difference is whether they endure a stop-loss or not.
However, if that breakout turns out to be a “false breakout,”
“that point is a selling point if it gets this far”
and is also a place to be mindful of,often leading to further decline.
The pound is known as a “killer currency” and moves several yen when it makes a big move, so be prepared to use a stop-loss or trade in smaller lot sizes (or with large capital) to accommodate potential direction changes.
Generally, even after a breakout, prices tend to retrace back to the red-line point, as this image shows.
Therefore, you don’t make large take-profit orders here, but many people decide to hold a short position by selling for a lower price.
If it breaks higher, you wait with a small position size to hold on.
When it falls back and the red line returns, it is considered a buy signal.
If the price is falling from the top and breaks through the red line as it drops, it is a sell signal, but some false signals may occur.
※ If you don’t understand clearly, you should observe for a while.