

Equipped with Ichimoku Cloud and Review
This product is OK with just the main signal, but by confirming it in conjunction with other indicators you can trade with a solid basis.
This time we will explain from today's situation and verify it with an image that combines the Ichimoku Kinko Hyo (standard on MT4).
When the Slope line parameter is the default 80
The GMMA shown in the image above is not displayed using the button in the upper left.
It would be hard to understand if it is mixed in.
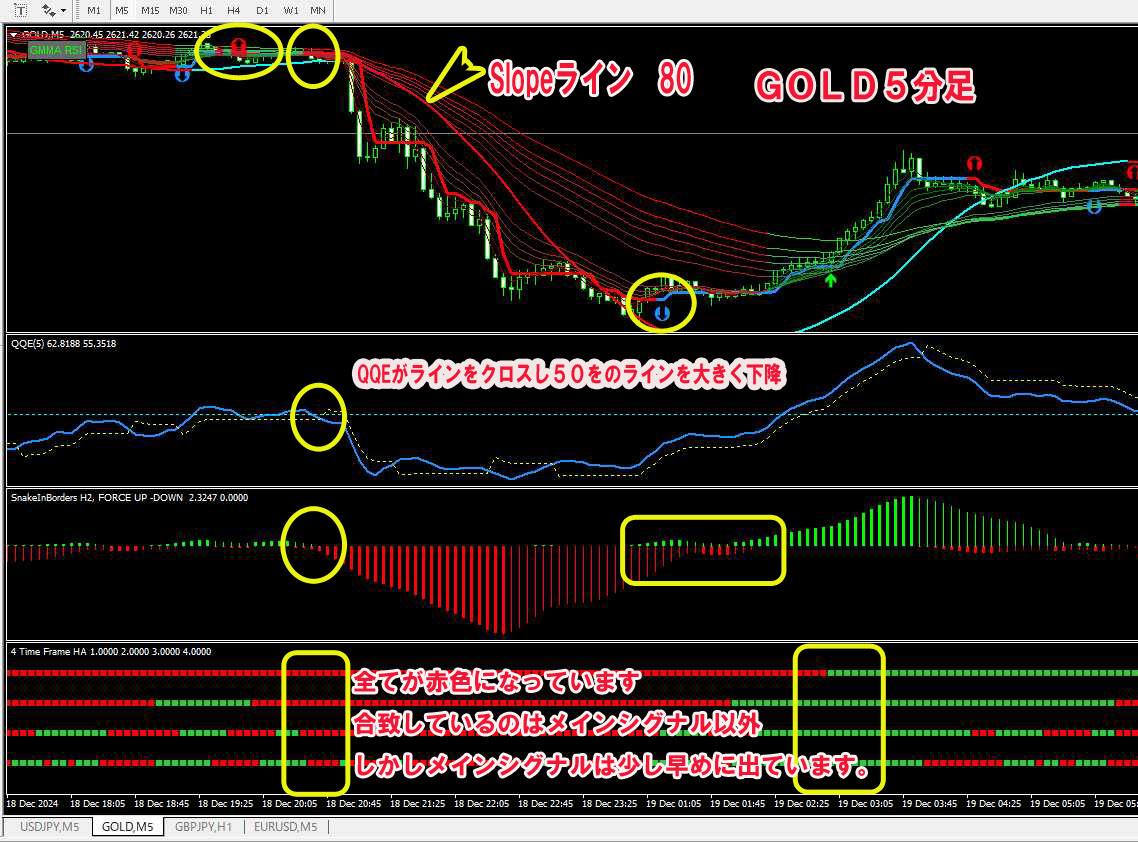
The main chart’s Slope line parameter remains at the default 80.
From the Slope line, you can see that the main chart’s trigger signal is giving a selling signal.
It would be okay to take a position here, but the Slope line slowly turns red and declines.
Also, the sub-chart at this point is creating a declining condition.
If you want to take a large gain, you would enter at the first selling signal, but if you want to be sure that all conditions are met, it is most reliable to enter where all the conditions within the yellow box in the above image align.
At the moment of deciding whether to enter or not, the future state is not yet visible.
This figure shows the overall picture up to the future, butwhether the future will look like this at the time of entry is still unknown.
In conclusionEven if a triggering signal appears, wait a bit and position yourself only after all conditions are met.This is what it means.
Before the entry signal appears
At the beginning (left side) of the image above, three signals appear, but Sneke (second from the bottom) and QQE run parallel near the 50 line.
What matters is that the Slope line is close to the candlesticks and barely separated.
Since signals appear, trading exactly according to this signal will not yield profit. On the contrary, the spread may become negative, or at best not rise much (in this case not very large negative gain).
You might make a little profit,but no trader can predict the future with 100% accuracy, so even professionals cannot guarantee a perfect trade.
Even if you take a position according to the signal, a reverse signal (buying in but a selling signal lights up) will appear soon, so you should close then.
As a resulttrading according to the signalmay incur some losses in ranging (sideways) markets, but major losses are not likely.
Overall, you should end up positive.
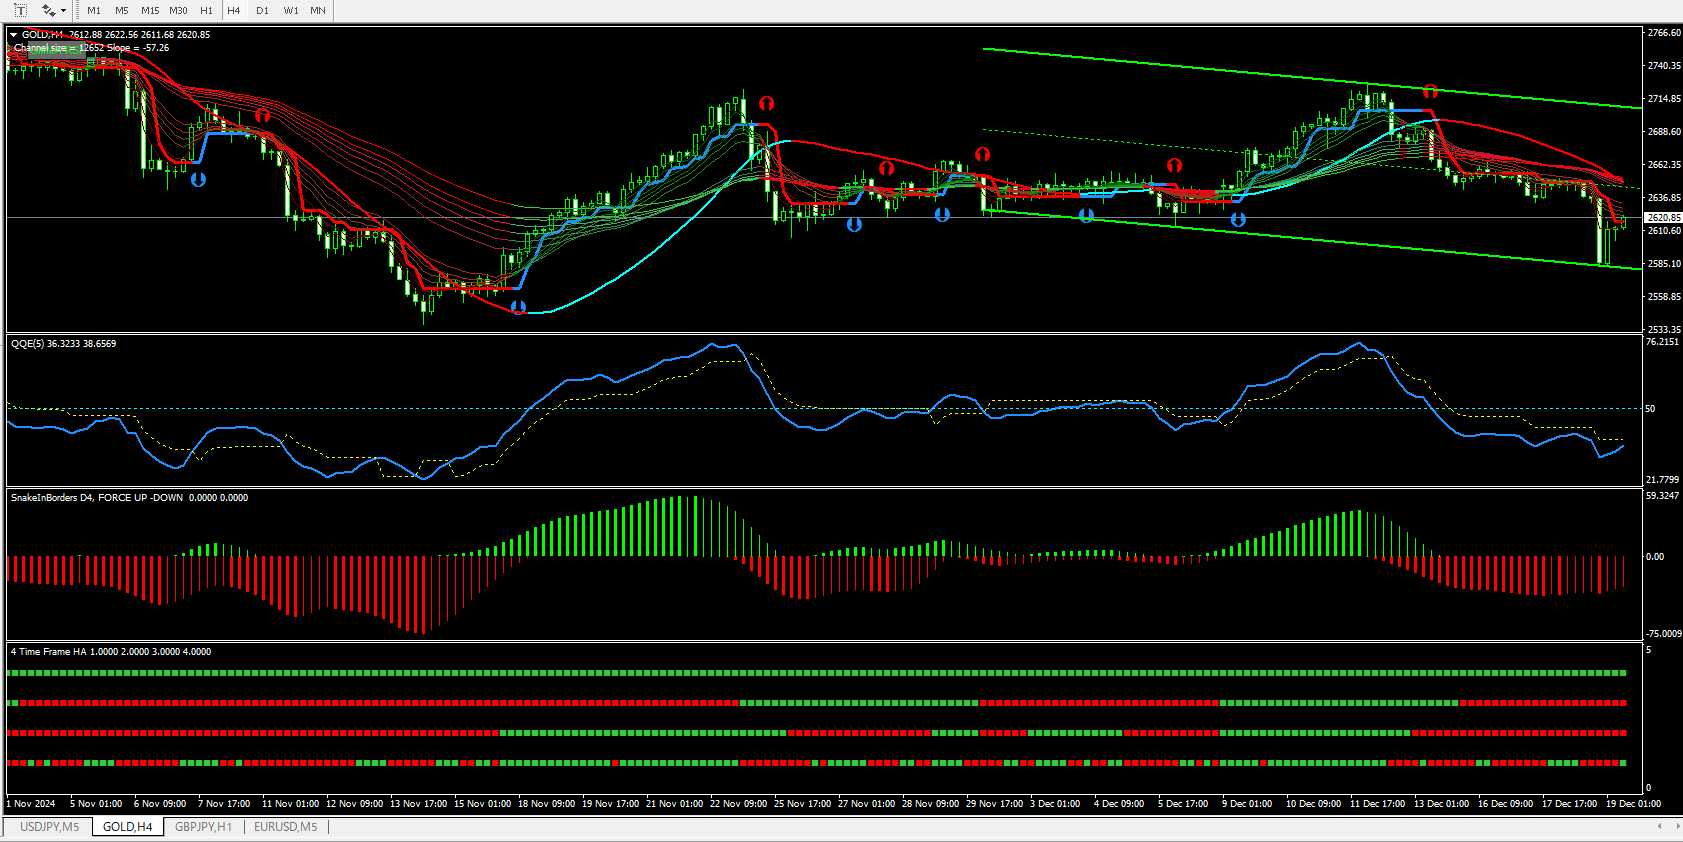
The above figure isthe 4-hour chart.The end corresponds to the 5-minute chart.
A channel line is drawn. (It is in a downward trend.)
The Slope line parameter is set to 40.
It gets closer to the candlesticks and is nearer at the time of signal generation.
When the Slope line parameter is 40
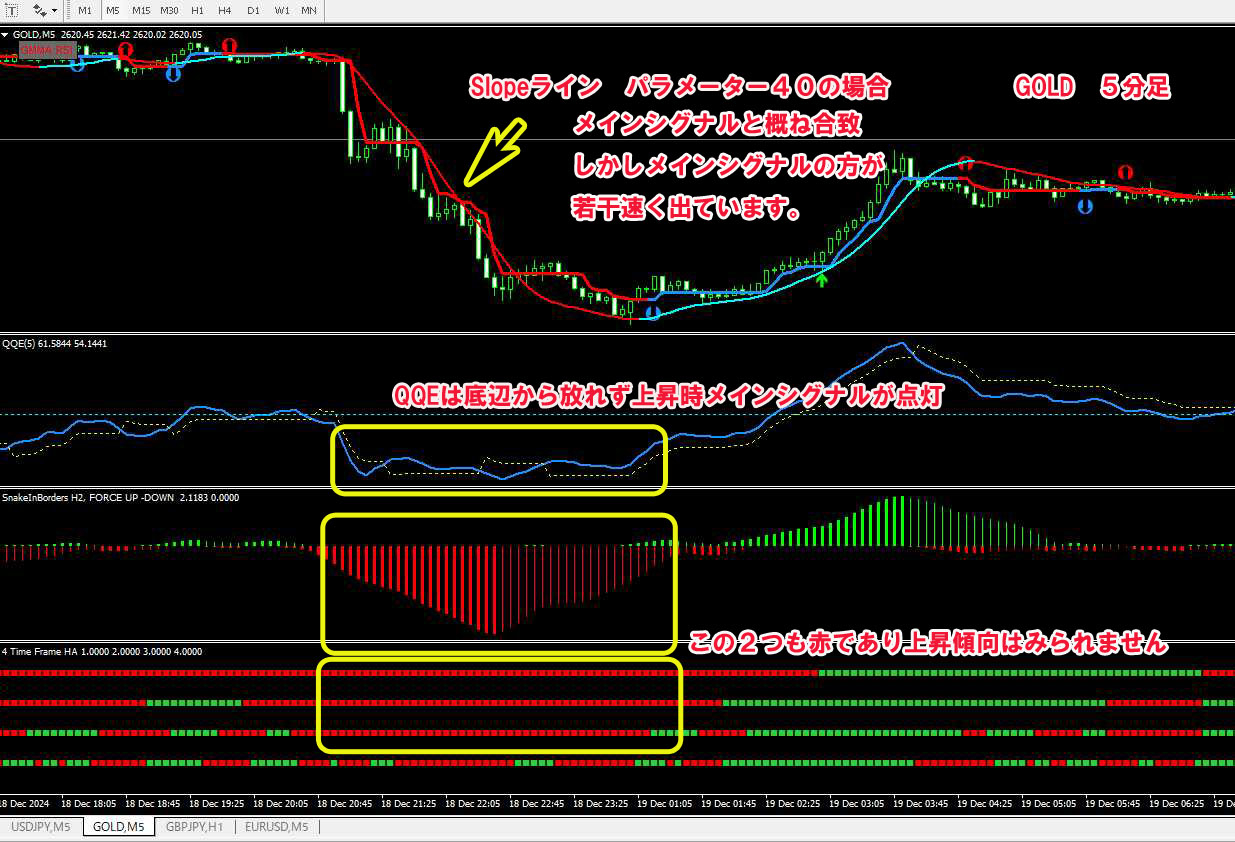
Setting the parameter to 40 rather than 80 brings it closer to the candlesticks and closer to the main signal formation.
When a buy signal for closing the position lights up, almost all of the Slope line changes from red to blue at the same timing as the upward movement.
Therefore, after the first main signal lights up, the Slope line changes to red a little later and declines, so based on the fact that the main signal is lit, entering at the moment the Slope line turns red may be okay.
QQE also breaks the line, and other indicators are turning downward.
When Ichimoku Kinko Hyo is combined
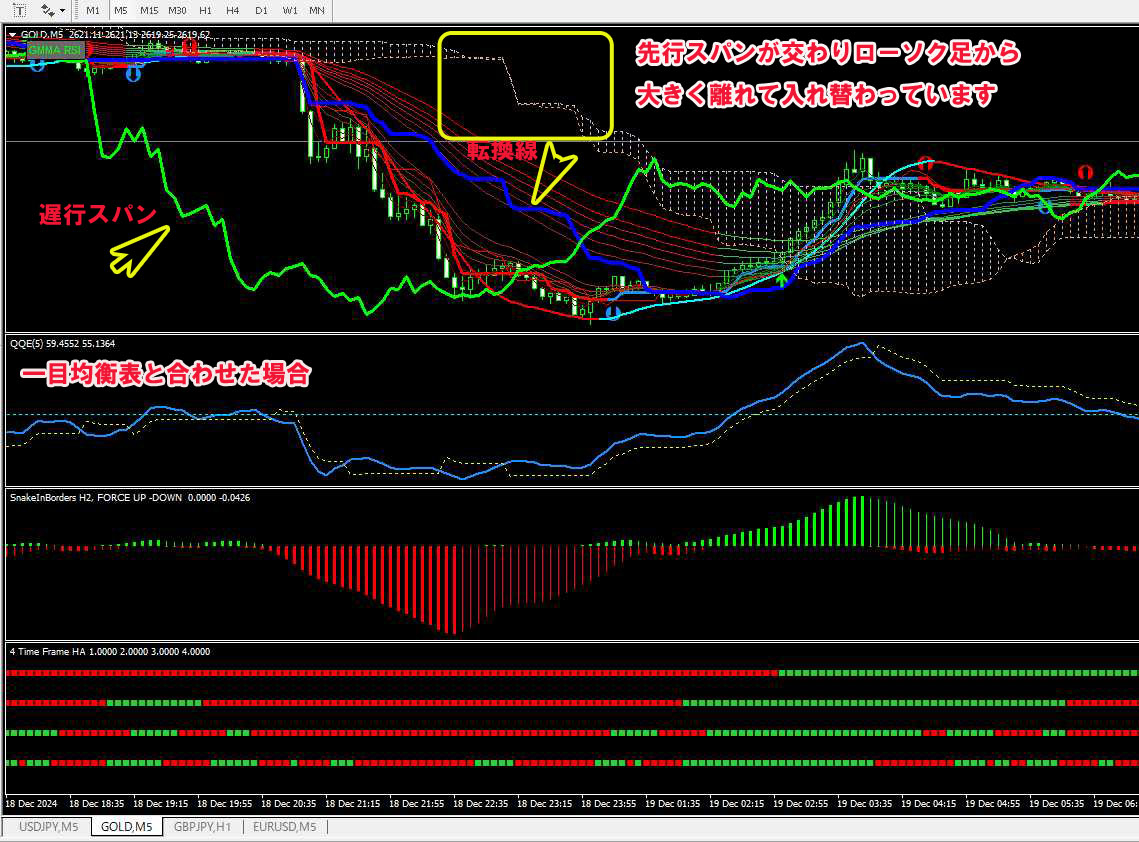
① Base line
② Conversion line
③ Leading Span A
④ Leading Span B
⑤ Cloud (resistance zone)
⑥ Lagging line
Ichimoku Kinko Hyo is composed of these six parts.
The “three-line bullish” condition is the entry timingfor entry signals.
・1. Conversion line crosses above the base line (or crosses below)
・2. Lagging line crosses above the candlesticks (or crosses below)
・3. Candlesticks are moving above (or below) the cloud
This situation is called the three-line bullish/bearish formation and serves as a guide for entry.
Originally, Ichimoku Kinko Hyo is commonly used on daily or other longer timeframes, but some professionals do day trading as well.
Some traders look only at the cloud, while others use other criteria to judge.
Basically, the entry point is when the three-line bullish formation occurs.
The stacked conditions above show past events long after entry, but in general they overlap with the three-line bullish formation.
Which should you look at?
Main signalis the main feature of this product, soplease check the main signal first.
However, for a more solid trade or to reduce losses even a little, to save time wasted on "pos-pos" behavior, you should confirm all conditions before taking a position, and when the next signal appears, make sure all conditions are met (especially the Slope line) and then close.
Product here!