

【GogoJungle Award 2024 Winner】New billion-dollar trader’s scalping with volume gain

I would like to report here that I was selected for the GogoJungle Awards 2024 at an earlier time and that I have won it for the second consecutive year.
I owe this all to the buyers, Investment Navigator+ readers, and everyone who supports us.
I would like to express my sincere gratitude once again.
This year’s award is the “Long-seller Award,” meaning it is awarded to a product that continues to sell even now.
As a seller, there is nothing more rewarding than this.
Going forward, we will continue to deliver “genuine content” that helps all traders, sothank you for your continued support.

■■■■■■■■■■■■■■■■■■■■■■■■■■■■■■
Good morning, everyone.
Yesterday’s USD/JPY moved about 120 pips in range.
The daily chart closed with a bearish candlestick.
after a long rise, it became a range, followed by a decline.
Viewing the current USD/JPY position on a 1-hour chart for about a month and a half
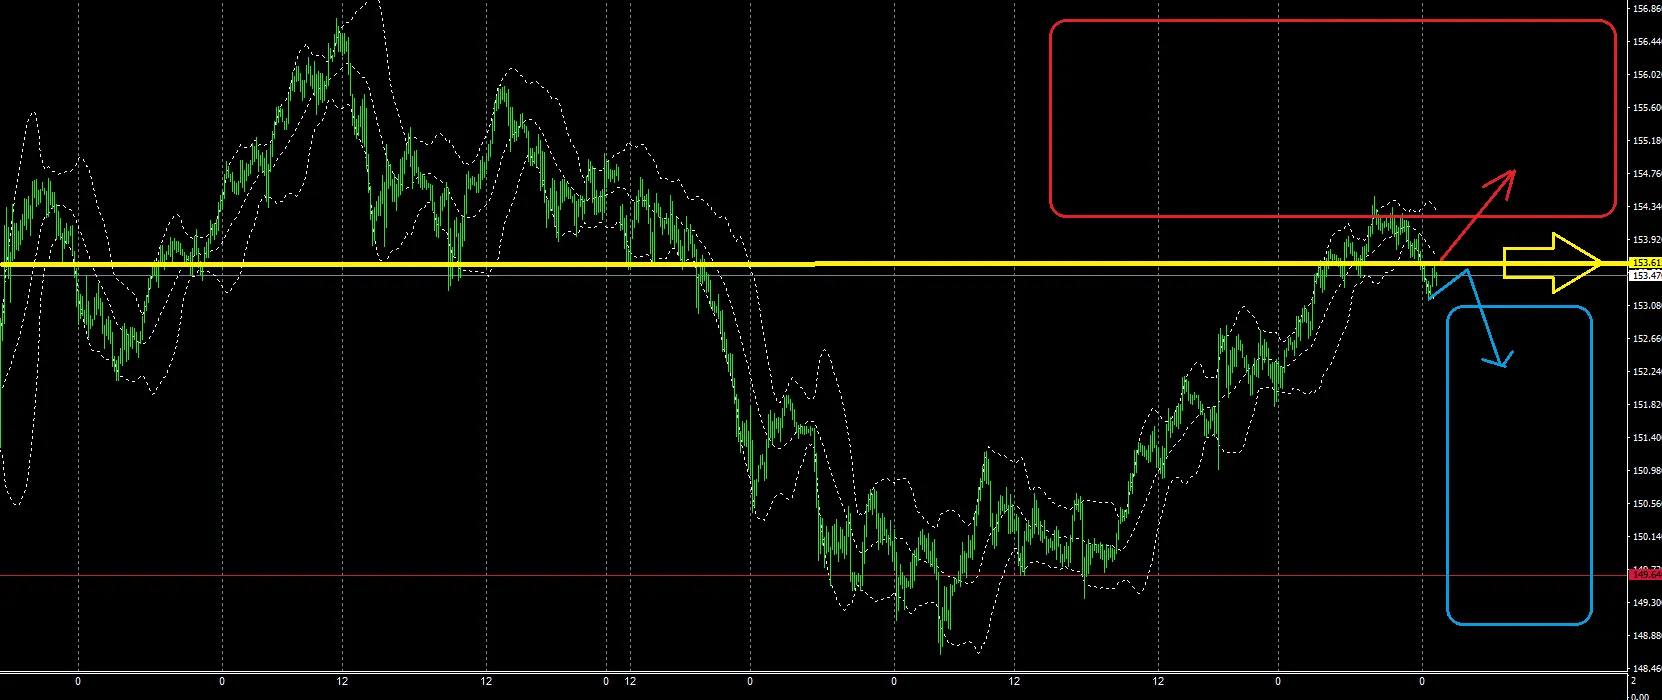
This is my personal view, but I consider the yellow horizontal line as a support/resistance turning point in price.
I forecast movements like the ones in the image moving forward.
First, observe the near-term moves on the USD/JPY 5-minute chart.
Millionaire traders, please note that it is difficult to draw millionaire trade lines on the 1-minute chart; draw millionaire trade lines on the 5-minute chart, then switch to the 1-minute chart to view.
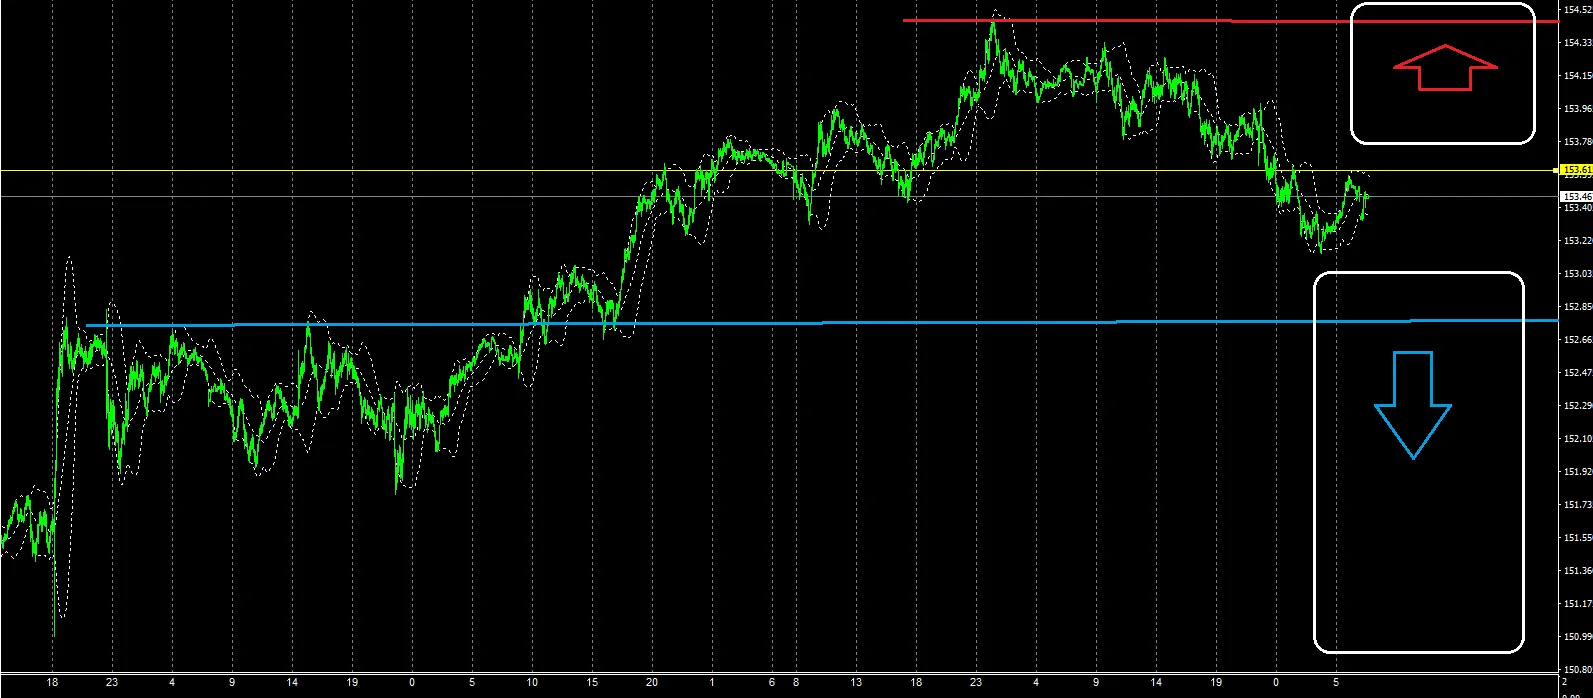
If the daily range is about 1 yen, the red and blue horizontal lines may be key points in terms of range.
The yellow horizontal line is a predicted turning point for the 1-hour chart’s support/resistance.
If volatility appears today, I think I can position according to the millionaire line, so depending on the time, the chart may become easier to read.
Now, there are a little less than two weeks left in this year.
If we count business days, it’s 10 days.
Among them, the four days from the 23rd to the 26th are overseas Christmas holidays, so effectively there are about 5 or 6 business days.
In such a situation, the events are the FOMC on the 19th early morning and the subsequent Bank of Japan meeting with Governor Ueda's press conference.
And another is the London FIX on New Year’s Eve the 31st.
I think the schedule will be roughly like this.
Last night’s U.S. indicators usually move a lot, but yesterday was lackluster.
GMO Click Securities’ foreign exchange options settings were quite strict, so GMO likely believed there would be movement.
I confirmed that as well and stood by for a FX hedge, but the downward plunge wasn’t deep enough, so I refrained.
Here,
was on standby.
When I trade on U.S. economic releases,
↓
↓
I will use these methods in order.
That said, not all of these methods will apply in every environment, so I will judge flexibly.
For example, when spread widening terminates and returns quickly, I chase volume in regular trading mode; if spreads stay wide for a long time, I will scalp before becoming a millionaire trader, aiming for tops and bottoms.
A simple way to use them, really.
If readers can buy trading materials without worrying about money, I would like them to obtain the three items listed above.
The reason is, as I wrote in the 16th article,
what I wanted to know when I started trading was a discretionary method that could be used immediately.
Where to take positions to easily turn a profit, and other such guidance I wanted in a book.
But such books were nowhere on the web, and in the end, most were about winning by combining indicators—unreasonable and not what I sought.
Also, since they were affiliate blogs for account openings, gathering information was just about impossible.
That history is why the three items above are truly the kind of effective products I wished for when I was a beginner.
If I try to explain with a simple chart...
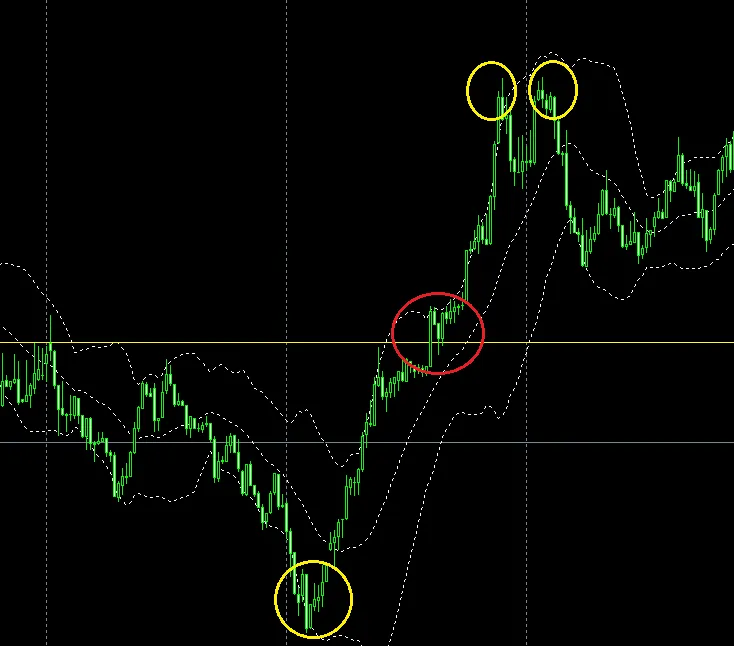
For example, in situations like yellow circles, you can enter with a reasonable contrarian approach, or in recent breakouts like red circles, you can enter.
If price moves as expected by 5P or 10P, take profit, and if it goes the opposite way, consider hedging; it’s a relatively easy way to position.
There are candles that seem to have formed a bottom; if I could catch the initial rise here, I might capture the early move...
A method to try in such scenarios
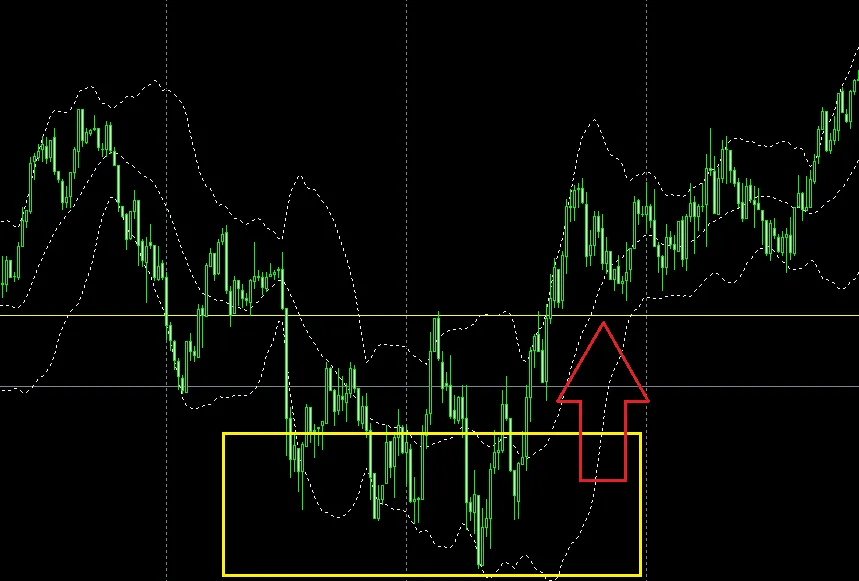
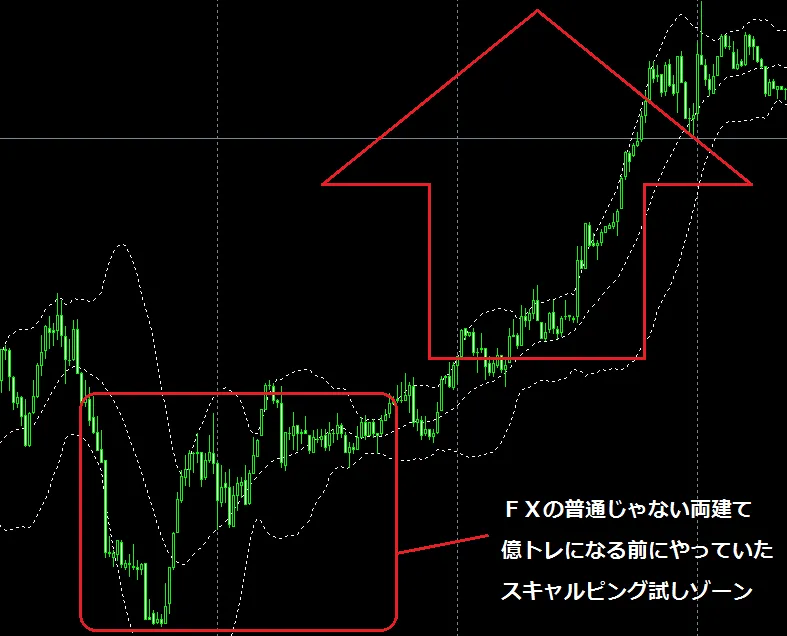
(Image is an example)
It’s not clear where the bottom is, but regardless of whether you take the two trades above or not, confirm that selling/buying has shifted and then ride the trend.
(Usually it’s not clear when the shift happens)
Furthermore, by watching volume and repeating trades, you can also trail.
Also, using the millionaire line as a base, you can capture breakouts, pullbacks, and recoveries to anticipate moves.
In this way, for me,
What to do when the market moves?
What to do after the market moves?
What to do when the market’s tone changes after a move?
If you can cover these scenarios, (selling is the opposite) trades generally work, and you will win if you don’t get the direction wrong.
I learned that it’s hard to lose.
That’s what I spoke about in promotional video
FX losses become avoidable if you can identify reversal points.
I am not a god, so I’m not perfect, but there is a general tendency, so don’t miss it.
I’m sure many of you have muttered to yourselves, “That’s exactly how it turns out,” during trading.
Probably that is due to trends and sentiments.
The key is whether you can grasp it without hesitation.
In the market, regardless of time frame, isn’t it mostly a repetition of the three chart images above?
Aren’t you just watching with your fingers in your mouth?
Aren’t you rushing in and ending up with losses?
The above three-item set could be described as my entire trading approach.
× ![]()