

Win rate 70% Trend-following signal Aizen3 buying on dips, selling on rallies
Buying on dips and selling on rallies is the most efficient method in FX trading.
Even if you take a position against the momentum, it will move against you immediately.
If you swim against the current, you’ll get extremely tired.
FX trading is the same.
It's very bad for mental health!!
Win rate 70% Trend Following Signal Aizen3
The product is here!
“Buy on dips” and “sell on rallies” refer to order methods in FX.
For FX beginners, discerning the right timing to buy and sell is one of the biggest challenges.
For such beginners who aim to profit, these methods can be effective.
Of course, there are risks that you must be aware of.
What are buying on dips and selling on rallies in FX
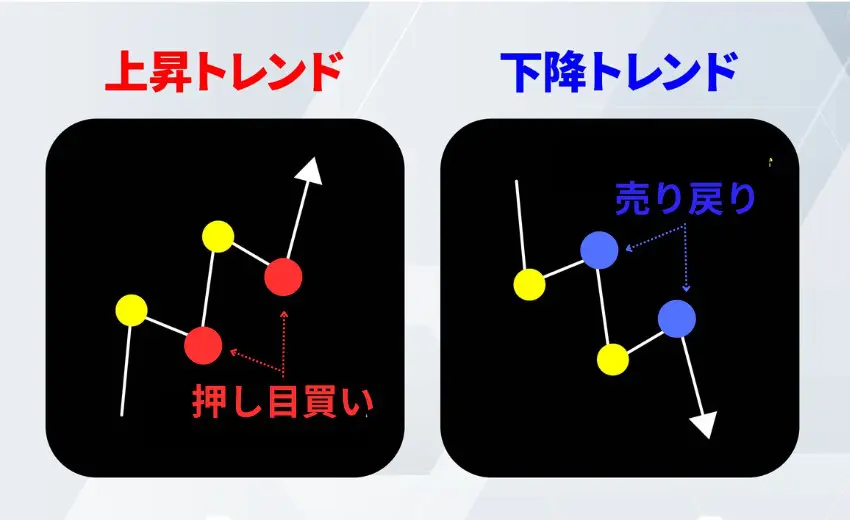
Buying on dips and selling on rallies are methods of placing orders in line with the chart’s trend. They are also used in stocks and other markets besides FX.
“Dip” refers to a temporary price decline (pullback) in an uptrend in currency or stock markets.It.A buy order entered at the dip is called “dip buying.”.
Conversely,selling at a temporary price rise within a downtrend is called “selling on rallies.”.
Both order methods are methods you should know to make a profit even as a FX beginner.
How to buy on dips and sell on rallies
Both dip buying and rally selling are trend-following methods, but they enter at timing when price temporarily adjusts in the opposite direction of the trend. Therefore, discerning the trend is very important.
If you cannot read the trend and enter at the wrong timing, you will fail, so be careful.
Timing for dip buying
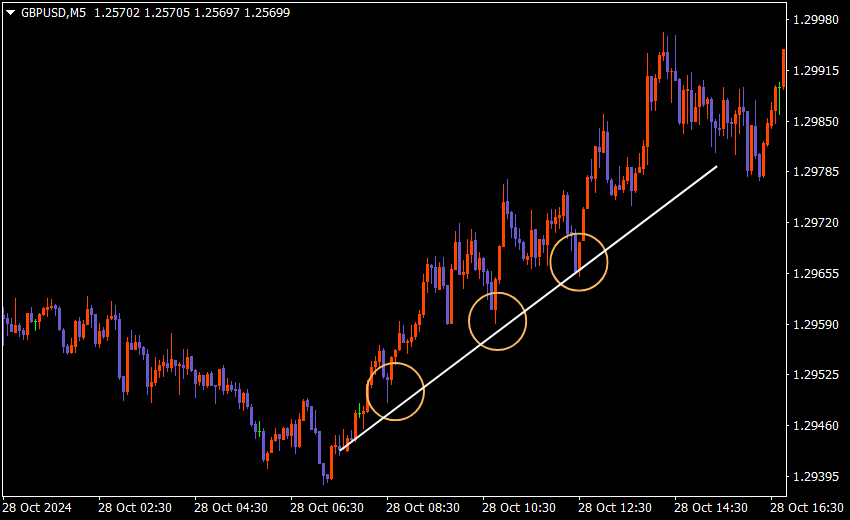
Generally, once an uptrend begins, price tends to continue rising, moving up and down but increasing over time.
This dip is considered a buying opportunity. Afterward, when the stock price rises again, you can aim for profit by selling.
However, even when it looks like a dip, it can be the start of a downtrend, so caution is required.
Also, the trend direction can change depending on the time frame, so be careful.
For example, on higher time frames it may look up, but on lower time frames it could be down.
If you’re unsure, using the lower-time-frame trend change signals as part of your entry timing is recommended.
Timing for rally selling
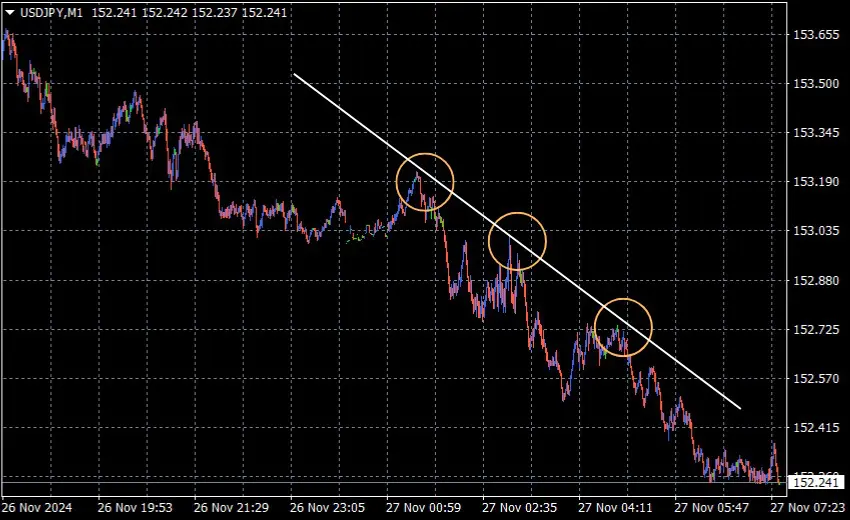
The entry timing for rally selling is the same as for dip buying. In a downtrend, points where price temporarily rises are entry timing points.
Downtrends continue to fall while moving up and down. When price temporarily returns downward, you can close the position to aim for profit.
Similar to dip buying, even when it looks like a rally selling opportunity, it could be the start of an uptrend, so caution is needed.
Neither method is a guaranteed win; both rely on correctly identifying the trend to time entries.
Example using 70% win-rate Trend Following Signal Aizen3
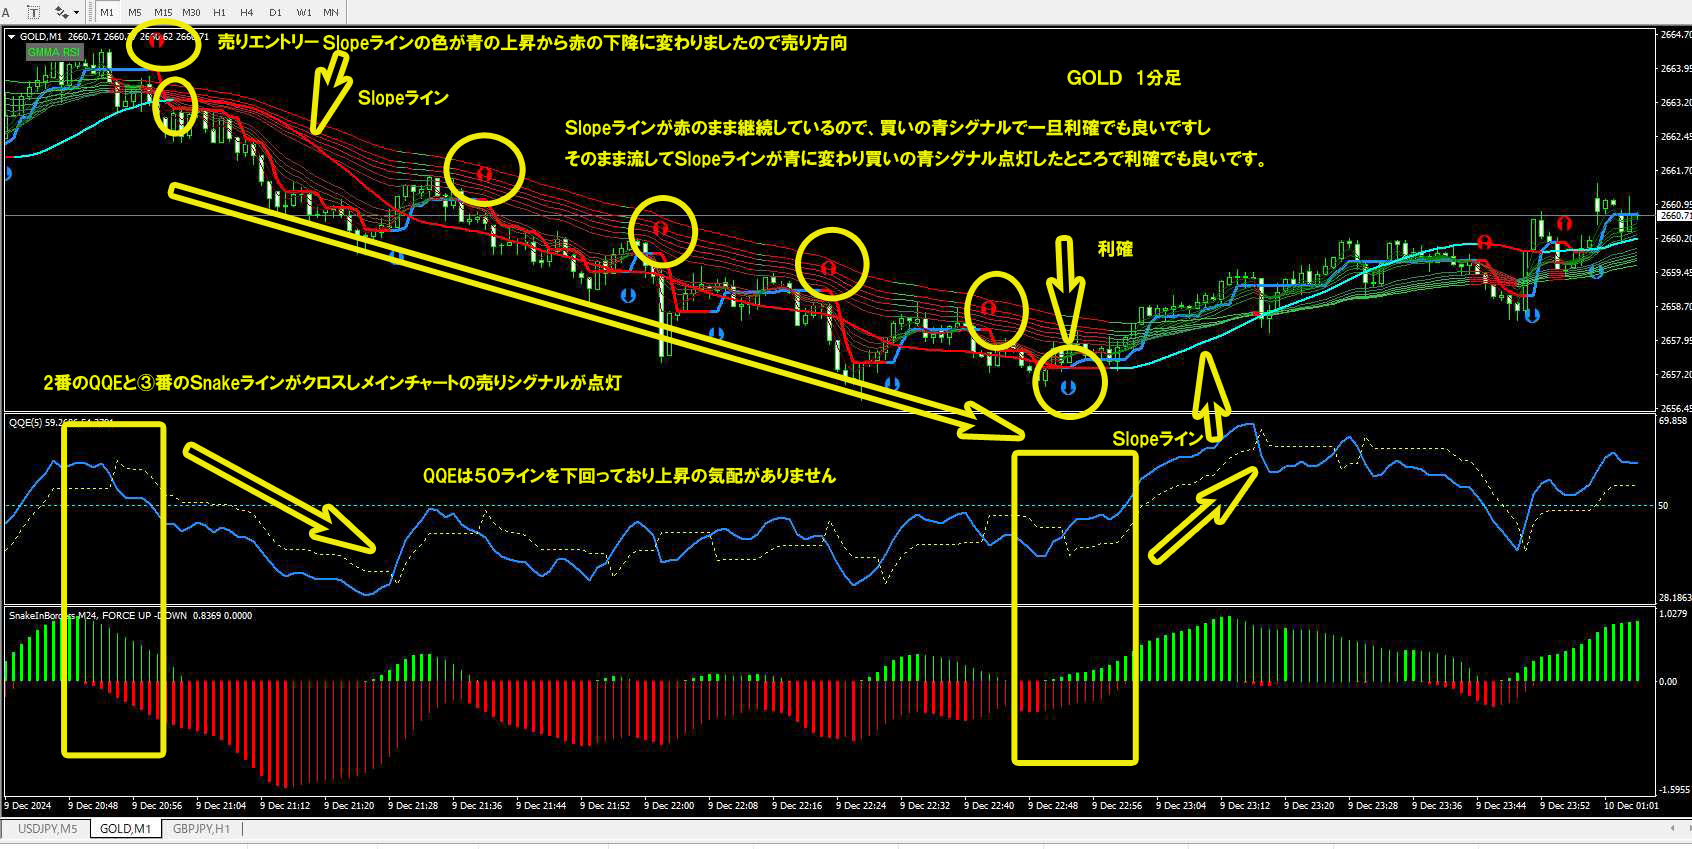
Look at the image above.
It is a rally selling situation.
This chart is a 1-minute chart, so while there are buy signals in between, buying in this case would not be very meaningful.
Rally selling can be judged with the Slope line.
The red line indicating selling continues throughout.
Closing the position midway may yield only a small profit, or worse, could lead to a loss. (That is why this product boasts a 70% win rate.))
QQE has fallen below 50 and shows no upward trend.
In the later stages, both QQE and the Slope line begin to rise.
This state is not always present, but on a 1-minute chart such conditions are common.
If you look at this on a 5-minute chart, price movement is almost nonexistent.
It is precisely because it is a 1-minute chart that it moves like this.
What can be said is that the most profit from consolidating trades comes from swing trading, but you hold positions longer and must be able to cut losses appropriately deep, or you’ll be out!
The position can unexpectedly vanish when you are forced to cut off abruptly… this happens frequently.
If your stop is too shallow, when price moves sharply even briefly, your stop loss line can be hit and the position will be cut off suddenly.
If you could cut a little deeper…
Even if you think so, it’s already too late.
Regarding stop loss levels, consider how much capital you have allocated.
It depends on what time frame you are trading on.
On a 4-hour chart, if the trend is clearly a dip, price swaying the opposite way is less likely, so it’s okay to set deeper stops.
Neither method is a guaranteed win; both rely on correctly identifying the trend to time entries.
Drawing trendlines
Normally this is how you determine the trend, but with this product you can determine it with the Slope line.
This Slope line can be adjusted by changing parameters (for details, refer to the article written earlier). You can adjust the curvature according to your preference and the time frame.
The default is 80.
The fewer the numeric value, the more sensitive it is.
However, to understand the big picture, it’s fine to use the default while judging with QQE and other indicators; people split into which method suits them or not, so try it and decide which indicators are unnecessary or which to hide (do not install).
I don’t think you need every indicator… neither do I.
I think it’s fine to have the main signal indicator and just the Slope line.
If possible, enter in the direction of the trend
As mentioned above, always “dip buying and rally selling should basically be entered in the direction of the trend.”
In trend-following, you place buy orders during uptrends and sell orders during downtrends.
Conversely, selling in uptrends and buying in downtrends is called counter-trend trading.
Counter-trend trading tends to have larger profit margins when successful.
However, timing the entry is difficult, so it is not highly recommended for beginners not accustomed to chart analysis. If you fail, unrealized losses can grow.
Dip buying and rally selling are entered at high/low points where price moves against the trend, so they are often mistaken for counter-trend strategies, but they are used as in-trend methods.
First, try to enter with the trend, not against it.
I use the Ichimoku Kinko Hyo (though it’s an old indicator) occasionally, but it may be difficult for beginners to judge. (In fact, I think it’s difficult.)
Ichimoku is built into MT4 by default.
Some traders judge using the “cloud.”
Some judge using the base line and lagging span, but those have different styles, so it’s hard to say.
This product is not designed to be a signal-only trade; it’s not planned to include notification features.
It’s constructed to be judged comprehensively with other indicators.
Well then, thank you in advance.
I run a site that also introduces products other than FX on my own.
There are various writings there, but linking here is not allowed, so…