
When actually trading, 2024/12/09
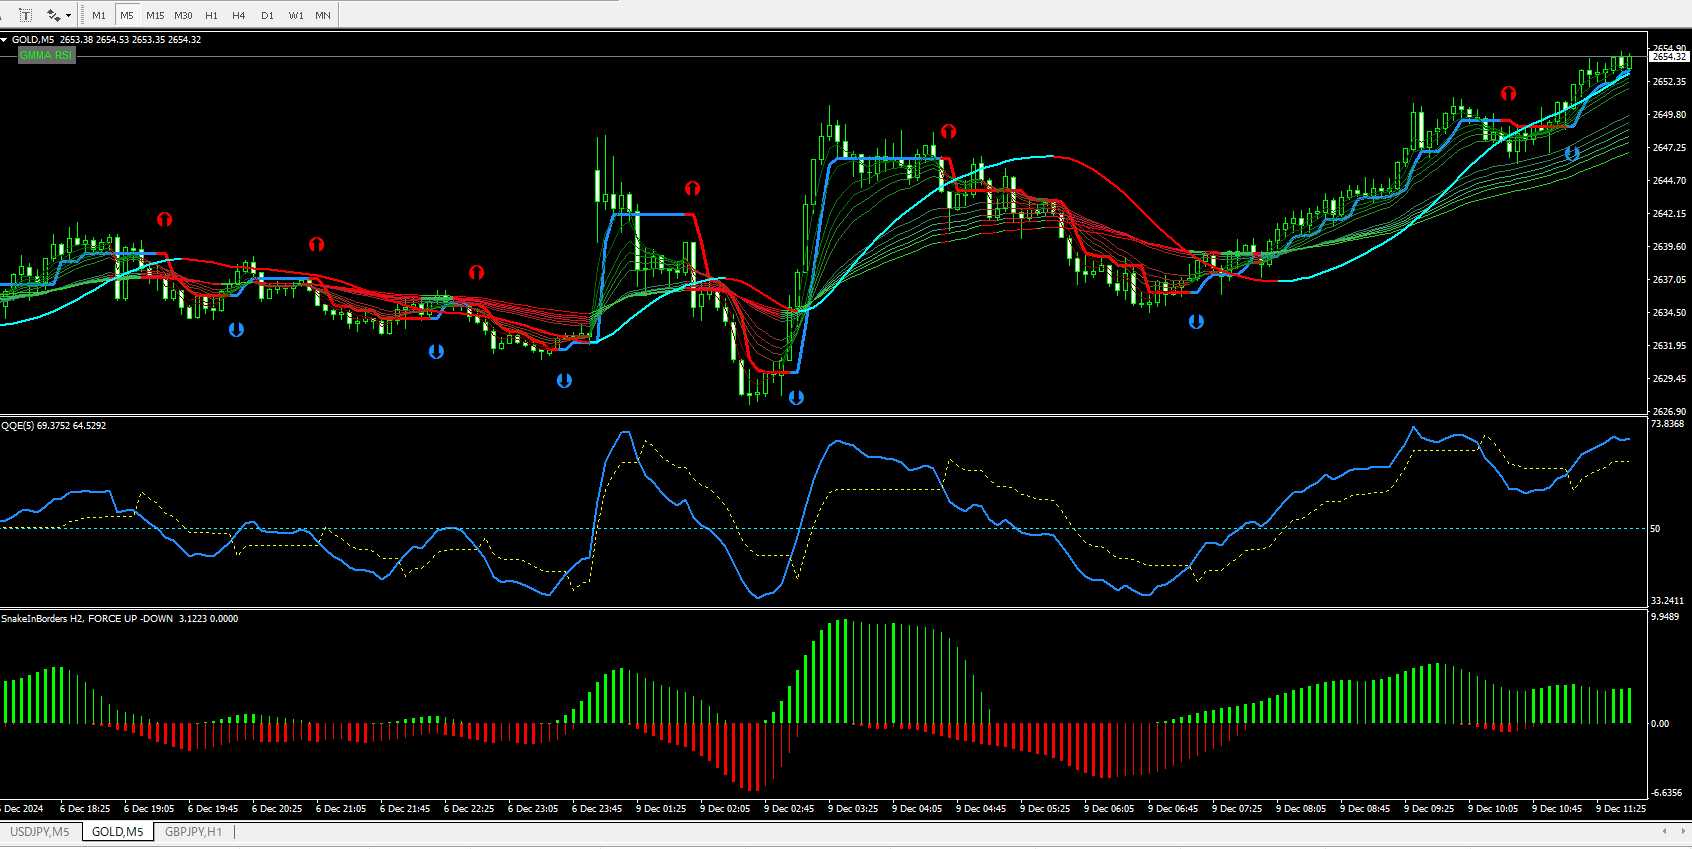
2024/12/09 GOLD 5-minute chart
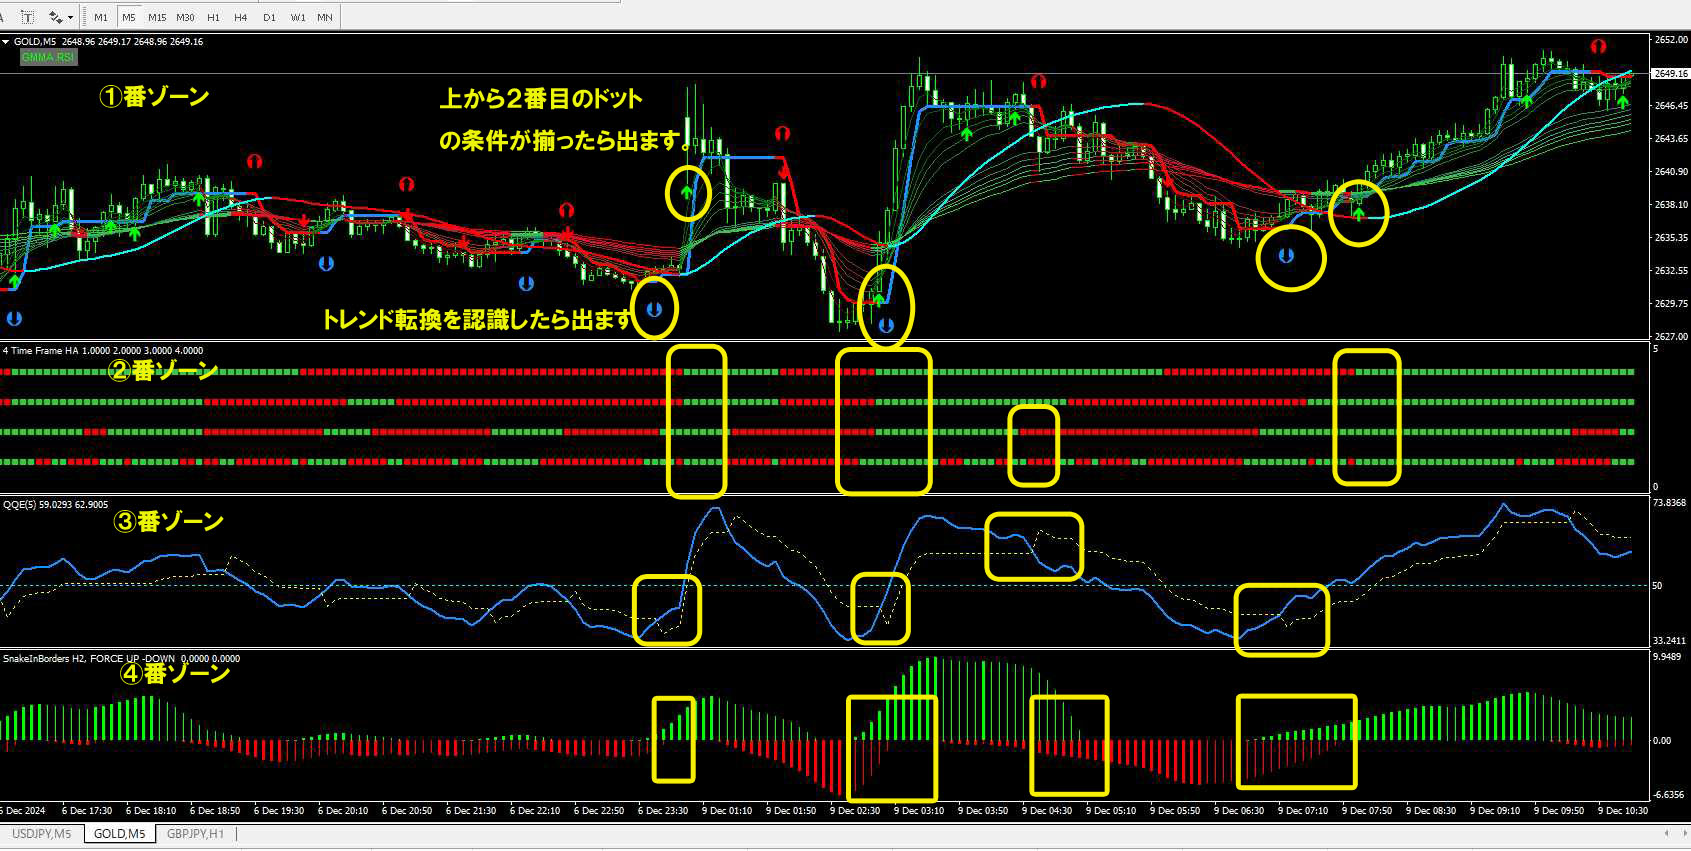
Basically, trade within Zone 1 using the main signal
Blue signal is buy, red is sell
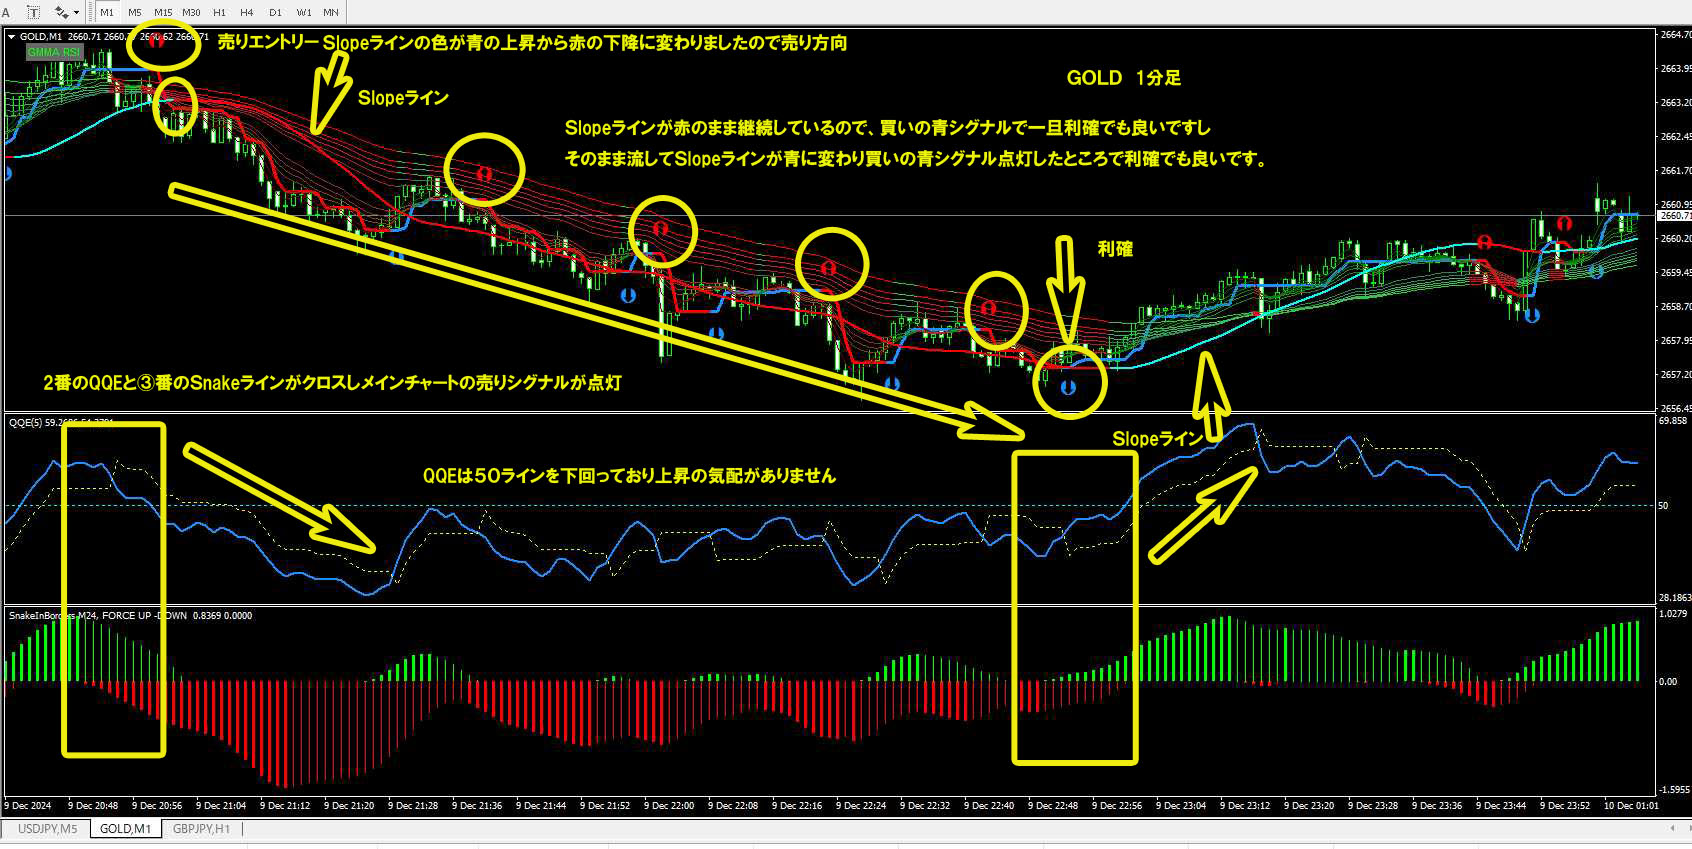
Take profitIf you entered with the blue buy, take profit with the red sell
In Zone 1, the Slope Line gently traces the trend direction
After the first buy signal appears in Zone 1, the red sell signal appears, but afterward the Slope Line remains red and declines for a while
Here, even when signals appear, you can only capture a little, and you might actually lose due to the spreadIt is better not to take a position(With certain currencies, you can capture a little when spreads are tight.)
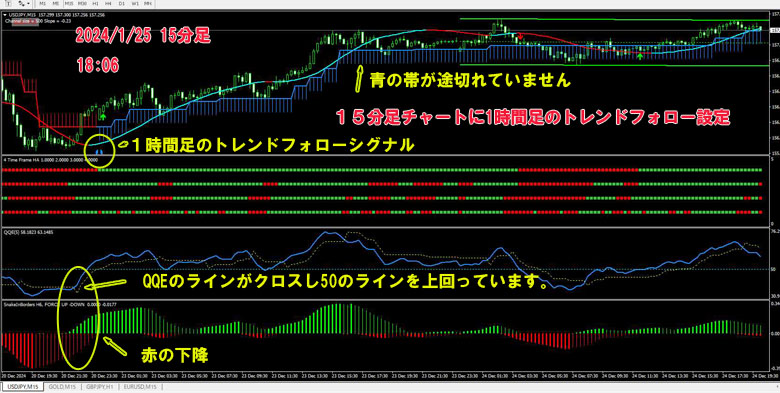
In Zone 2, the topmost part represents the 1-hour chart (from bottom on this chart: 5-minute, 15-minute, 30-minute, 1-hour)Red dots are consecutively appearing
This indicates a downtrend
Looking at the mountain shapes in Zone 4, the fluctuation is not severe, and Zone 3 is not steep; there is no up-down cross by the line
Taken together, it is better to avoid trading
The diagram below shows Zone 2 being bypassed
If you are not judging direction across multiple timeframes, this may be easier to follow
Use it as you prefer
※ Finally
Even signals within Zone 1 can be traded, but trading in a range state with a position (portfolio) may be dangerous (the possibility of a loss), so please judge trading based on all circumstances