Helpful resources
As a FX company where you can view real-time P&F charts, Rakuten FX's P&F chart is recommended.
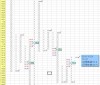
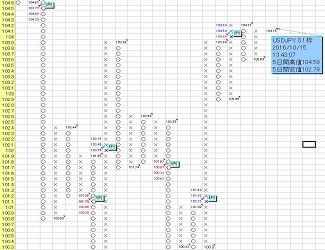
By combining the currency pair, time frame (transactions per minute or per hour), and reference frame (price range) with the “market forecast tool,” the P&F that closely resembles (almost the same as) the P&F of the “market forecast tool” is displayed and updated in real time, allowing you to grasp the shape of the real-time P&F and providing an indication for signals.
※ Even if Rakuten MT4 is used for data extraction, the underlying data differ between Rakuten FX and Rakuten MT4, so completely identical point & figure charts will not be created.
If you switch to multi-monitor display, it may be good to have one screen show this real-time P&F chart as shown below.
Example 1.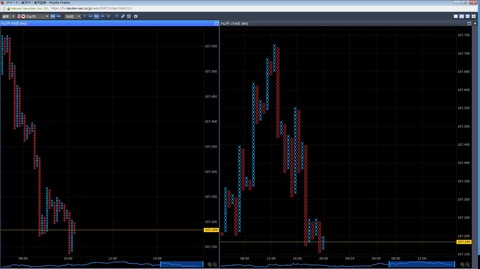
Example 2.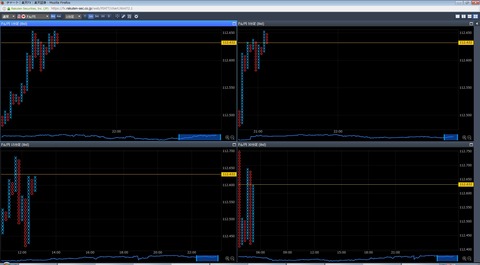
※ For Rakuten FX’s P&F chart, please contact Rakuten FX.
To operate the “market forecast tool” comfortably, a mouse with a tilt wheel feature (scrolling the screen left and right by tilting the wheel) is essential.
Also, it is convenient to know Excel shortcuts [Ctrl + PageUp] (move to the sheet on the left) ・ [Ctrl + PageDown] (move to the sheet on the right) ・ [Ctrl + Mouse wheel rotation] (zoom in/out on the screen).
To enable these shortcuts to be executed with just the mouse, a mouse with many buttons in addition to the tilt wheel is recommended.
If you assign [Ctrl + PageUp], [Ctrl + PageDown], and [Ctrl key] to three of its buttons, you can move quickly between sheets and zoom the screen with the mouse alone, enabling more efficient operation.
Furthermore, assigning frequently used tool shortcut keys to mouse buttons will make tool operation even more efficient.
I think it is best to search for “tilt wheel” on Kakaku.com or similar sites and choose one with high review ratings.
The main chart I use for day trading is GMO Click Securities’ Platinum Chart.
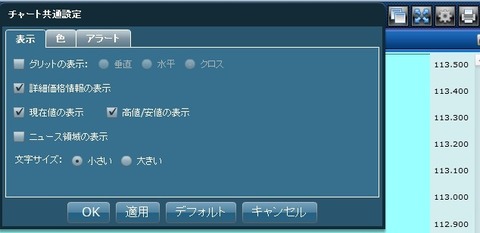
The main advantage of the Platinum Chart is that, by clicking the [Chart Common Settings] button at the top right of the chart screen, you can display “High/Low” and their “date/time” on the chart by checking the boxes as shown in the image below and clicking the [OK] button.
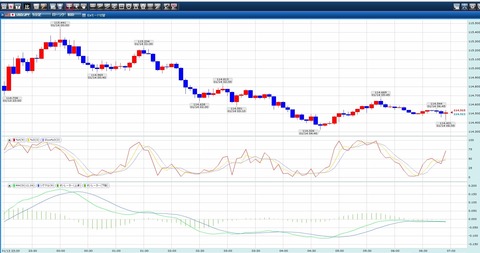
As shown below, I primarily display 15-minute, 5-minute, and 1-minute charts with MACD and slow stochastics in parallel, as well as a tick chart, and I often enter trades by catching divergences between MACD and Stochastic.
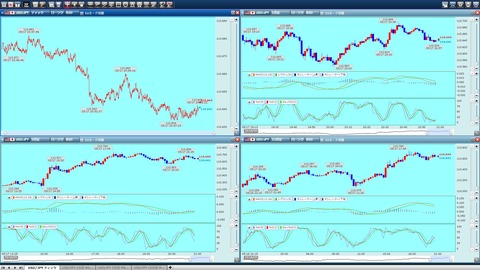
To set it up, click the “Technical Settings” button in the top menu bar, then check “MACD” and “Stochastic” under “Oscillators,” and click OK.
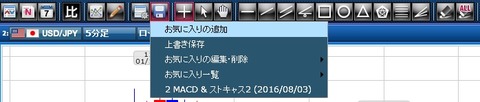
To save the settings, click the “Save Settings” button in the top menu bar and select “Add to Favorites.”
A dialog box titled “Add to Favorites” appears; enter a suitable name and click the Save button.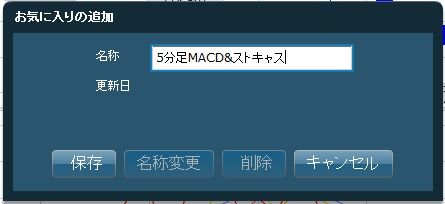
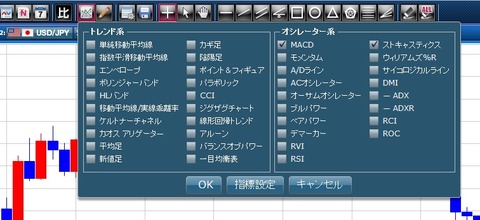
(There is also “Point & Figure” under “Trend tools,” but it is better to use Rakuten Securities FX as introduced in the previous article, which is superior.)
I do not use it often, but you can also add the “Bollinger Bands” from the “Trend tools.”
Similarly, you can add the “Exponential Moving Average” under the “Trend tools.”
There are three EMAs: short-term (EMA1), medium-term (EMA2), and long-term (EMA3), but common settings are:
・Short-term (EMA1) … 5-day, 10-day
・Medium-term (EMA2) … 20-day, 25-day, 75-day
・Long-term (EMA3) … 100-day, 200-day
etc. These are typical settings.
Click the “Indicators Settings” button in the image below to open the “Technical Indicators Settings” dialog box, click “Exponential Moving Average” and configure it.
The above are recommended charts and technical settings, but for day trading and scalping, having knowledge about candlesticks is also beneficial.
※ For the Platinum Chart usage, please contact GMO Click Securities.