
Win rate 70% Trend Following Signal Aizen3 Actual Trade Examples Explanation
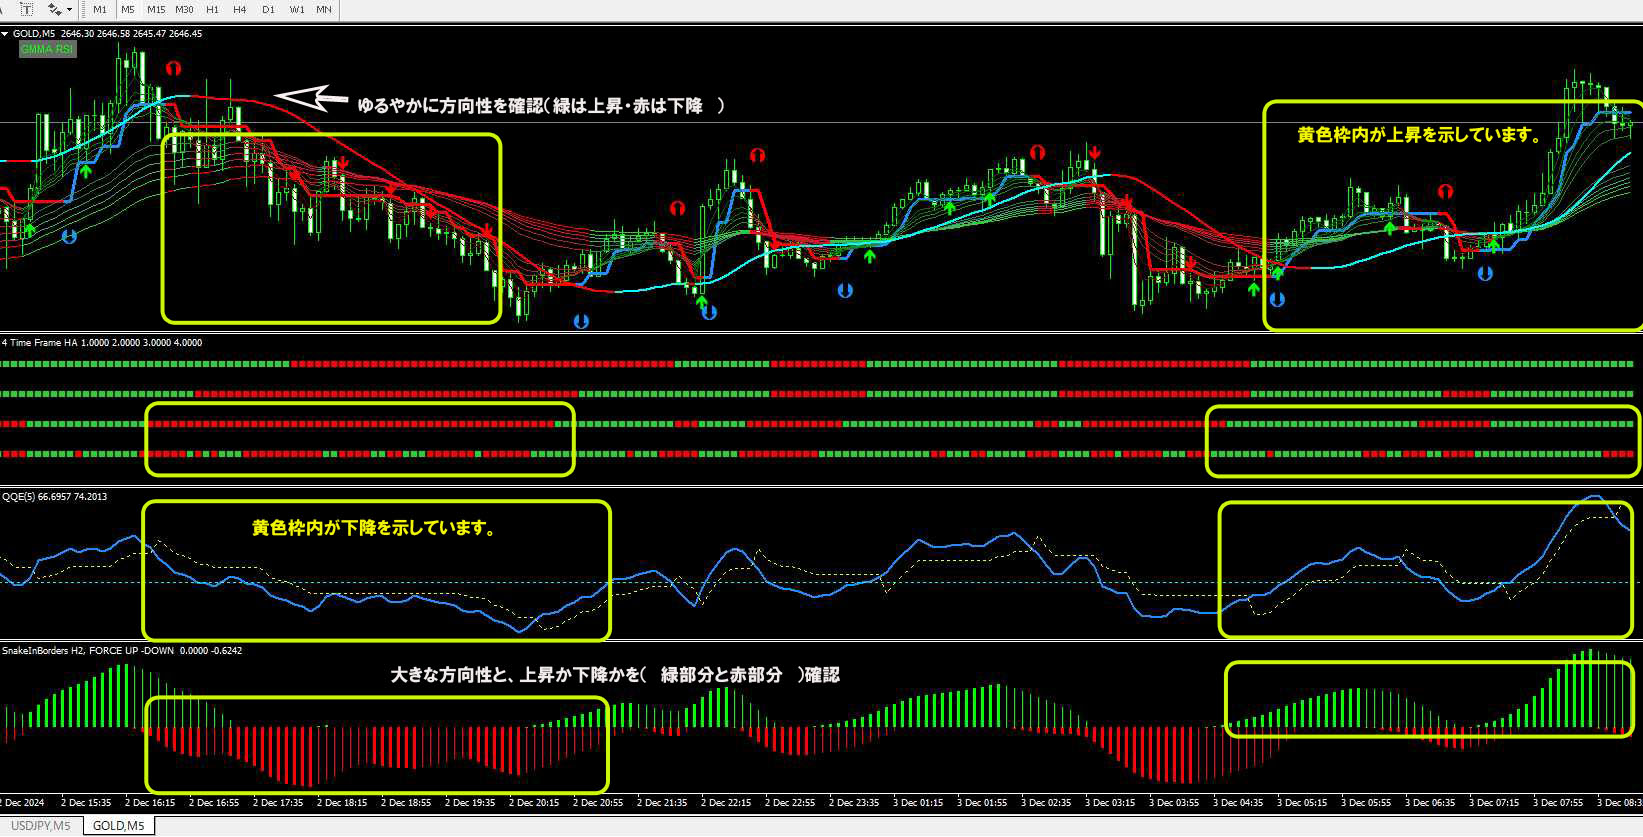
The chart above is a 5-minute chart. (USD/JPY m5)
It can also be done on a 1-minute chart as a basic option.
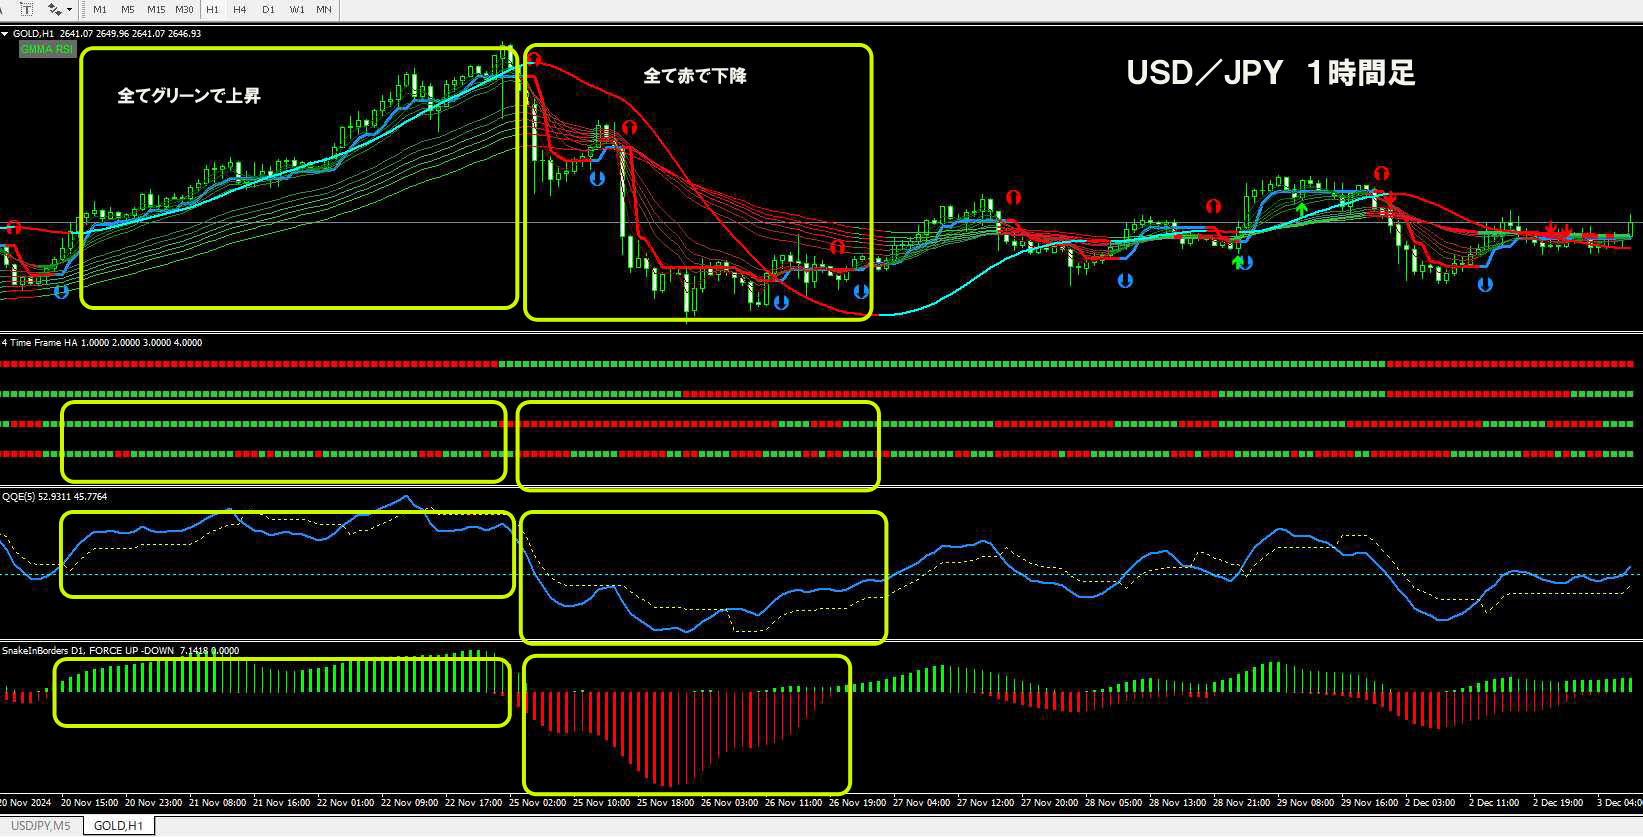
Below, I have included the same time frame in an hourly chart.
To newly confirm the direction, I have added two indicators.
I believe this will allow for entries and take-profits with more solid basis.
〇 Additional indicators
- Slope Line_Aizen
- Snake_Aizen003
These are the two.
・SlopeLine_Aizen gradually draws a wave to indicate the trend direction on the main chartand in green it indicates rising, in red it indicates falling.
Green indicates an uptrend.
・Snake_Aizen003 is similar to the MACD at the bottom of the sub-chart.
An uptrend is shown in green, a downtrend in red.
The main chart and the sub-chart indicators in the yellow qualification area collectively represent the current trend direction, enabling a reliable entry and take-profit after confirming all indicators.
The figure below is the hourly chart.
〇 Entry and Take-Profit
Relying only on the buy/sell signals from the main chart is usually fine, but on 1-minute or 5-minute charts the candle-close signals appear after the candle closes, and there is no guarantee you will always take profit with a 100% positive result.
However, even if a retrace occurs, a reverse signal appears soon, so losses are not too large; for some currency pairs it may amount to a few pips negative.
Therefore the win rate is set at 70%. (I don’t expect to ever be 100% profitable.)
The explanations for the indicators that come with the software from the start are in the manual, but here I mainly explain how to use the additional indicators to aid trading decisions.
・About theSlopeLine_Aizen
As mentioned in the description at the very top 5-minute chart, it gradually curves across the entire candlestick range to indicate the trend direction.
Also, when green, it indicates an uptrend, and when red, a downtrend.
If the wave and color align with the buy/sell signals and GMMA on the main chart, you can enter and take profit.
Also check the sub-chart; if both agree, please take a position.
※ Note
Even in range conditions, if a trend change is sensed, a buy/sell signal may occur.
This is the reason for the 70% win rate.
If a buy/sell signal occurs in a range state but only yields a small take-profit, the PIPS may go negative; as noted above, signals may not always be followed to the letter.
If it retraces, a reverse signal will appear soon, so please cut losses there.
A wave similar to MACD appears on the sub-chart.
Candlesticks move along that curve.
If green, it indicates rising; when the peak shifts to decline, the color becomes a slightly shaded green.
Red (downward) behaves similarly.
There are overlapping parts, but this area is a complete consolidation, so there is no trade.
However, this is about future movement, so at the initial point it cannot be known.※ CountermeasuresOn the main chart, combine GMMA with buy/sell signals,SlopeLine_Aizen for an overall judgment.The most important aspect here is the color of the four bars in the second level of the sub-chart.These four bars representthe lower time frame at which they are openare in effect.Green signifies an uptrend, red signifies a downtrend.What matters most is the timing when the color of the lower time frame changes and the color change timing of the next higher time frame up one level (for a 5-minute chart, the next up is 15 minutes). Then enter and take profit.Instead of judging only by the current lower time frame, it is better to wait until the color of the higher time frame (here, 15-minute) also turns the same color (uptrend to downtrend, or vice versa) before entering and taking profit.If you want to hold longer, wait for the color of the higher time frame (the trend) to change.Note that the higher time frame becomes the 30-minute chart, so long-term positions are held, so if you must be away for a break or other matters, it is better to avoid trading on longer time frames.If you are okay with looking at up to the daily chart for swing trading, that is fine, but by Friday it is better to close positions as much as possible.Keep a sufficiently deep stop loss (SL).This is simple, but that's all.Also, if I notice anything else, I will write it, and if I think it would be good to use this indicator together, I will add it.As mentioned in the manual, you can trade using only the main chart signals, but for me it is designed to judge from the overall picture to ensure a reliable trade.Thank you very much.
※ Countermeasures
On the main chart, combine GMMA with buy/sell signals,SlopeLine_Aizen for an overall judgment.
The most important aspect here is the color of the four bars in the second level of the sub-chart.
These four bars representthe lower time frame at which they are openare in effect.
Green signifies an uptrend, red signifies a downtrend.
What matters most is the timing when the color of the lower time frame changes and the color change timing of the next higher time frame up one level (for a 5-minute chart, the next up is 15 minutes). Then enter and take profit.
Instead of judging only by the current lower time frame, it is better to wait until the color of the higher time frame (here, 15-minute) also turns the same color (uptrend to downtrend, or vice versa) before entering and taking profit.
If you want to hold longer, wait for the color of the higher time frame (the trend) to change.
Note that the higher time frame becomes the 30-minute chart, so long-term positions are held, so if you must be away for a break or other matters, it is better to avoid trading on longer time frames.
If you are okay with looking at up to the daily chart for swing trading, that is fine, but by Friday it is better to close positions as much as possible.
Keep a sufficiently deep stop loss (SL).
This is simple, but that's all.
Also, if I notice anything else, I will write it, and if I think it would be good to use this indicator together, I will add it.
As mentioned in the manual, you can trade using only the main chart signals, but for me it is designed to judge from the overall picture to ensure a reliable trade.
Thank you very much.