

【Known the moment MA turns up/down】 Use indicators to make it easier!
【MA's Way of Thinking】
Misidentifying indicators – The formula edition –
https://www.gogojungle.co.jp/finance/navi/articles/38557
This is also written in the article above, so I’ll describe SMA briefly.
If you want to understand it properly, please read along (^_^♪)
What SMA is…
If you compare the closing price from a certain number of days ago with today's closing price, you can tell whether it will go up or down.
That is what it means.
Thinking with 5SMA, the formula is
5SMA=
{(closing price 5 days ago)+(closing price 4 days ago)+(closing price 3 days ago)+(closing price 2 days ago)+(yesterday's closing price)} / 5
Therefore, whether it will go up or down today is determined by
excluding(the closing price 5 days ago),
and including(today's closing price) in the calculation,
Did you understand? (*^-^*)
The article above explains with concrete numbers, so if you’re unsure, please read it once!
Now, this timelet's make things easier by using indicators!That’s the story.
Somewhere before I talked about“lagging span”to make things easier, but
“Honestly, I don’t really understand it”
“Counting 22 bars back every time and looking at it is a hassle”
“I don’t know where to look 22 bars back”
“I don’t know during verification”
such feedback we received.
So…
this time, we’ll make it even more effortless.
I used to purchase and use this kind of helper indicator on MT4 long ago, but since built-in indicators can do it as well, I’ll introduce them (*^-^*)
※【A little coffee break… (´・ω・)っ旦】
The indicator I bought could move MA into the future,
could determine up or down by color,
and could even display the angle of rise or fall, which was interesting.
At that time I thought it would be clearer if moved into the future. Thus the idea of DMA came about. (There was something called DMA, haha)
Back then I didn’t know at all (laughs)
Now, back to the topic…
The indicator we’ll use is“DMA (Leading Moving Average)”.
Leading…
The opposite of Lagging Span.
Parameters are
Period: “1” ※This is a line that connects closing prices. It is not averaged.
Offset: “21”※Moved 22 bars into the future for drawing.
That’s it.
※【Note!】
If you offset Lagging Span by “1”, it will be the same as the current value.
If you offset DMA by “1”, it will be one bar into the future from the current value.
Therefore Lagging Span is “22” and DMA is “21.”
【Lagging Span (yellow)】
The closing price is drawn 22 bars in the past.
【DMA (white)】
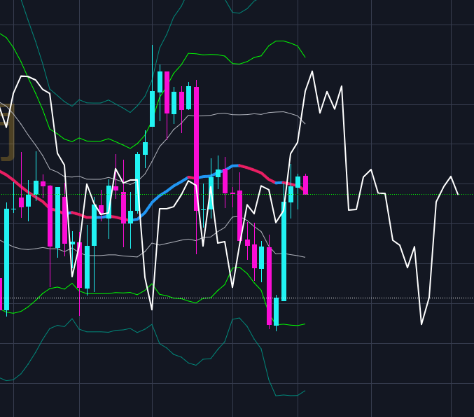
Conversely to Lagging Span, the closing price is drawn 22 bars into the future.
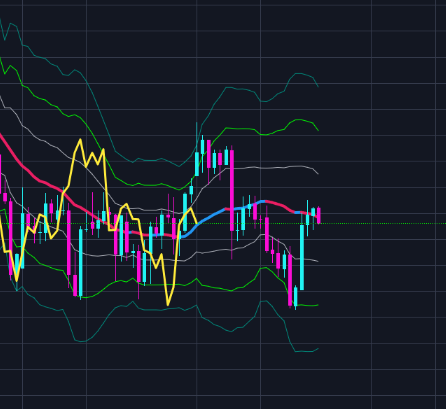
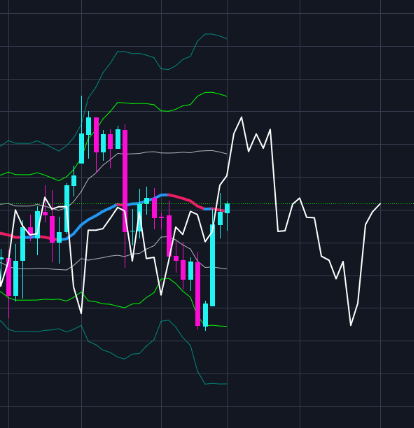
Removing unnecessary lines…
I made the current value a line chart (light blue) instead of a candlestick chart.
The same line is drawn three times, isn’t it!
In short, both Lagging Span and DMA
are lines that simply move the closing price into the past and future.
※Because DMA’s parameter is “1.”
Where were we looking with Lagging Span?
With Lagging Span up to now,
we looked at the closing price 21 bars ago and the current value to see whether it would go up or down.
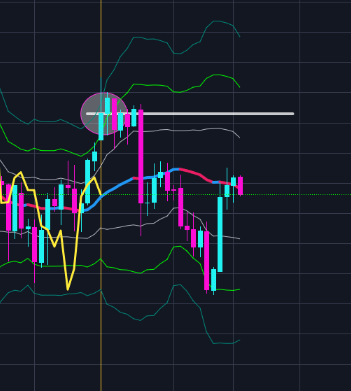
In other words, by looking at【21 bars ago closing price (white horizontal line)】and the current value,
if the current value breaks above it, it's upward; in the above image it is positioned downward, so MA is downward.
Looking at Lagging Span…
We compare the closing price of that period with the current value.
It may feel tedious for those not used to it, and harder to verify historically… (´;ω;`)
But with DMA,
If the current rate is above DMA, MA is upward,
If it is below DMA, MA is downward.
In the above image, DMA is expected to rise in the future, making it difficult to break above,
so MA is expected to stay downward for now,
and as shown below
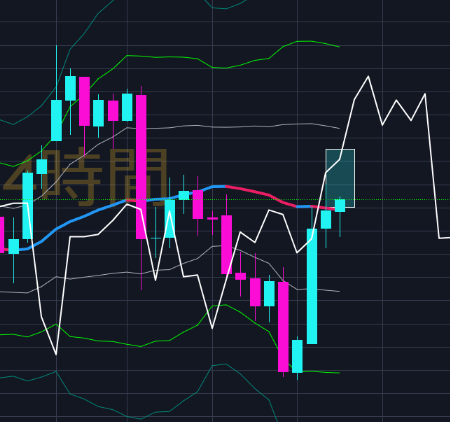
If there is a bullish candle that breaks above DMA in the future, SMA will turn upward.
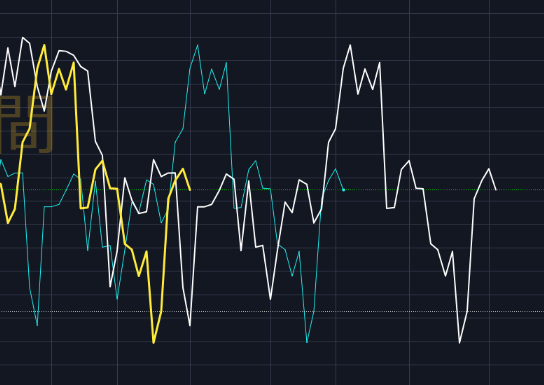
Also, past verification is easier!
For example…
Look at the yellow vertical line.
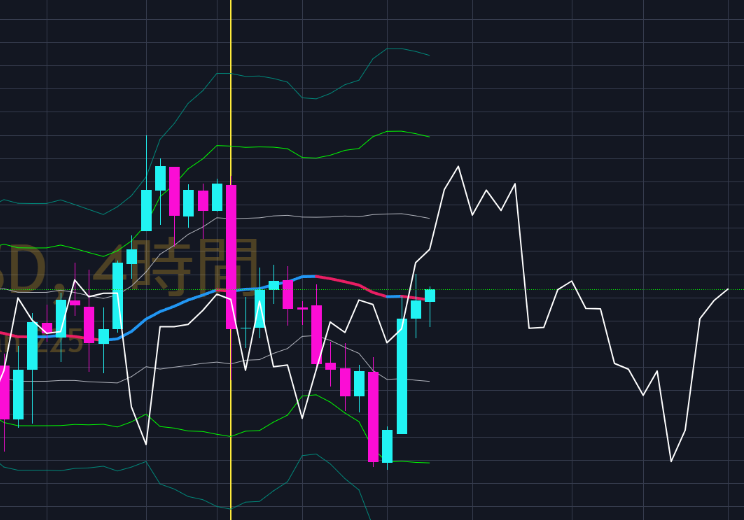
A large downward price bar appears and the closing price breaks below DMA.
Therefore SMA becomes downward (downward is red).
The next candlestick closes above DMA, so SMA again turns upward (upward is blue).
You can verify easily using only candlesticks and DMA.
With Lagging Span you’d have to count 22 bars back each time (;^_^A
With DMA it’s visually easier, do you understand? (*^^)v
Starting December I’ll switch from Lagging Span to DMA in the newsletter as well!
The idea of which direction SMA will take is the same.
However, where you can make things easier with an indicator, let’s use that!
That’s the story (*^^)v
In trading
there is no method to earn by taking it easy!
So please don’t misunderstand (^^♪