+ [11/26~27 USDJPY Dollar-Yen] (202) 200 pips exceeded
11/26~27 USDJPY Dollar/Yen
From entry to settlement
—
As environmental recognition, see below
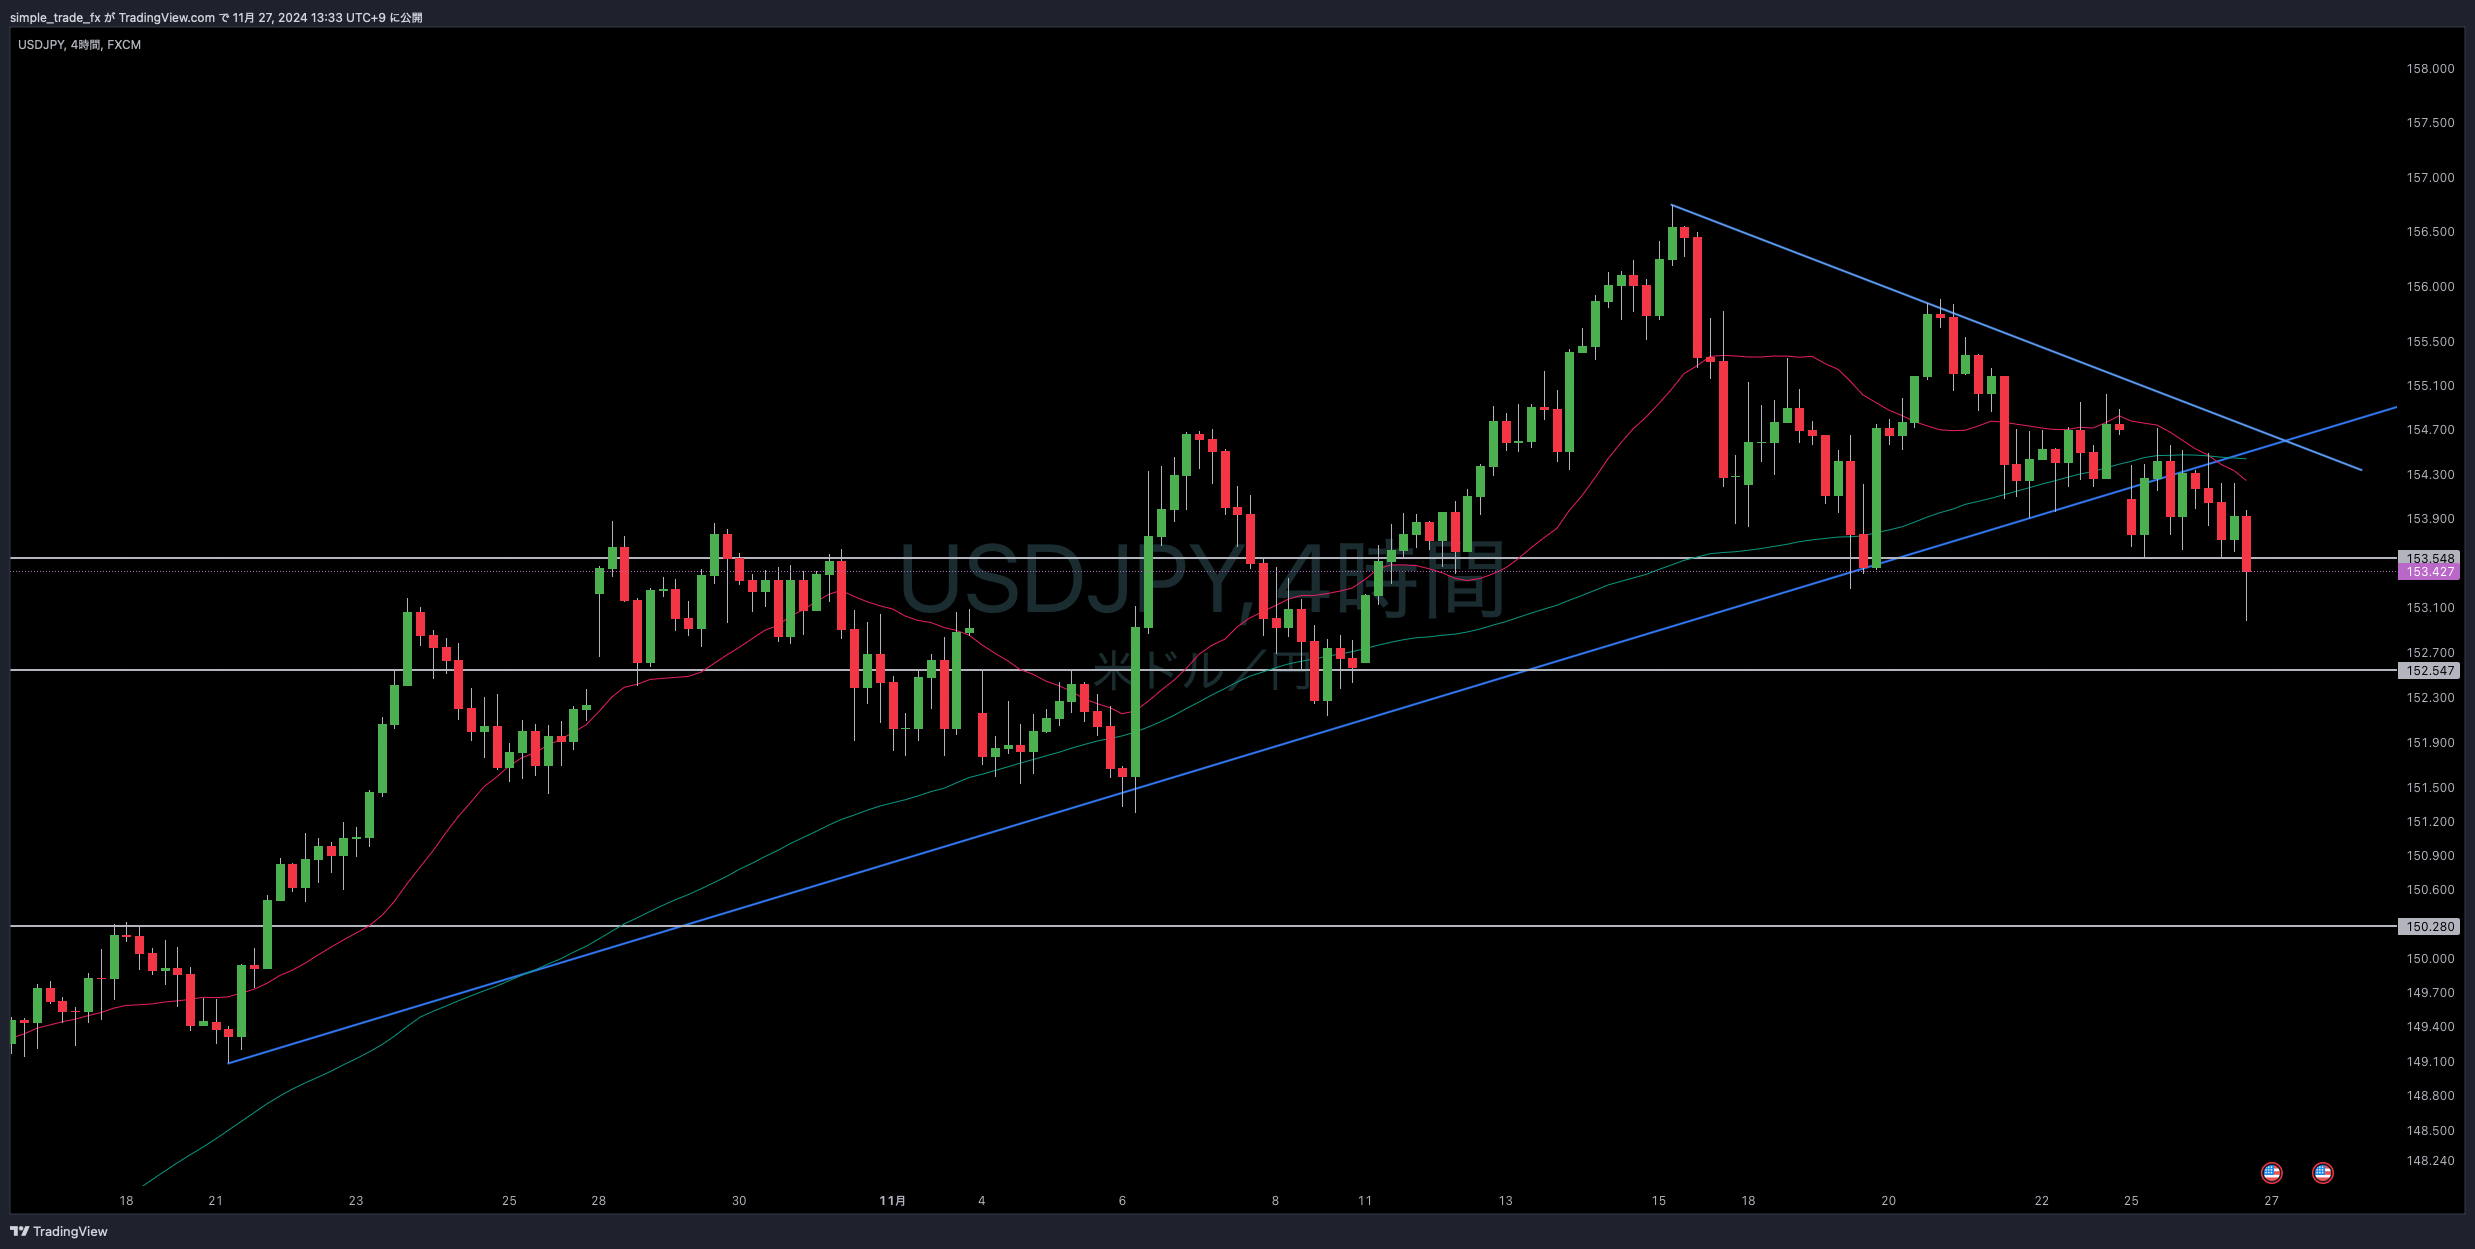
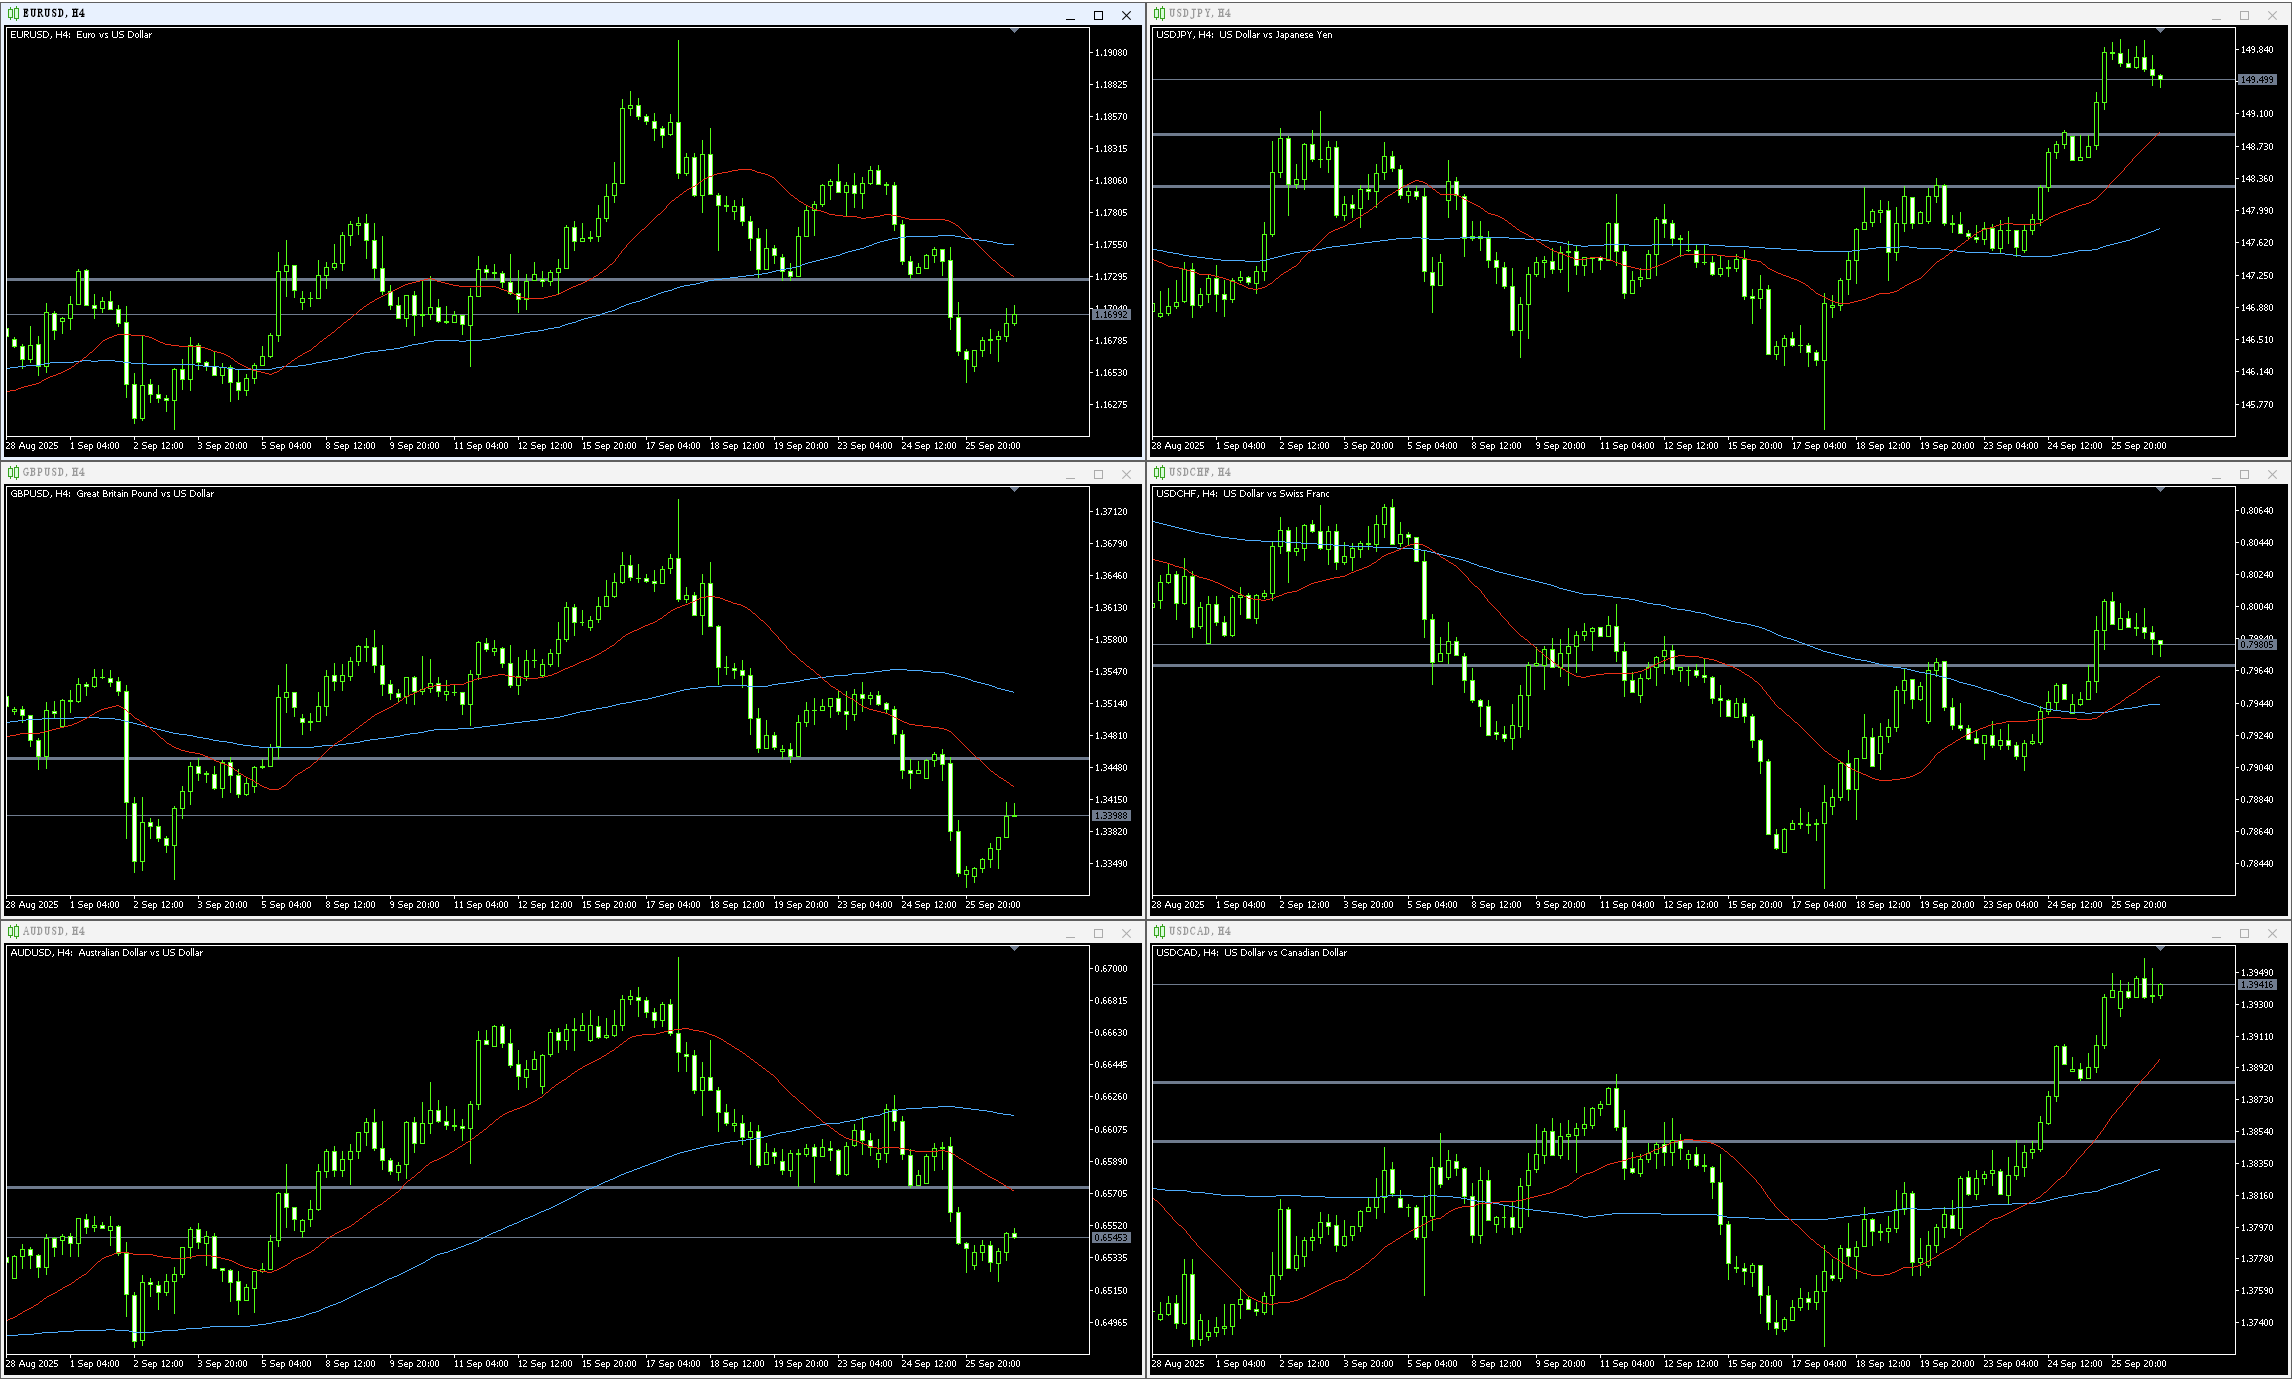
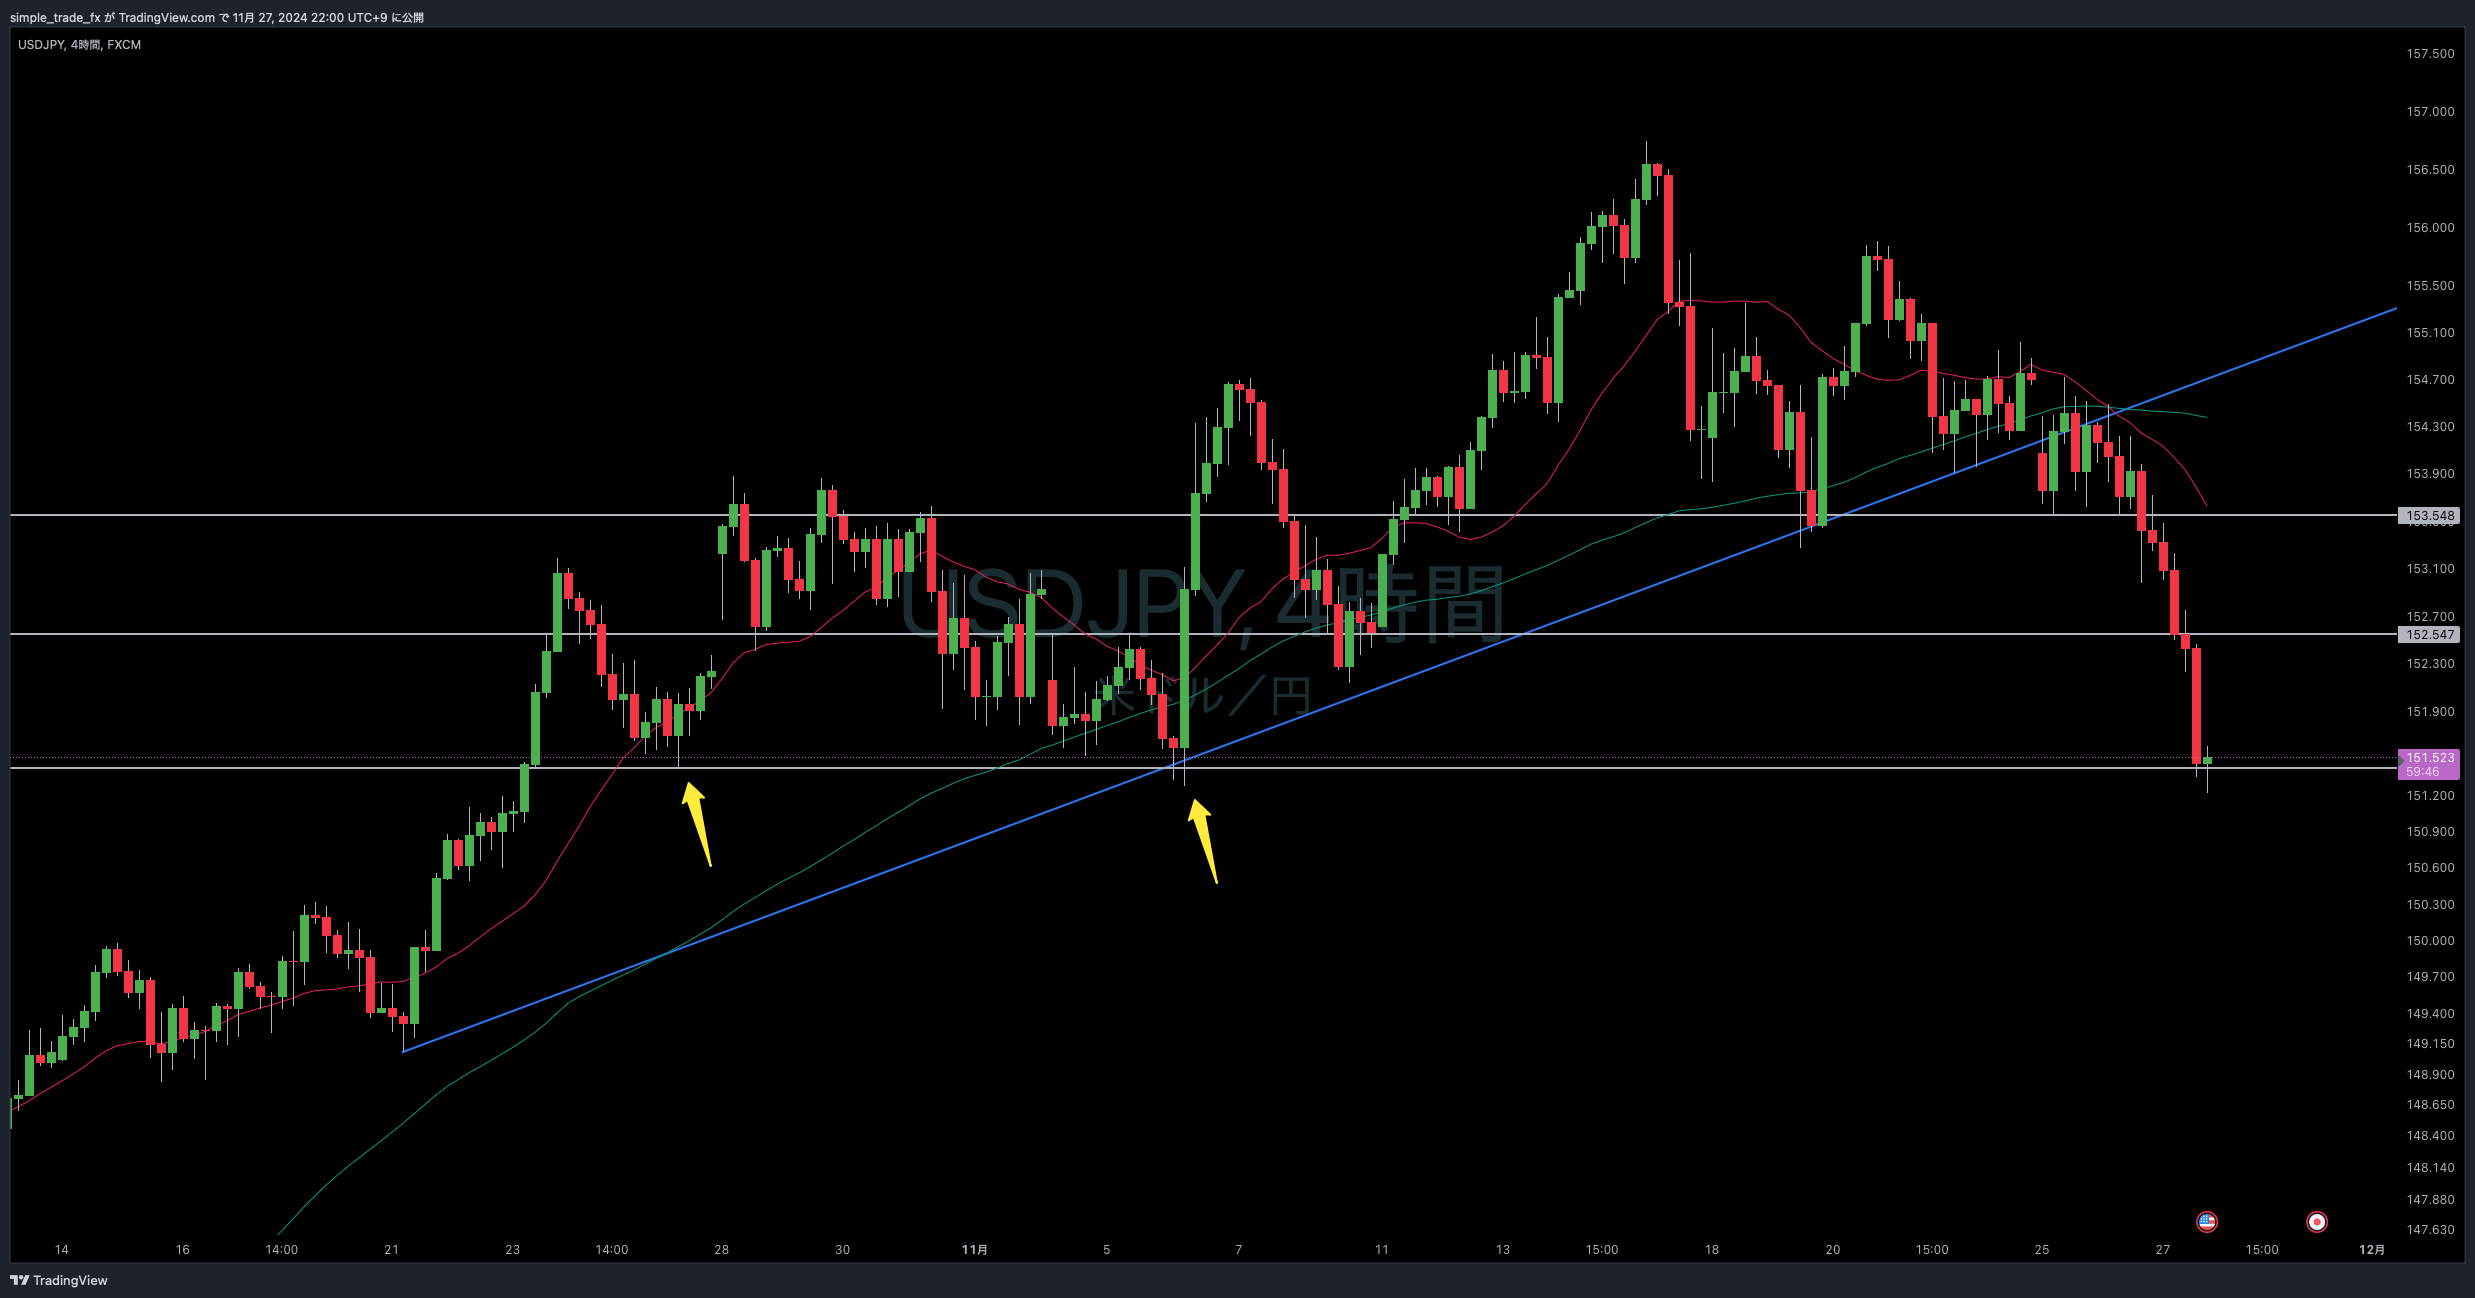
4-hour chart,
the triangle consolidation that had been observed in the weekend video began to move down after a pullback from a break below it
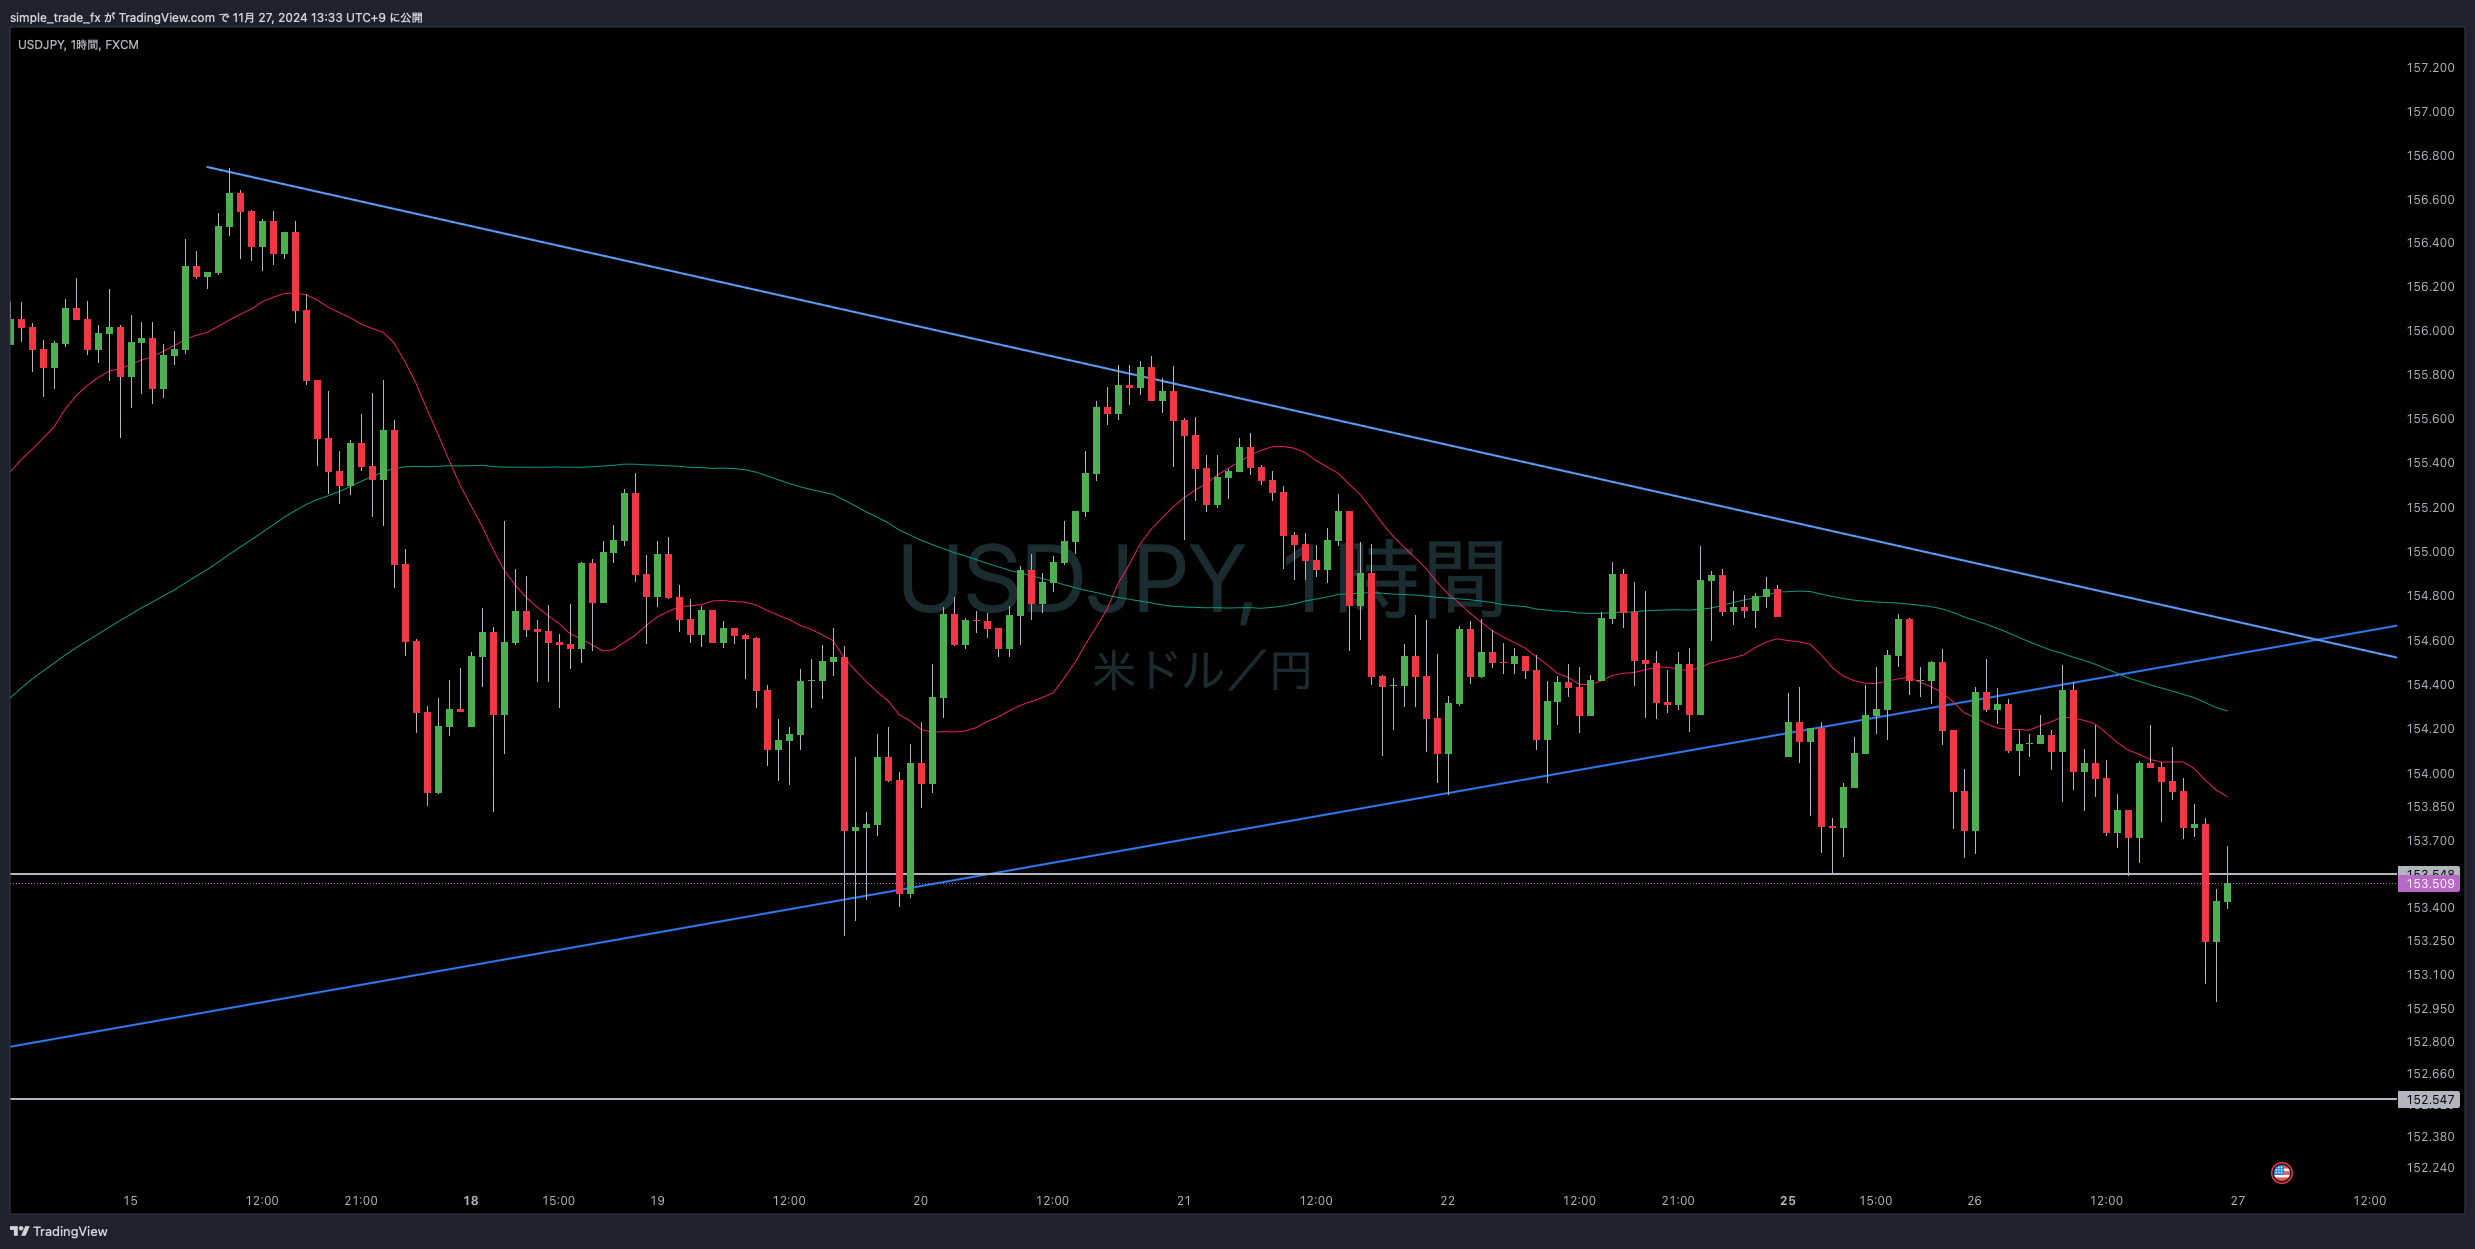
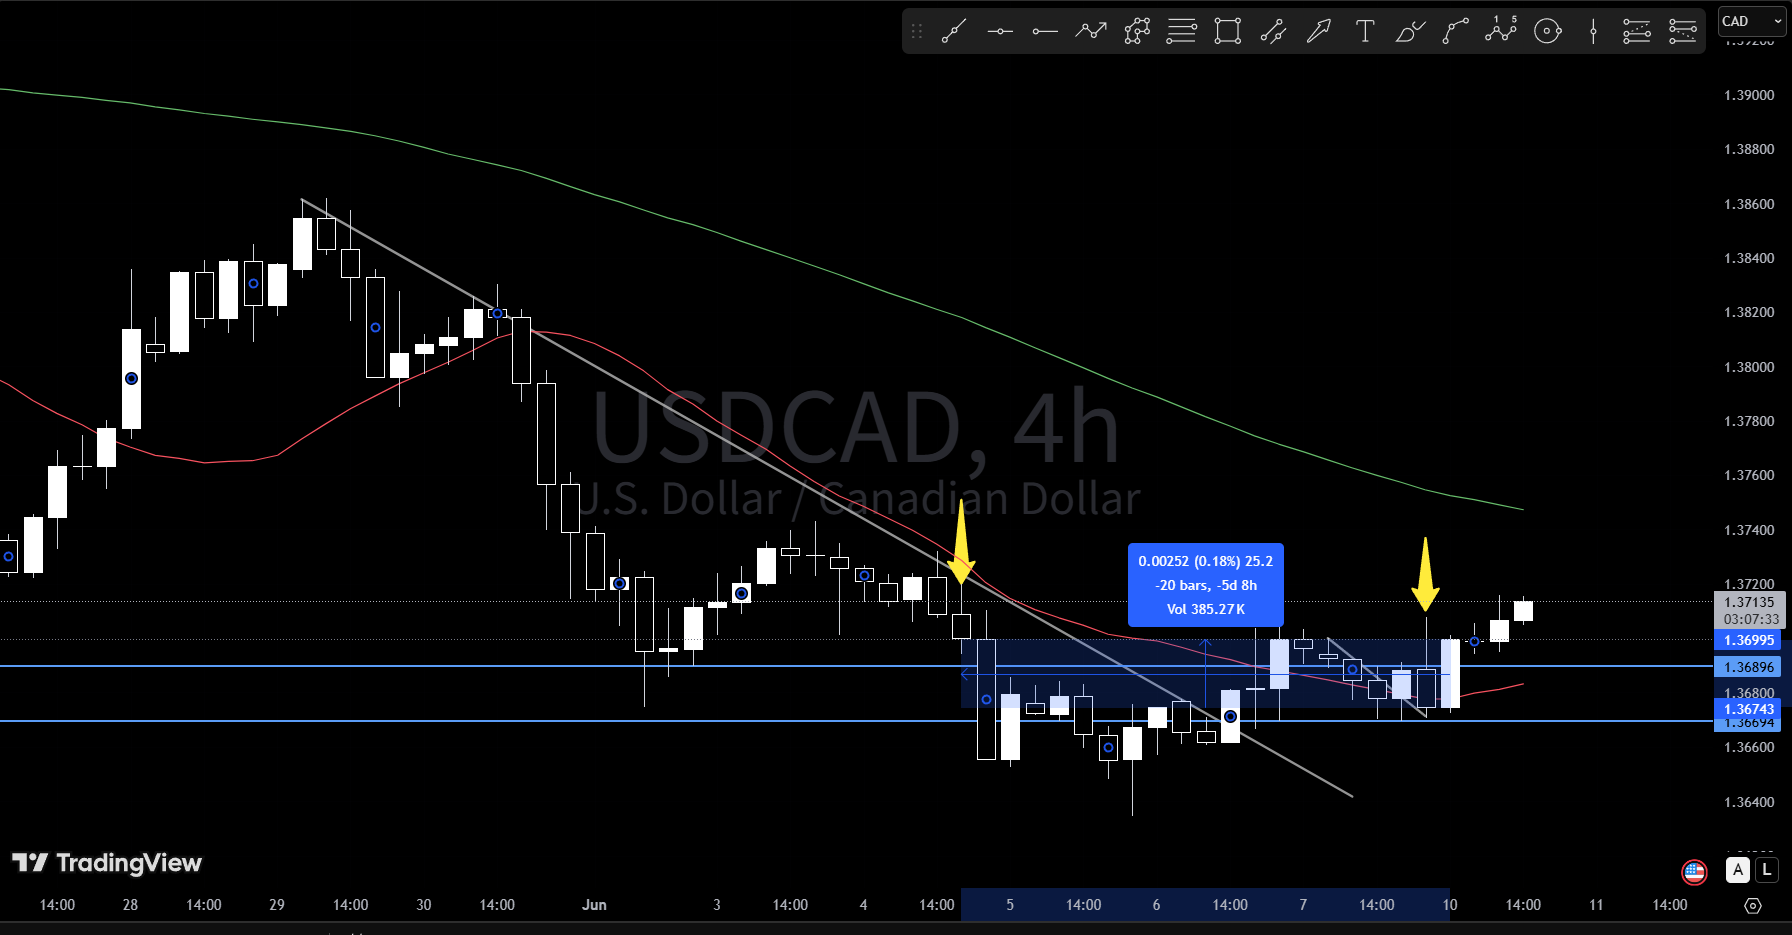
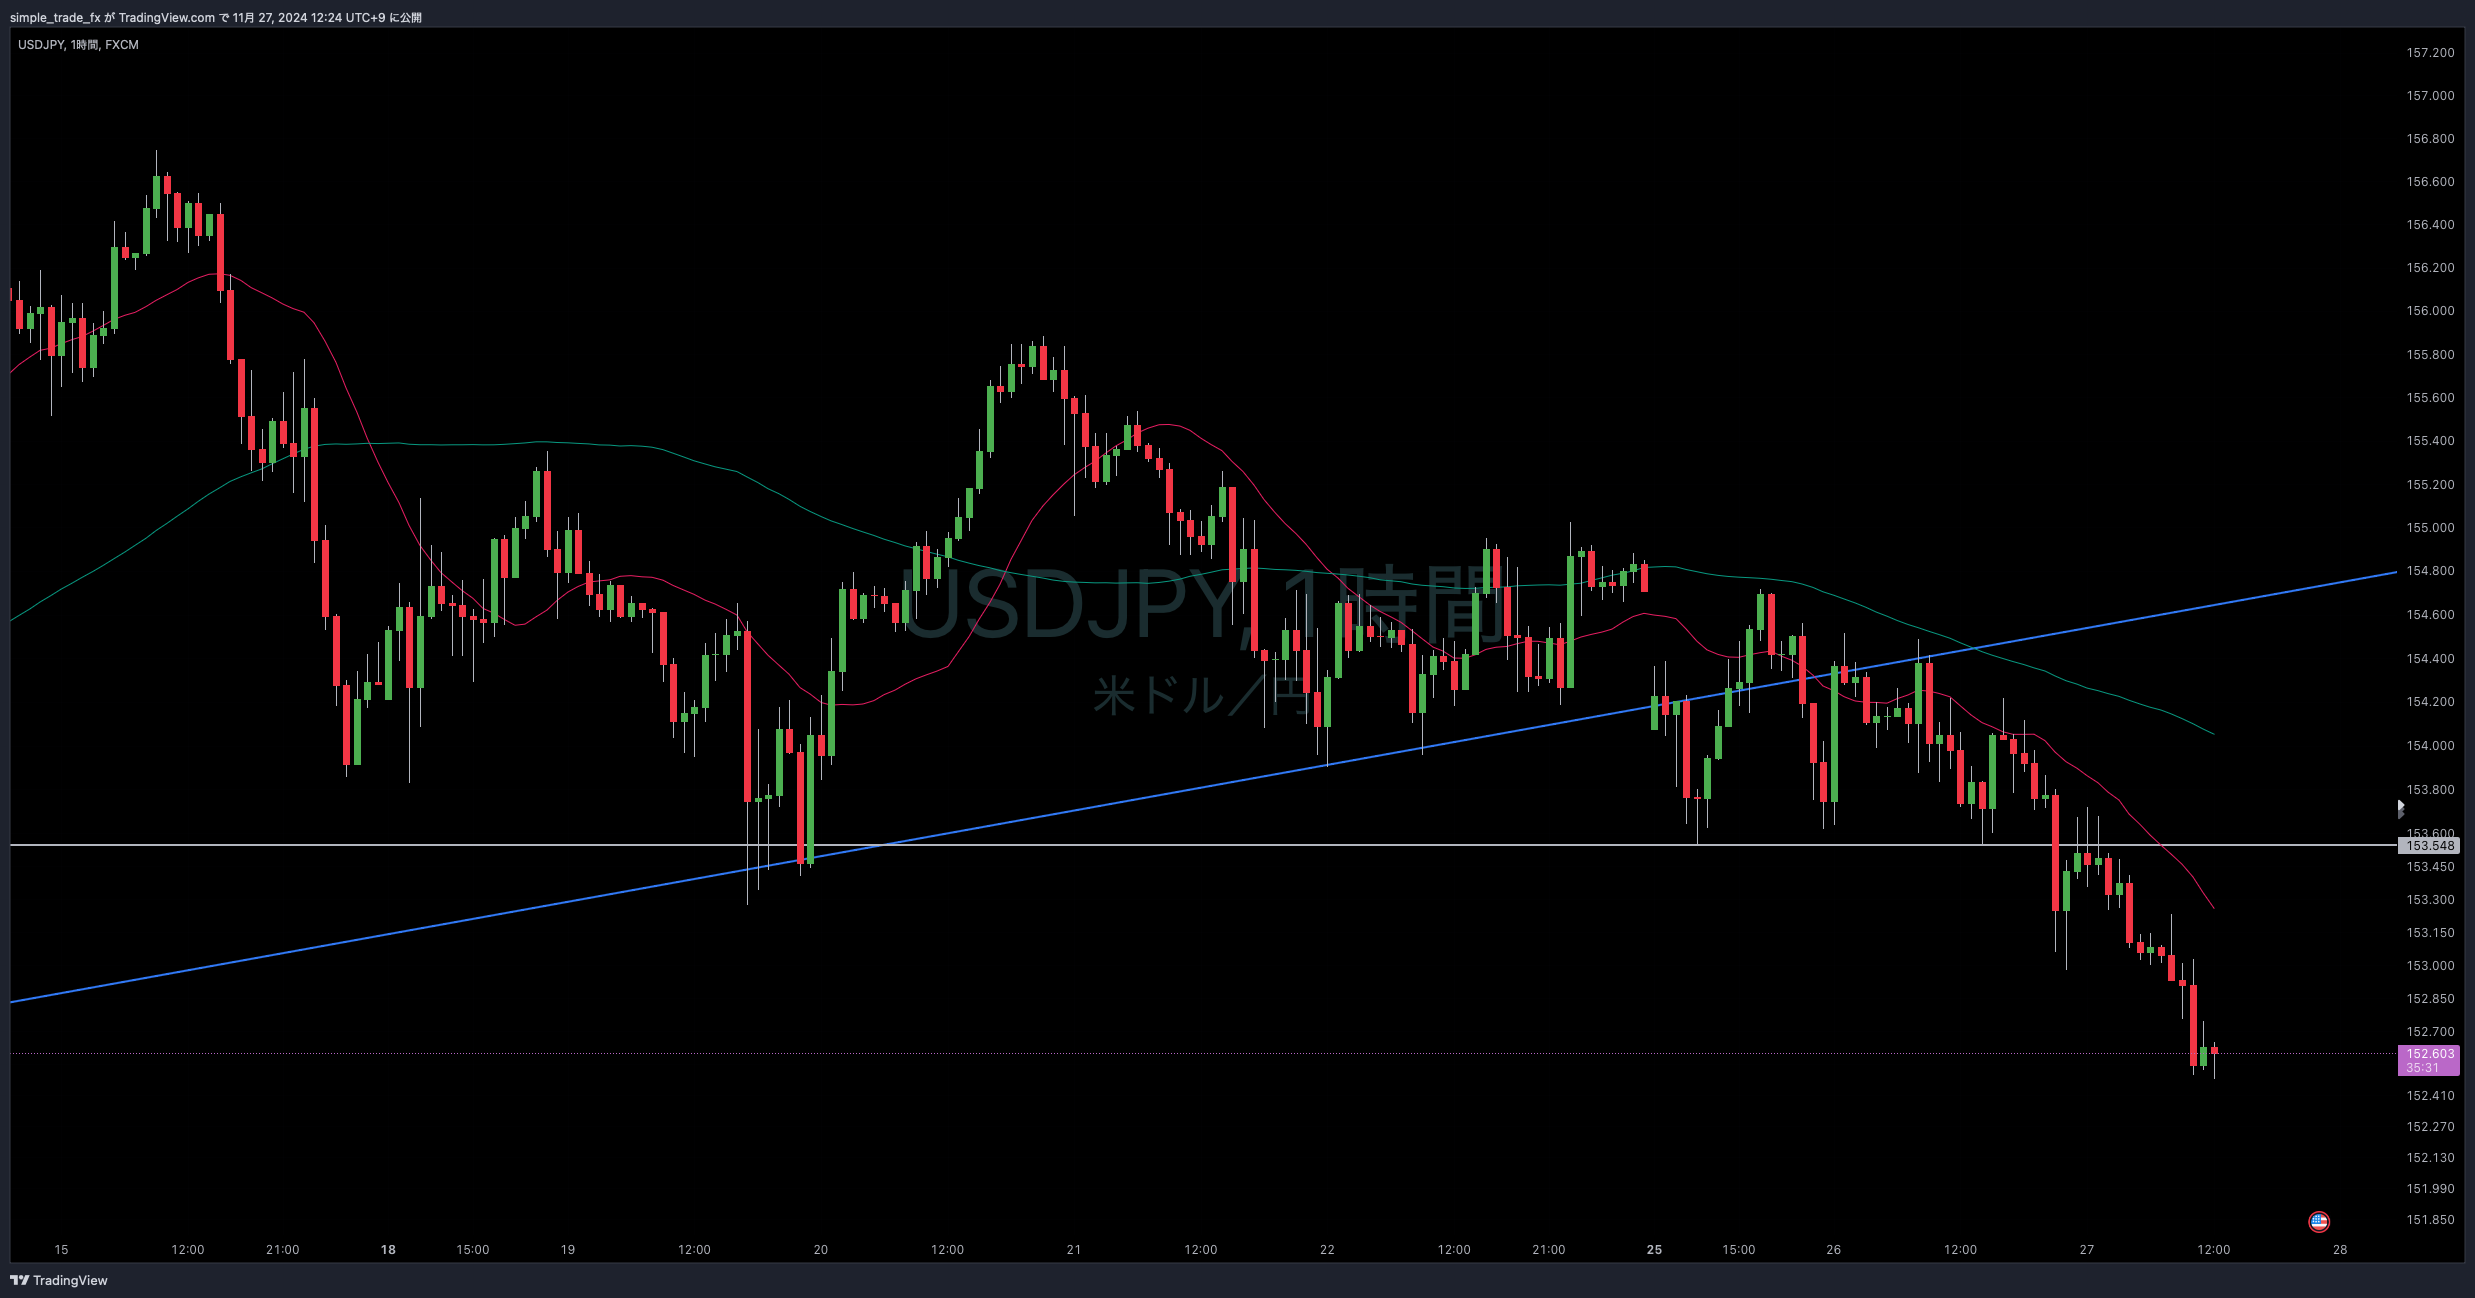
1-hour chart,
pullback after breaking below the upper white line support
near this support break, there were many wicks that returned, so I waited for a clear break once
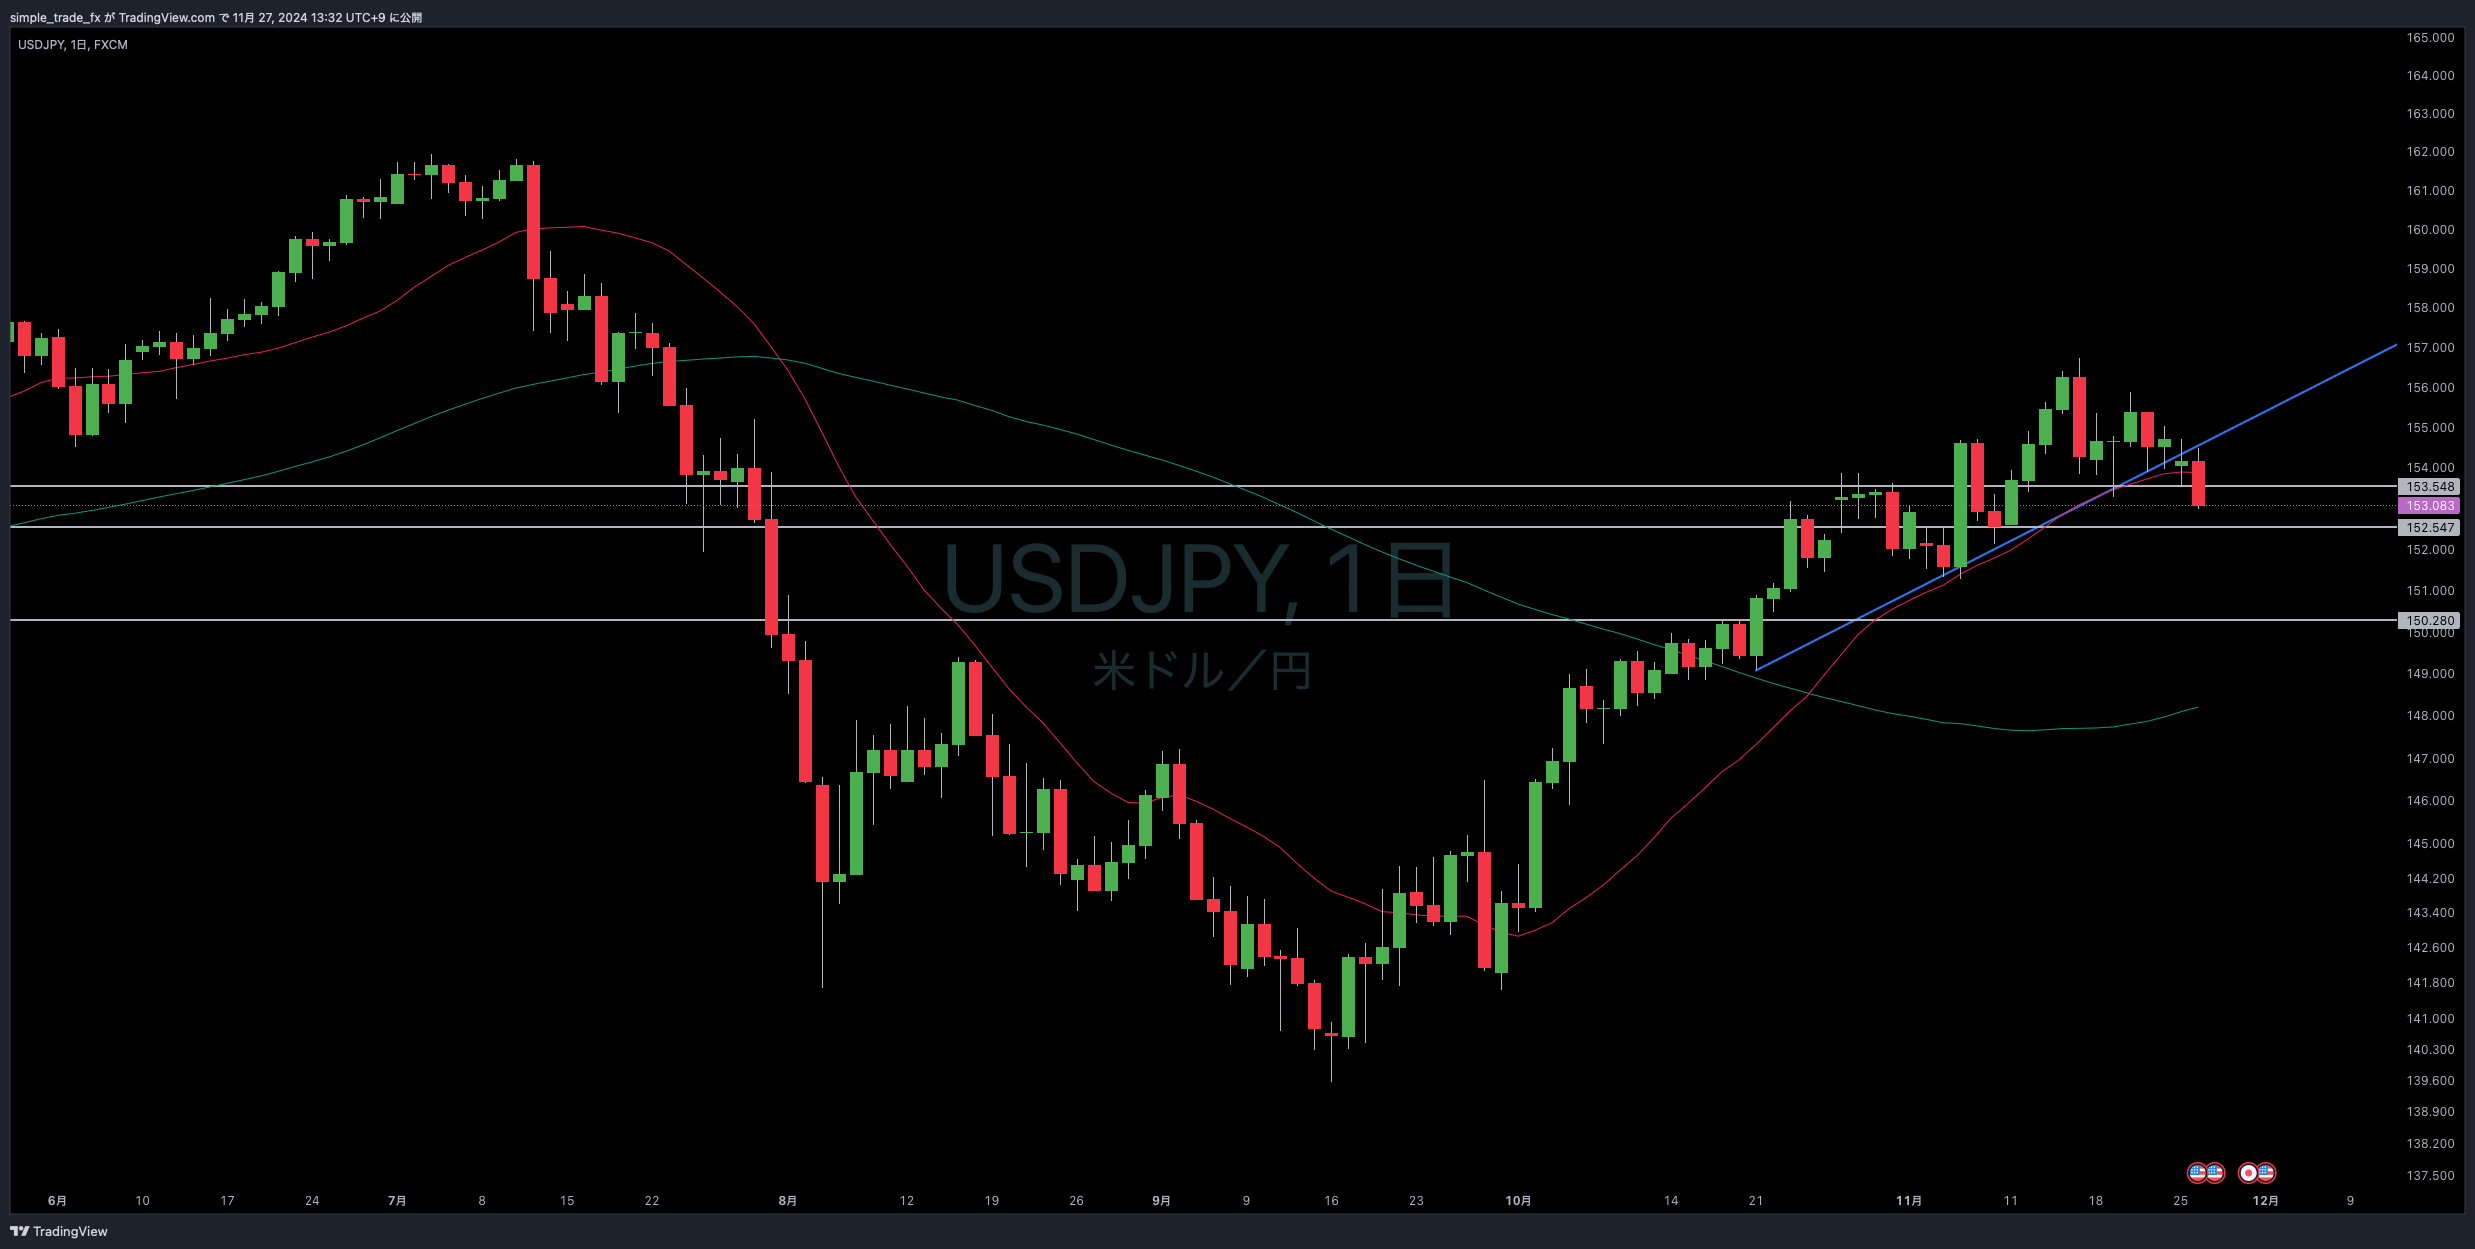
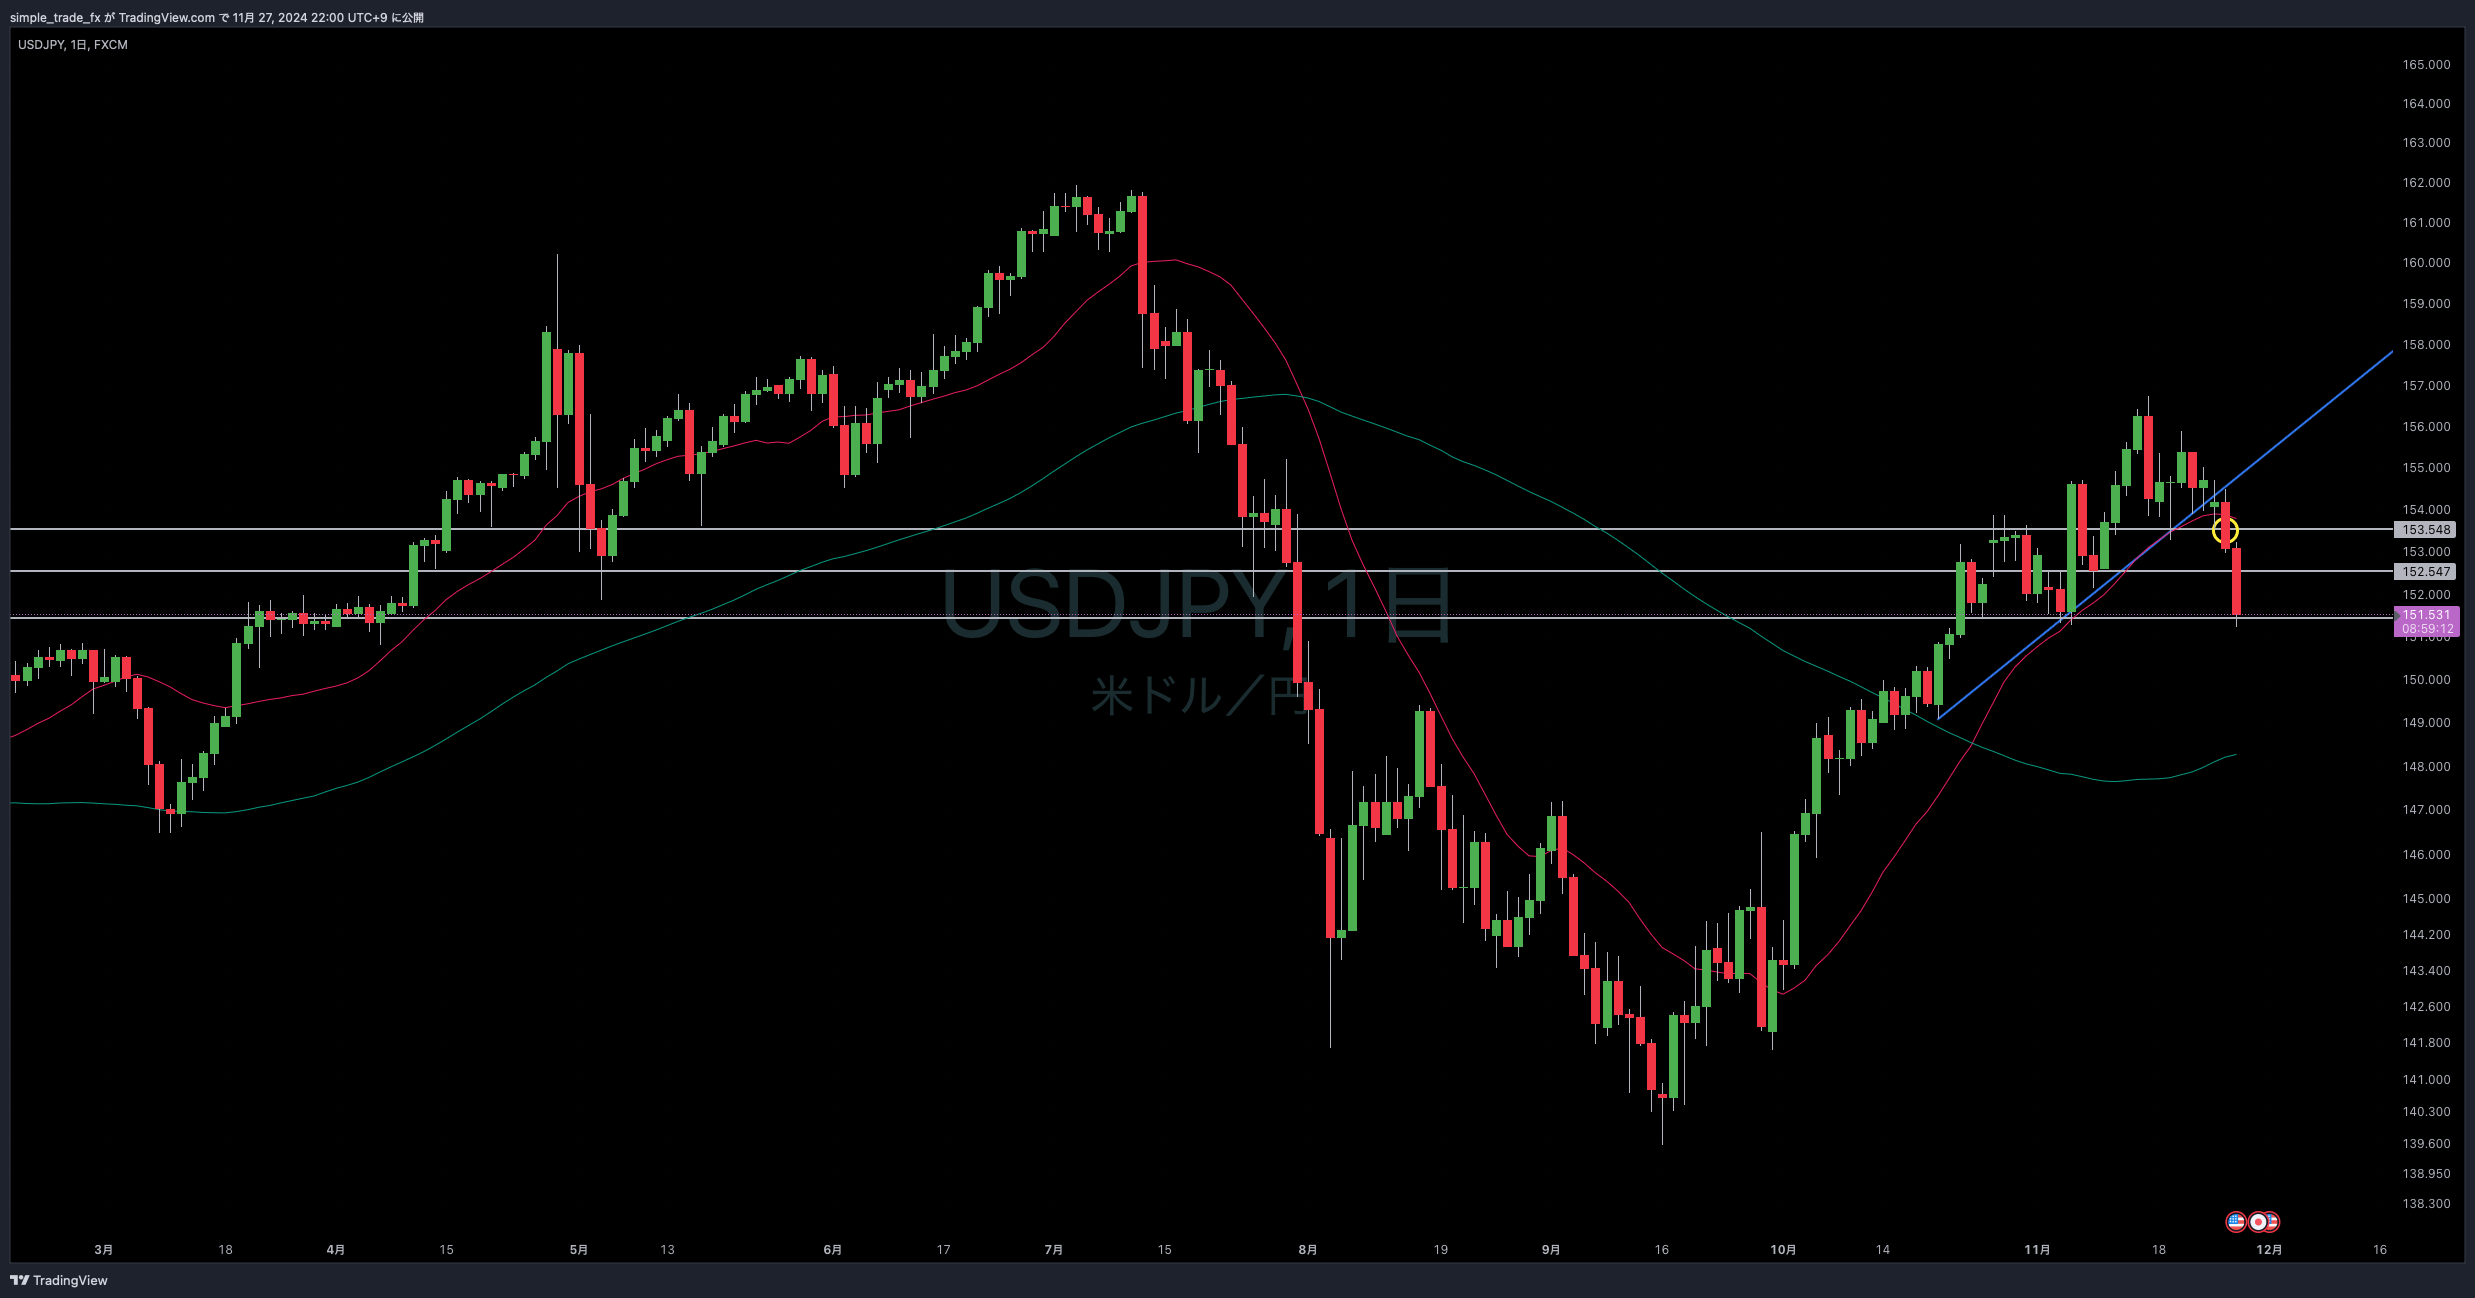
Daily chart,
after a prolonged uptrend, there was a tug-of-war around the high price area, and the moving average turned flat for a while before breaking down. It was a phase where a temporary pullback might continue
—
Entry screen ↓
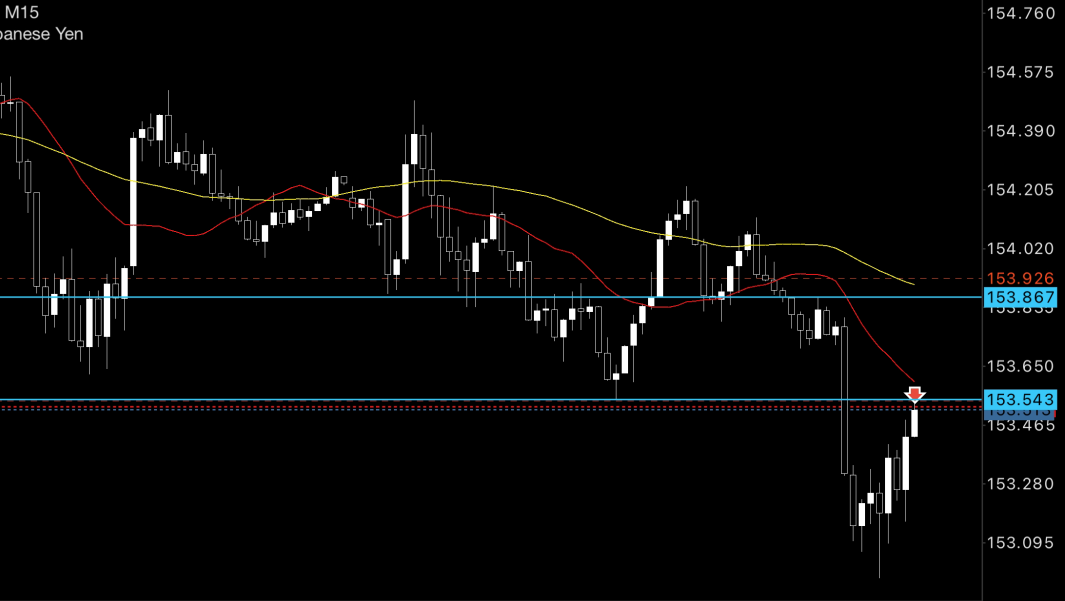
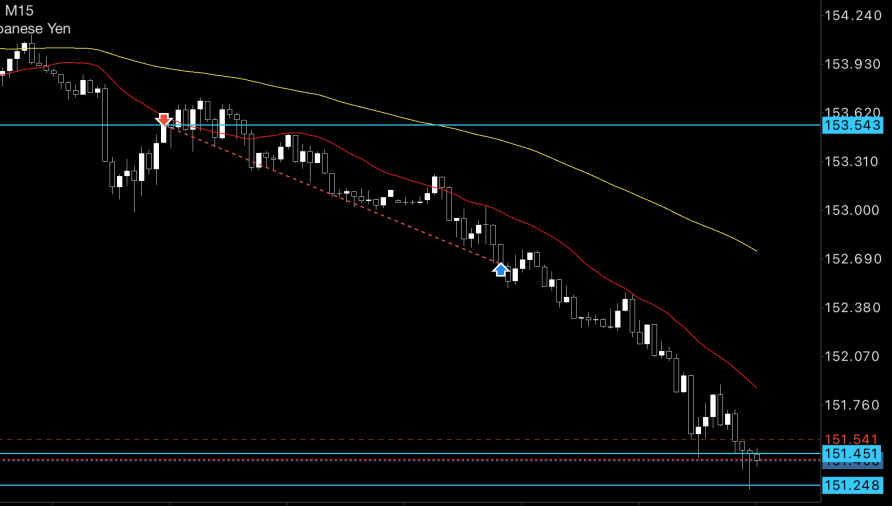
November 26 (Tue) just before 23:00, USDJPY short entry
After breaking below the support in the 1-hour environment view
When the 15-minute chart’s moving average and support retraced to the upside, I entered with a market order as it rose
Basically, I enter on lower-timeframe breaks like the neckline break as usual, but this time I waited for a break below the support and then entered on the retrace
I would like to go deeper into this entry pattern in the next article.
—
The next morning,
after updating the latest low, the decline accelerated and extended to about 1:2, so I took half profit and moved the remaining stop to the intraday retracement high, under the breakeven point
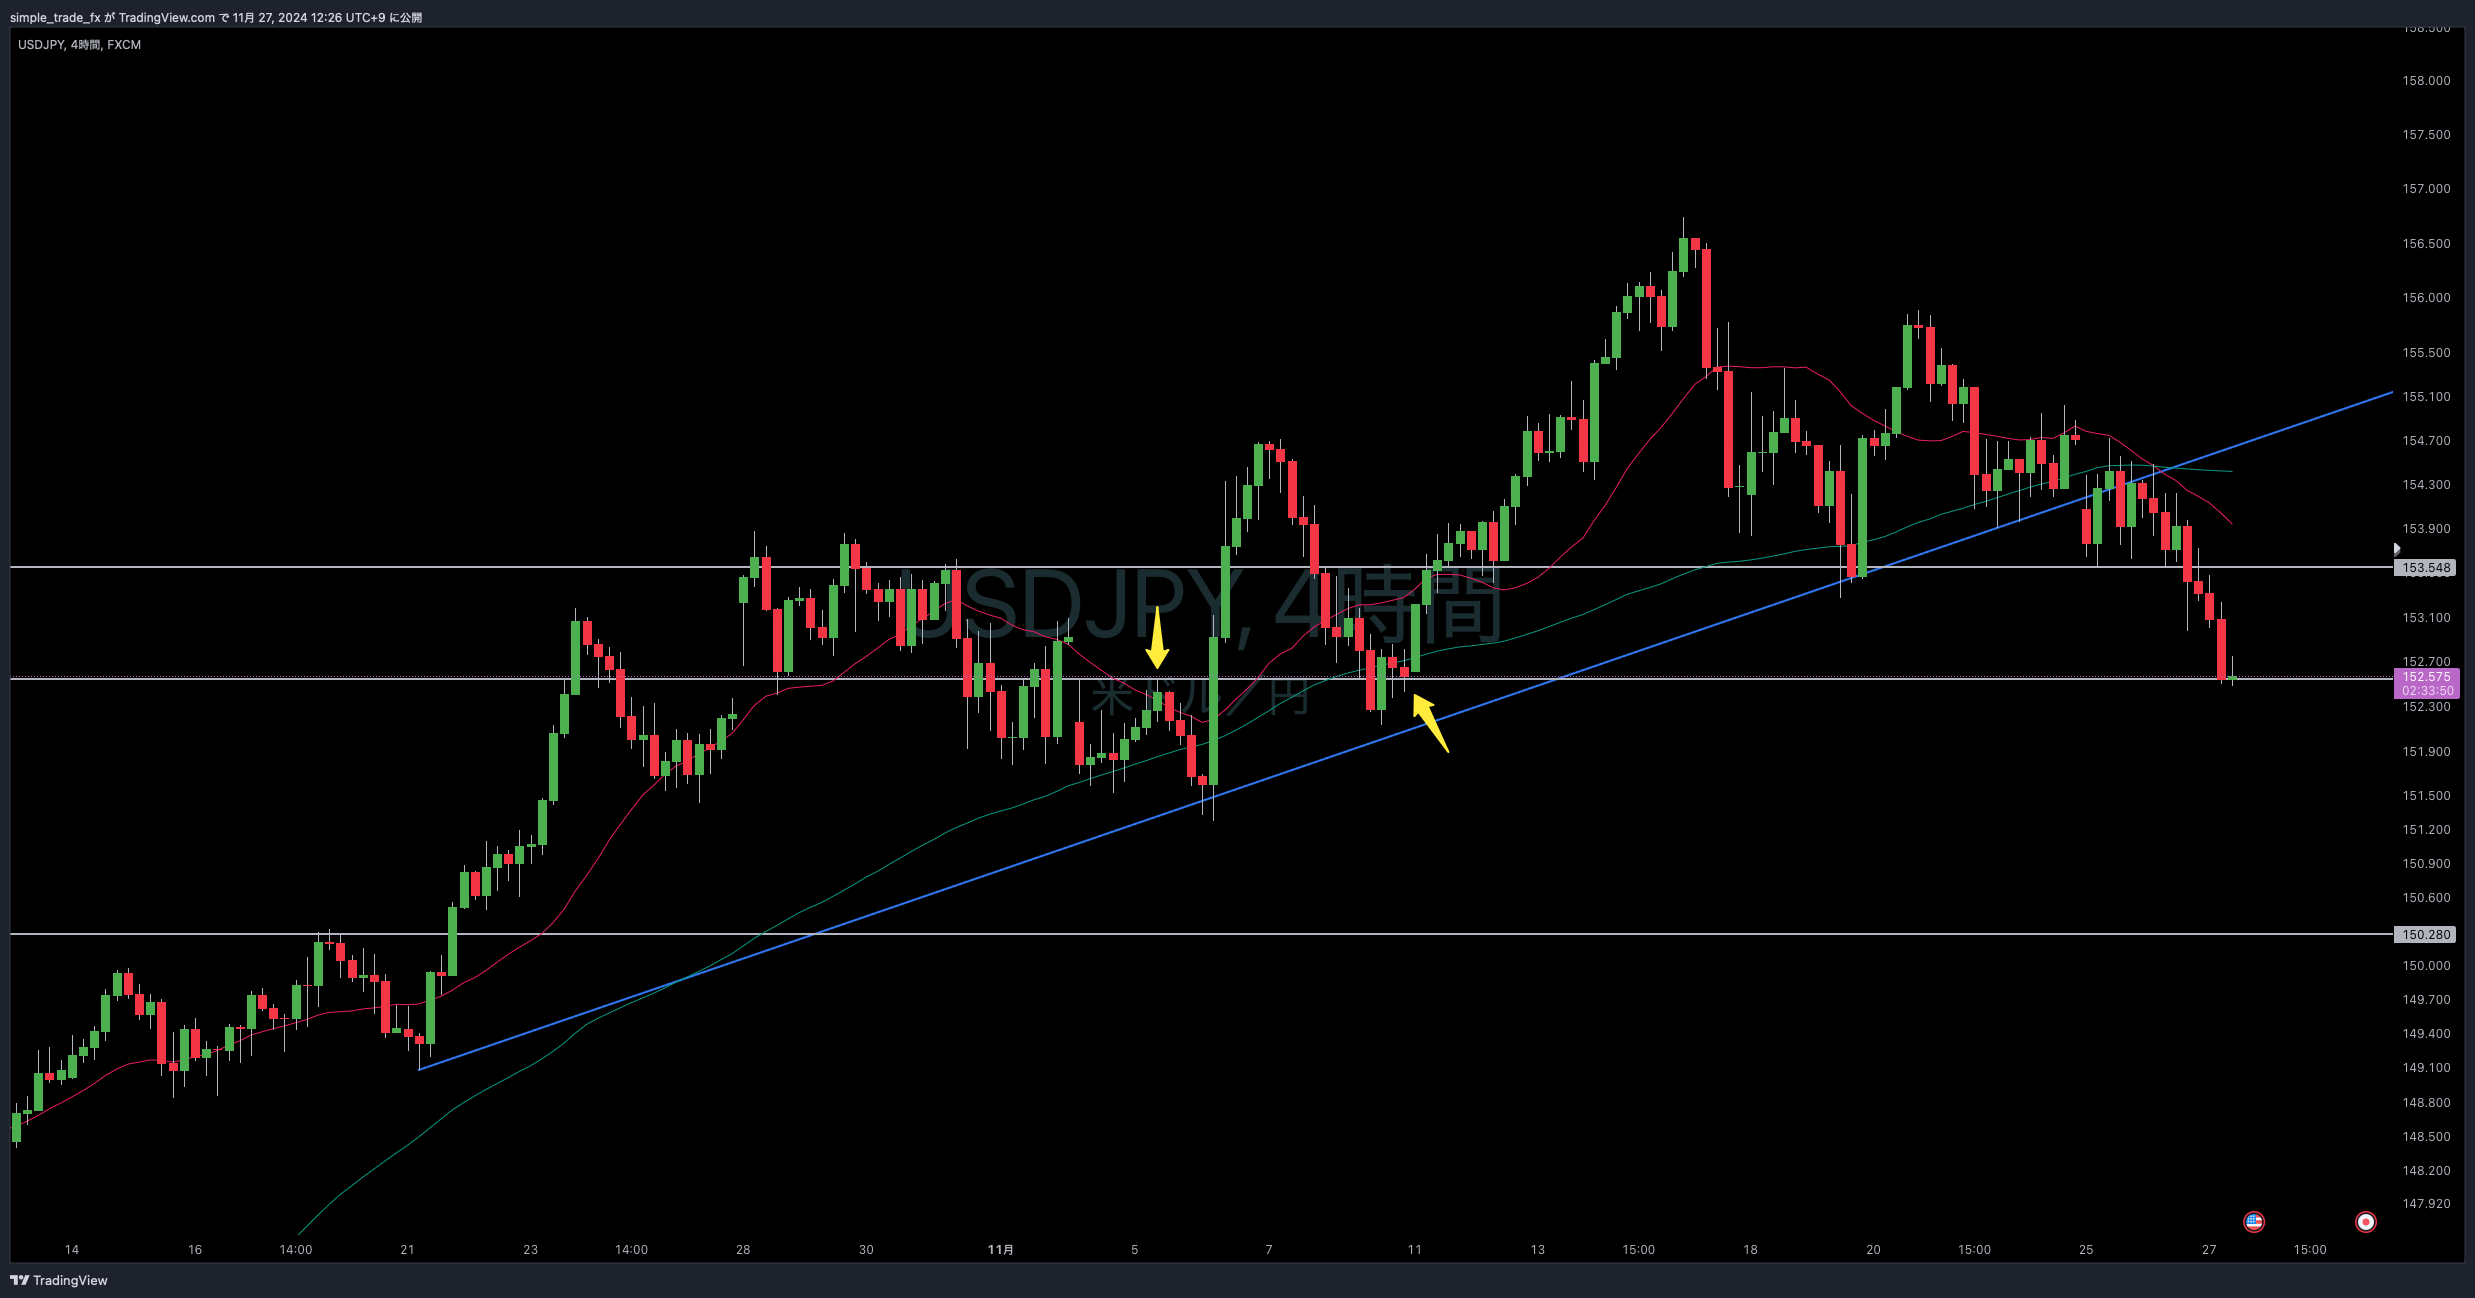
4-hour chart, this level corresponds to the neck line before the previous rise
since it was a strong drop and also aiming for a pullback, I closed half of the position at this extent
—
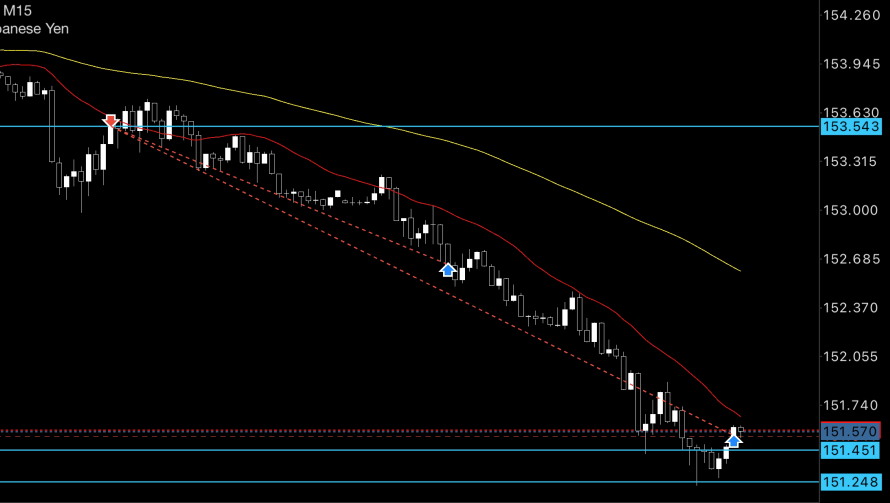
Even after profit-taking, the decline continued and the overall yen-buying move strengthened; the yen-selling had been retraced, and the concentration of stop-loss selling intensified the downward move
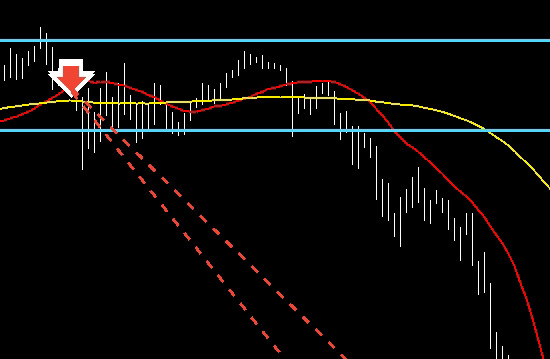
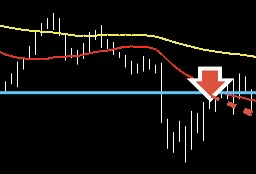
Around this area, I shifted the profit-taking to a priority settlement line (red dashed line)
Just after entry, it had surpassed 200 pips
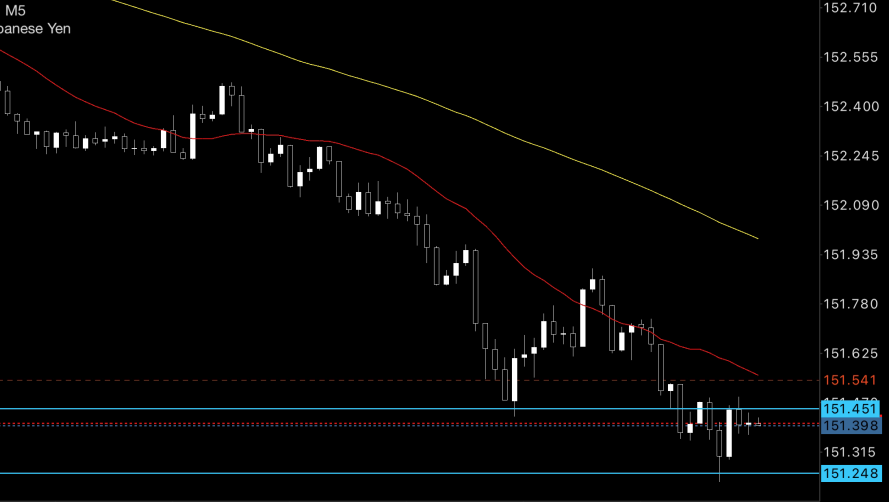
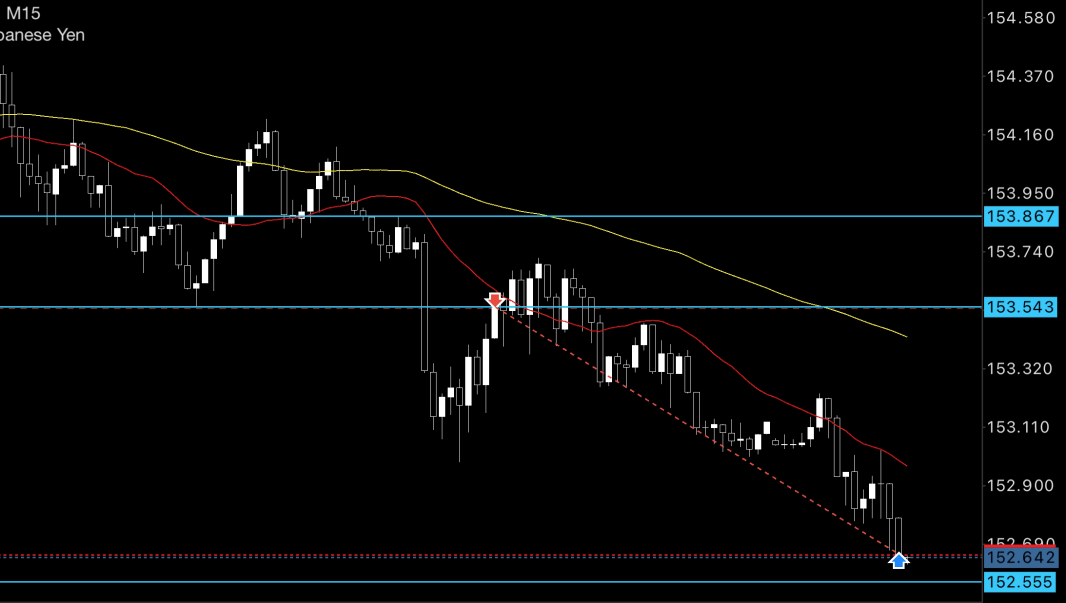
On the 5-minute chart, it is positioned like this,
if the small decline halts and the neck line of the rebound is surpassed, it can be settled
—
Subsequently, orders were placed and profits booked
The remainder yielded about 200 pips
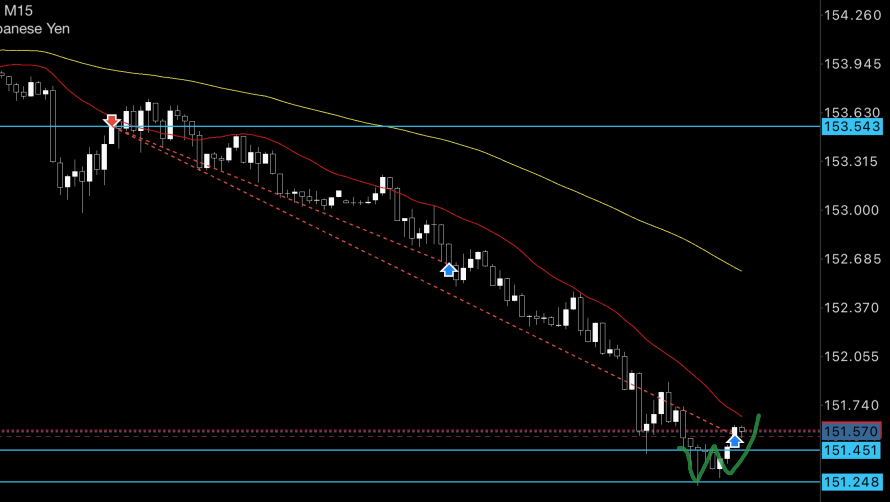
A double bottom with a neck-line breakout and rebound
This area is a support level where price previously rebounded several times; if it stops, there is no need to chase the rebound—settle
On the daily chart level, it is a shallow but visible supply-demand level
That is all for this time.
—