
[Today This Far and Next] New Millionaire Trader's Scalping - Volume Plus
Hello everyone.
As of this morning, the main point is whether the window will close or not.
Even in MT4 or GMO, it seems like the window closed at the exact high of 5:00 PM, or perhaps it didn’t close.
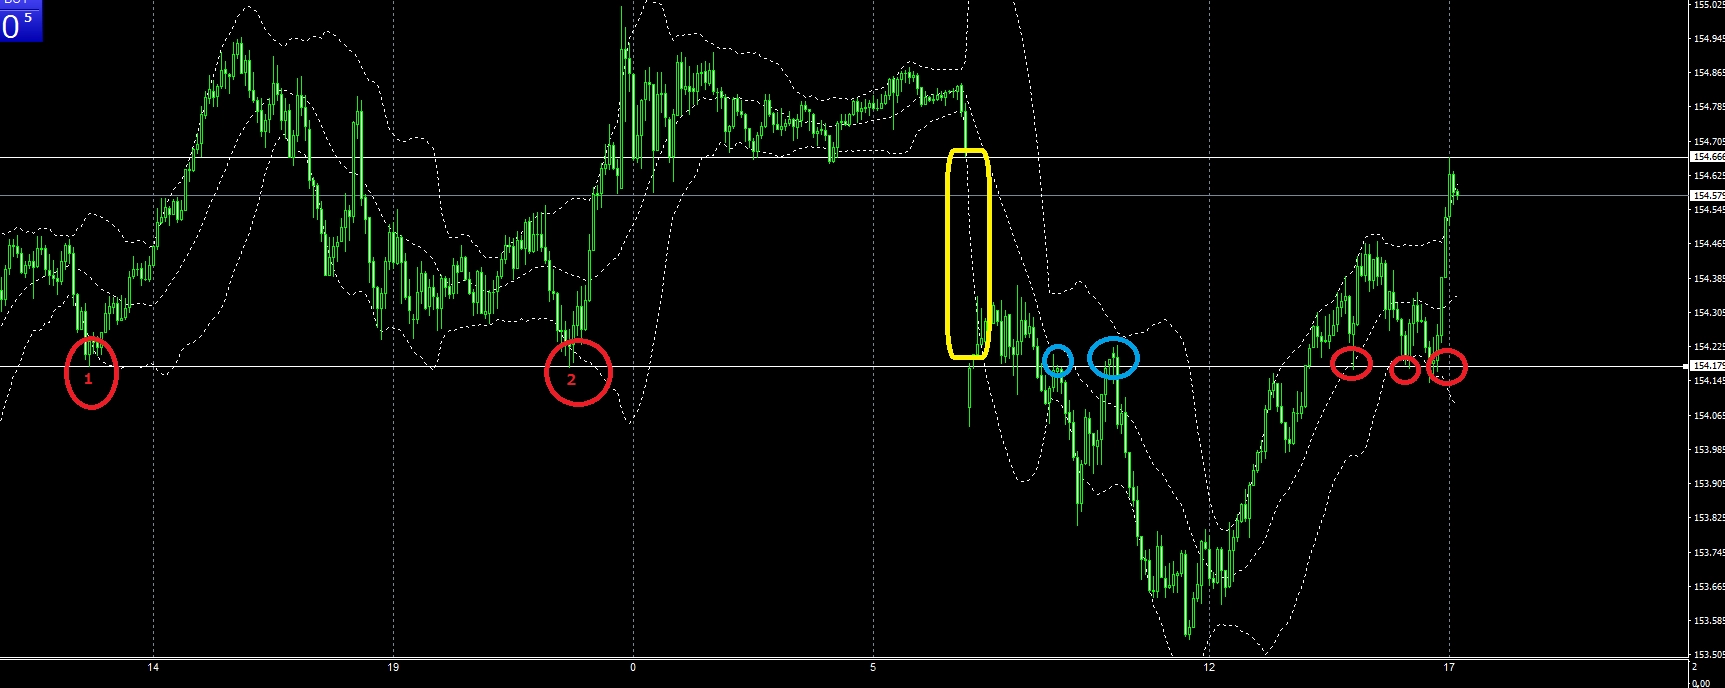
USD/JPY 5-minute chart

In the chart above, the weekend red circles 1 and 2 act as support, today’s blue circle as resistance, and then before London the red circle again as support, followed by a sharp rise before 17:00.
The high at 17:00 seems to reverse at the weekend’s closing support, but whether it will continue downward or rise again to make a new high remains to be seen.
Well, this is just from a broad 5-minute perspective.
What happens on the 1-minute chart?
USD/JPY 1-minute chart
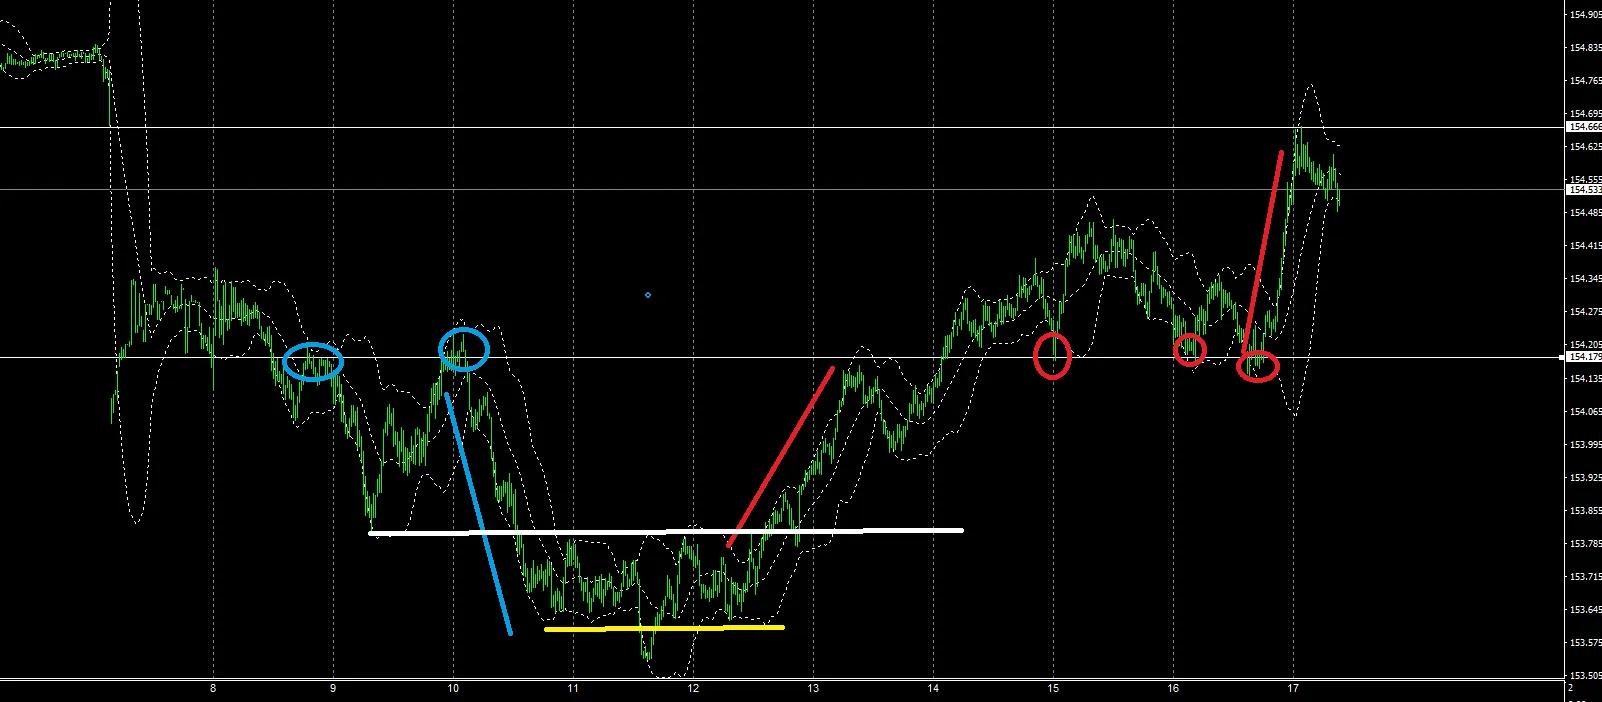
The chart, which had been range-bound until just before 12:00, sees buyers and sellers flip, and along the mega-trader long line the candles rise, but with the white horizontal line drawn it becomes easier to test long positions.
If there is a trend after a range, for mega-traders’ scalping, the next move should be upward, so the long bias applies.
At that time, it would be important to draw the white horizontal line and consider future scenarios.
This is hindsight, but if the low after 9:00 is the support, then the high near the yellow range that broke support acts as resistance.
What would happen if you break above that resistance?
You must always keep that kind of thinking in mind.
The reason is such situations occur many times.
It’s necessary to memorize it mechanically and test positions mechanically.
The window completely closed before 18:00.
On the 1-hour chart, it’s at a support level; from here, will it wobble a bit and move in either direction?
Since it’s Monday, overly chasing is forbidden.
From now on, mega-trader short-break lines are in play.
With about a 1-yen rise from the low, I’d anticipate a drop to around 154.12.
The rise would be after exceeding Friday’s high.