The Truth Market Investors Should Know: Risks of Market Close and Economic Indicators
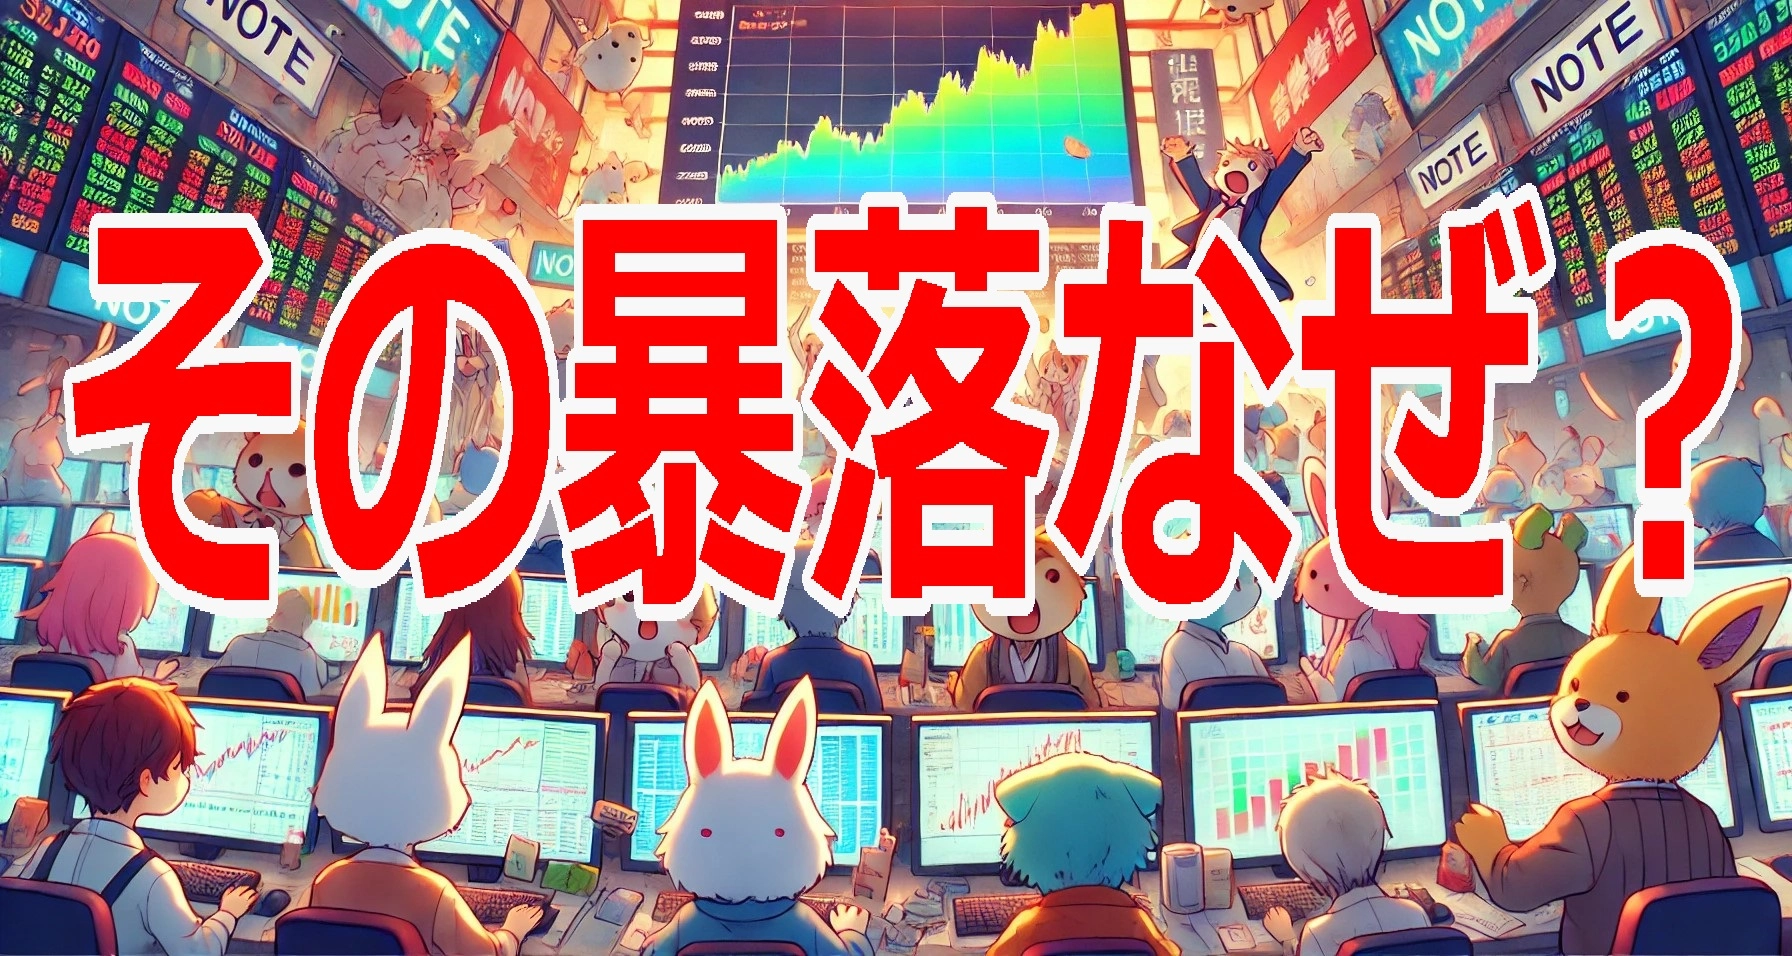
A few years ago, in a daily trade, I decided to close a profitable Nikkei 225 position a little before the market close. At that moment, it looked like I could gain at least 100 yen, so I boldly pressed the settle button, and at that exact moment,the price dropped sharply by about 150 yen, and my exit was executed near the trough of the plunge.
Although I panicked and was unsettled by an unforeseen sudden movement,“What on earth happened?”crossed my mind.
If you trade for a long time, you may have had experiences like this. However, I cannot simply categorize this as a mere “accident.”
When I calm down and reflect on this experience, I consider market characteristics before the close and the movements of institutional investors as possible influences. In this article, I will explain the risks around the close and around key economic indicators, why similar phenomena occur during those times, and ways to avoid them.
■ Market characteristics before the close
- Decreased liquidity:Just before the close, trading can settle down and liquidity may drop. In such conditions, even small orders can move prices, increasing the risk of sharp fluctuations.
- Institutional investors’ position adjustments:Institutions tend to close out intraday positions before the close. When profit-taking sell orders cluster, prices can move significantly. This behavior is hard for individual investors to predict, yet it has a major impact on the market as a whole.
- Impact of high-frequency trading (HFT):Algorithms doing high-frequency trading target illiquid times and process large orders in an instant, moving the market. Individual investors caught in this movement may not be able to trade at their intended price.
- Slippage occurrence:As in my case, slippage can occur before the close during sudden movements. Slippage means the price at which an order is placed differs from the price at which it is actually executed. In rapid price changes, slippage is particularly likely with stop-loss or market orders.
■ Common risks around major economic indicator releases
In addition to market characteristics before the close, similar risks exist around important economic indicator releases. For example, events that attract market participants’ attention such as US employment data, central bank policy rate announcements, GDP, and CPI can lead to the following phenomena.
- Market participants’ psychological tension:Because the market can move significantly depending on the results of the indicators, many investors adopt a wait-and-see stance. As a result, liquidity decreases before the release, making prices more volatile.
- Sharp price fluctuations:Immediately after the release, a flood of orders hits the market. This can cause prices to move drastically in a short period, causing losses that individual investors may not anticipate.
- Fakeouts (traps):A temporary price move after the release can reverse direction from the actual trend. For example, a drop right after the release followed by a rapid rise is a typical pattern.
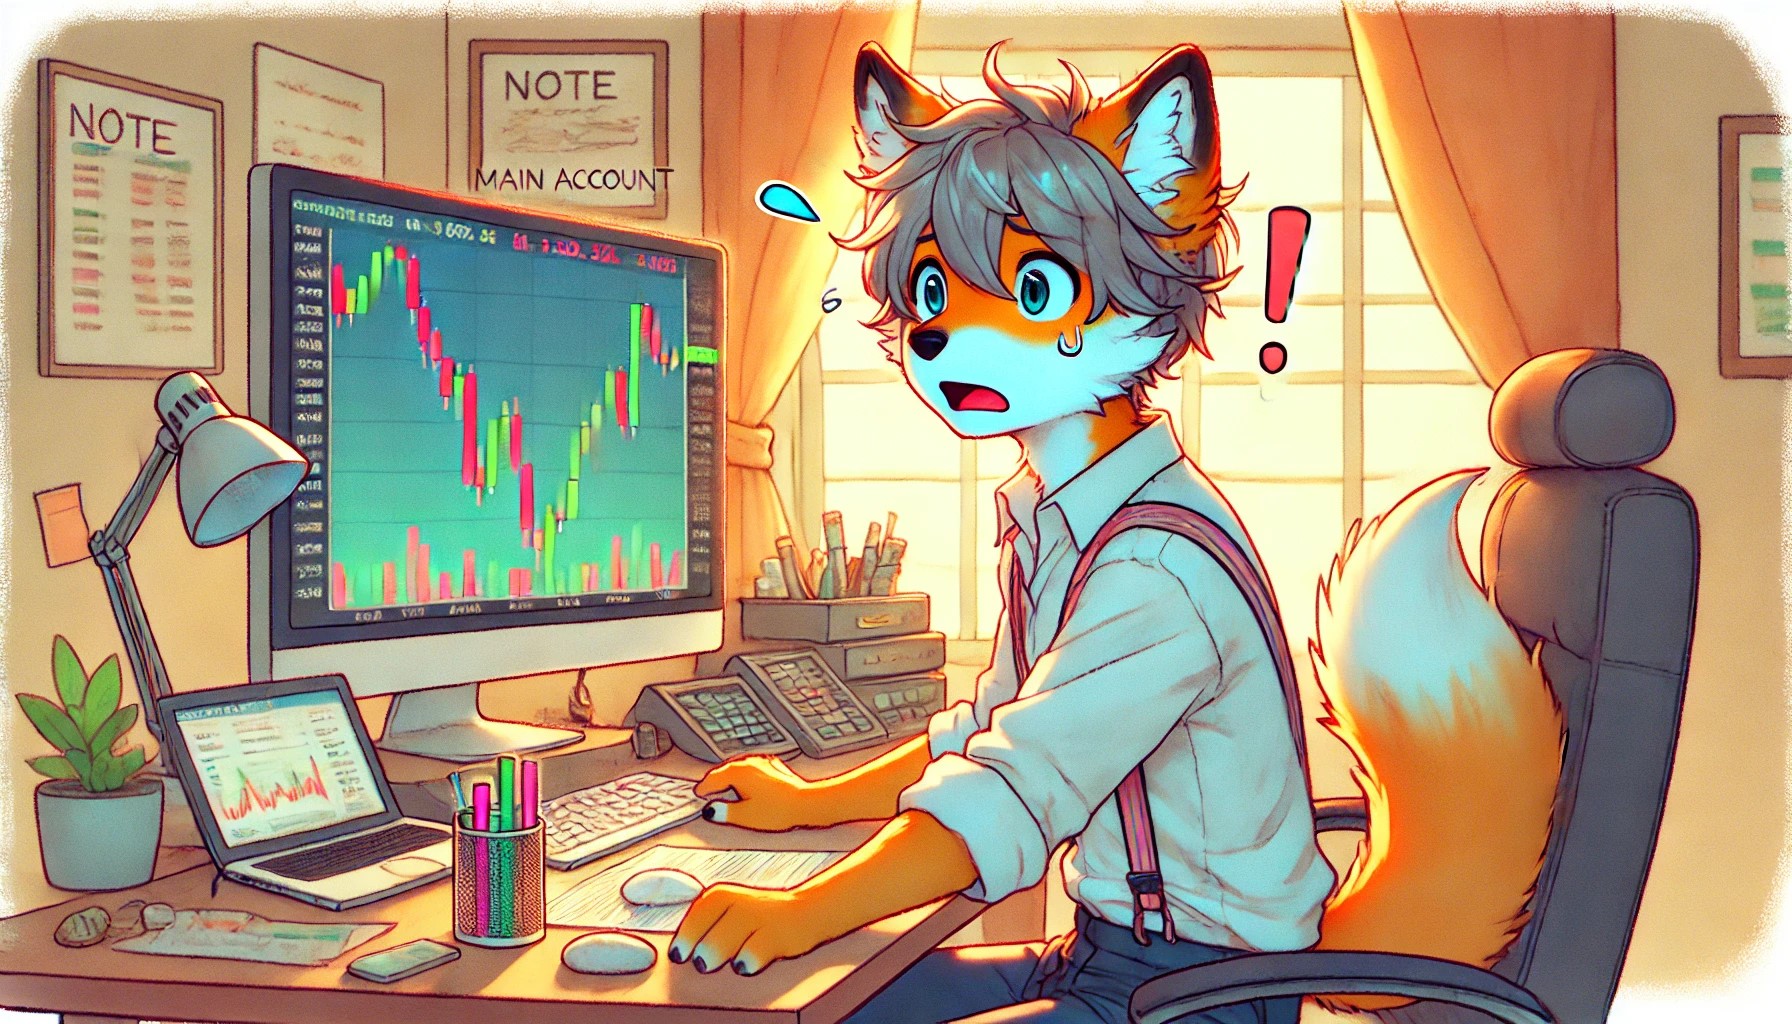
- Spread widening:The immediate post-release volatility can temporarily widen the bid-ask spread, increasing trading costs and making trades more expensive than expected.
■ How to avoid risks
Completely avoiding these risks is difficult, but they can be mitigated with the following approaches.
- Avoid trading around releases:Avoid trading before and after the close or around major economic indicator releases. In particular, from 10 minutes before to 30 minutes after a release is considered a time of high volatility.
- Use stop orders:Using stop orders helps lock in profits and limit risk. However, during sudden movements, slippage can still occur.
- Utilize information and volume:Monitoring order book depth and volume helps identify price ranges where orders concentrate. This makes it easier to predict rebounds or breakouts at important price levels.
- Check an economic indicator calendar:Before trading, check the schedule for economic indicator releases. There are tools that display indicators on charts, so use them. By avoiding high-risk times in advance, you can prevent unexpected losses.

■ Turning failure into a learning opportunity
My experience this time was a large slippage due to sudden movement before the close, but similar risks can occur at economic indicator releases.
In my case, if I had not pressed the settle button, the price would have recovered after the crash, so I would not have incurred a loss, but because I pressed the settle button at that moment, I could not stop it.It’s already an “accident,” and there are parts that cannot be avoided, so it’s necessary to accept it as one experience.
Additionally, when facing these situations, maintaining composure and controlling emotions is important. Many successful investors learn from failures and apply those lessons to future actions.
However, if I had a deeper understanding of the charts, perhaps I could have predicted that crash.Prop trader Mr. Aizawa says to view charts in three dimensions, including the backside of the chart.
What lies behind the chart is not just price and shape movements, but the psychology and actions of traders, the market’s mood, and the movements of participants. By understanding these, you realize that a chart is not just a collection of lines, but a tool for reading the overall market. Source: Ryosuke Aizawa’s 10 Million Day Trading Techniques
What matters as a trader is to turn failure into learning and apply it to your next trade. The market has unpredictable movements, but by understanding them and responding calmly, you can trade more stably.
Also, for individual investors to stand on a stronger footing, it is essential to sharpen skills to identify favorable entry points by leveraging market volatility.
■ Never miss economic indicators
Before the close or during economic indicator releases, risks such as institutional investor behavior and slippage are heightened, making these moments critical. By understanding these risks and taking proper measures, individual investors can trade calmly and efficiently.
In particular, always display economic indicators on your charts so you can check them easily.In the One-Click FX series, economic indicators are shown on charts.
- One-Click FX MAX
- One-Click FX Training MAX
- One-Click FX Verification with AI
- Economics indicators shown unobtrusively [EconomicData_rcm]