

Capture only the 【winning pattern】 and enter! (November 22)
0
Today (11/22)’s
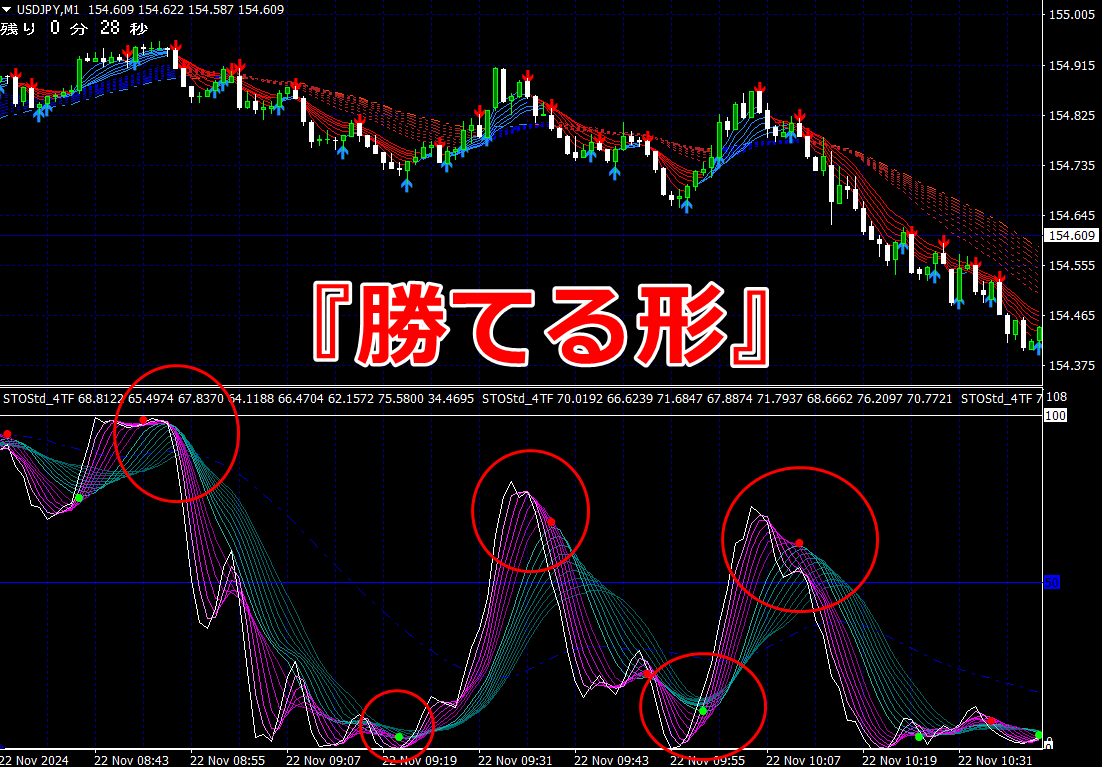
[Profit-able Shape]Only capture and enter!
(USDJPY 1-minute chart)
[Profit-able Shape]Only capture and enter!
(USDJPY 1-minute chart)
★After the signal lights up, the pink band rises above the green band,
or, forms a covering shape to guarantee a win-entry!
★After the signal lights up, the pink band rises above the green band,
or, forms a covering shape to guarantee a win-entry!
(Click the image to enlarge)
What is a “Profit-able Shape”?
An indicator that lets you “learn” the entry point by sight
Aimed at short-term trading in binary options and forexWe reveal a foolproof entry method with the “1-minute chart indicator.”
<The entry steps are①②simple!>
In an uptrend,

①With the arrow signal lit, prepare for entry.
②While the arrow signal is lit,If the pink band of the indicator rises and overlaps the green bandfrom belowin a scooping manner, enter high (buy) on a 1-minute or 3-minute time frame just before or just after the current candle closes.
※Signal-lit does not equal entry; if the indicator does not form a scooping-over green band, you do not enter (the frequency of entries on signal-lit is about once in several occasions).
On a 1-minute chart, there are several dozen to 100 entry opportunities per day
“Only capture and enter on the profitable shape!”
< Shape that scoops the green band above=What is the profitable shape? >
Points where similar entries are possible exist, in the form of indicators as shown in the image below.
What is a “Profit-able Shape”?
An indicator that lets you “learn” the entry point by sight
Aimed at short-term trading in binary options and forex
We reveal a foolproof entry method with the “1-minute chart indicator.”
<The entry steps are①②simple!>
In an uptrend,
①With the arrow signal lit, prepare for entry.
②While the arrow signal is lit,If the pink band of the indicator rises and overlaps the green bandfrom belowin a scooping manner, enter high (buy) on a 1-minute or 3-minute time frame just before or just after the current candle closes.
※Signal-lit does not equal entry; if the indicator does not form a scooping-over green band, you do not enter (the frequency of entries on signal-lit is about once in several occasions).
On a 1-minute chart, there are several dozen to 100 entry opportunities per day
“Only capture and enter on the profitable shape!”
< Shape that scoops the green band above=What is the profitable shape? >
Points where similar entries are possible exist, in the form of indicators as shown in the image below.
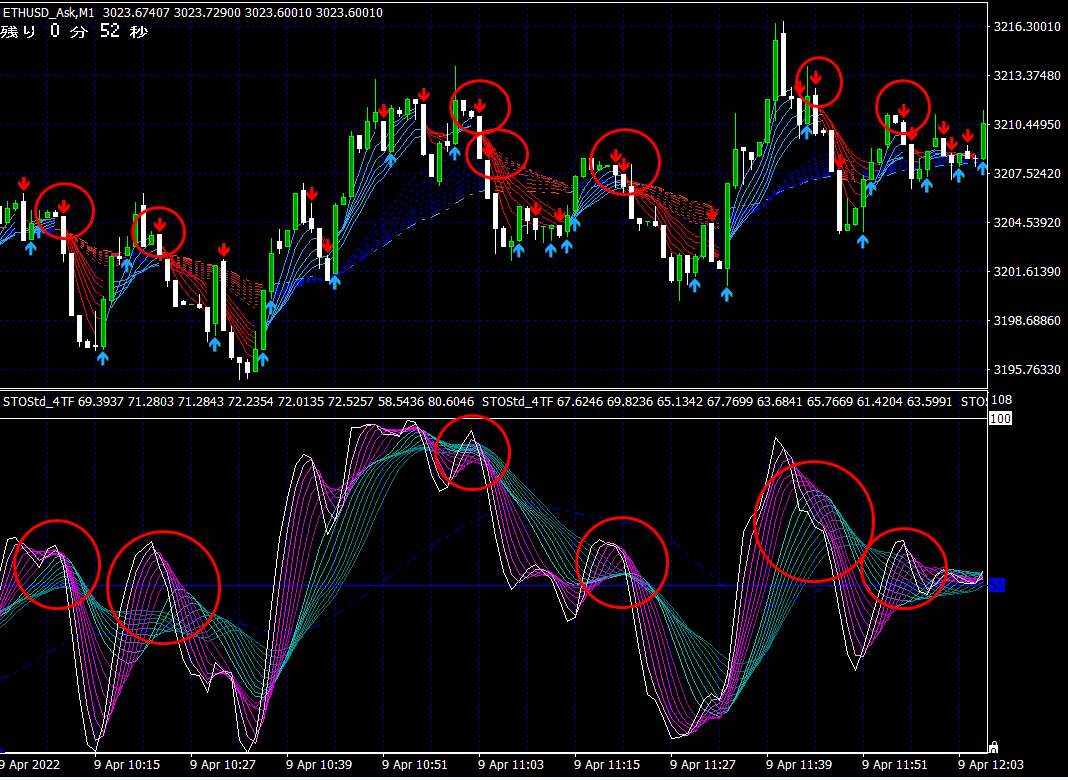
In a downtrend,
①With the arrow signal lit, prepare for entry.
②While the arrow signal is lit,If the pink band of the indicator overlaps the green bandfrom abovein a covering manner, enter a low (sell) on a 1-minute or 3-minute time frame just before or just after the current candle closes.
※Signal-lit does not equal entry; if the indicator does not form a covering green band, you do not enter (the frequency of entries on signal-lit is about once in several occasions).
※On a 1-minute chart, there are several dozen to 100 entry opportunities per day
“Only capture and enter on the profitable shape!”
< Shape covering the green band=What is the profitable shape?>
Points where similar entries are possible are in the indicator shape shown in the image below.
Details and purchase of the indicator are here!
1-minute indicator 3-layer, 3-color waveform indicator


× ![]()


