

Win with RCI! 4th round / Free tool distribution in progress!
Win with RCI! Episode 04
[ATS-Base] RSI Seminar Room
Hello everyone. This is ATS BASE.
We are distributing for a limited time
the free ATS-navi13RCI.
Have you downloaded it yet?
This will be distributed terminated without notice, so
please download it now while you can m(_ _)m
Now, last time we obtained positions with ATS-13RCI
and manipulated them in various ways…
What impact does this have on trading results?
We explored that (^_^)
This time, by adjusting Close (settlement)
how will the trading results
change?
I would like to check.
As before, we will use the free version of “ATS-navi13 RCI”.
The hidden code is the same as last time…
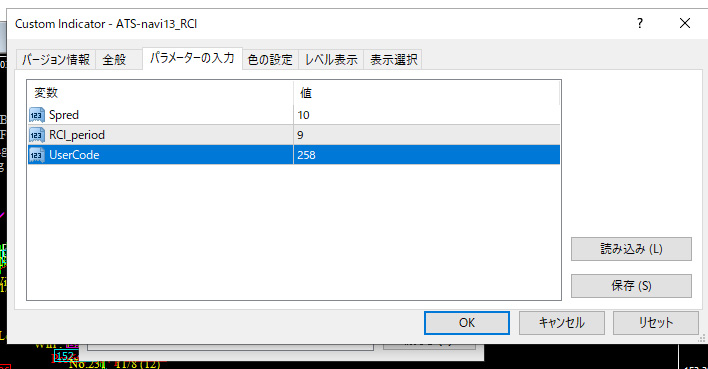
Set the parameter“UserCode”to“258”and try it.
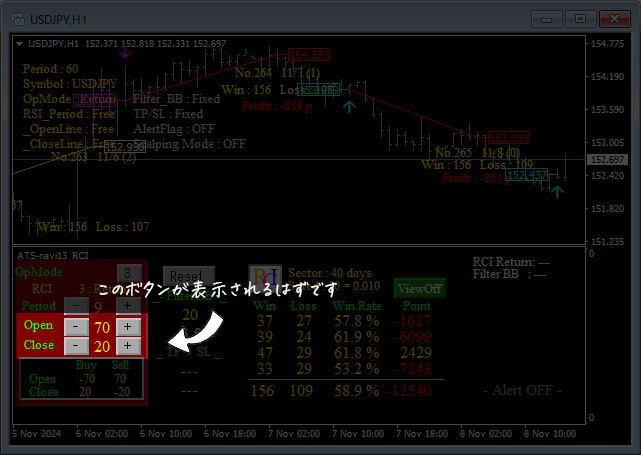
On the chart, the criteria for entry and exit are…
“RCI_Open” and “RCI_Close”
The [+], [-] buttons to adjust the settings will be displayed
as you can see (^_^)
Now then
first, using the “Close” button among these two
change the entry conditions and see the result!
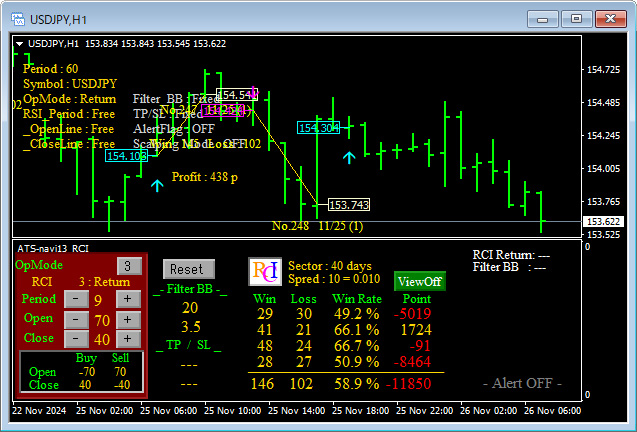
First, from the default values…
Period (the number of bars used for RCI calculation) is the default “9”
The RCI entry condition (Open) remains the standard “70”
RCI exit condition (Close) is “20”.
The entry pattern is “3” Return (retrace).
Buy exit condition: RCI retraces when it goes above 20
----------------------------------------------------------
Sell entry condition: RCI retraces when it goes above 70
Sell exit: when the condition retraces below -20
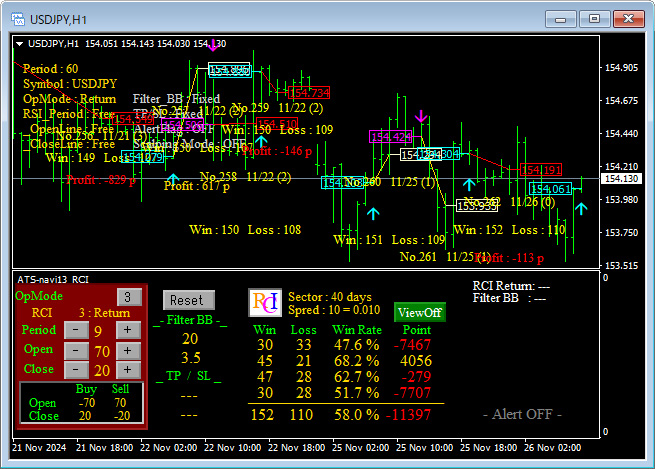
Not very good, huh ^^;
By the way, regarding how to read the score panel…
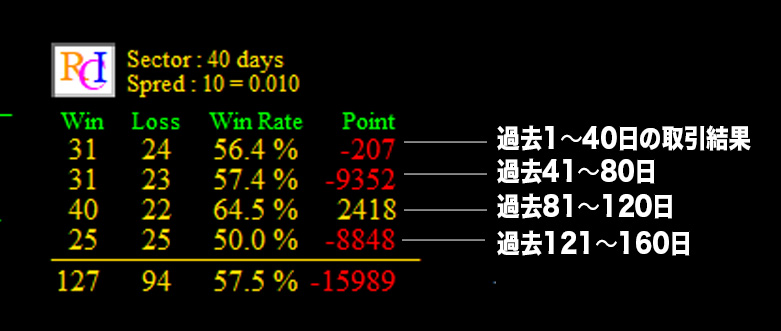
It means that.
Because one Sector is set to 40 days in the parameters,
40 days x 4 sectors (period) = 160 days worth of trading results.
In the ATS series, by changing the settings, you can see the most recent trading results divided into four periods at a glance.
The advantage of this is that it makes it easy to grasp past trend fluctuations and changes in price by period.
For example, the third period from the top shows +2,418, but the second period shows -9,352.
From these numbers, it’s clear that this setting did not fit the market trend of the second period, and results were poor.
And in the most recent first period, there is a drop of 207 points, indicating gradual improvement.
This suggests a conclusion.
Now back to the topic, let’s look at other patterns as well!
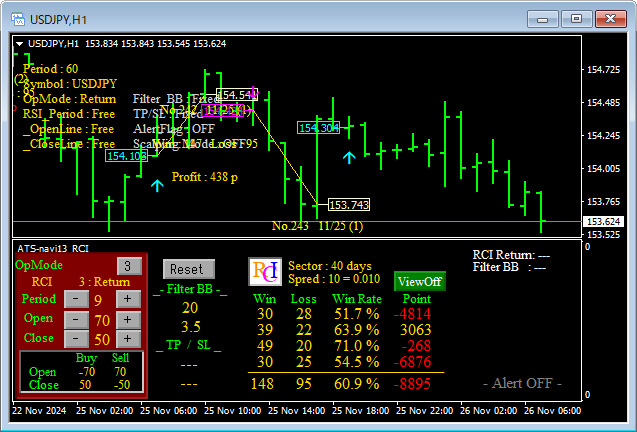
Close (Settlement) = 40
Buy exit condition: RCI retraces when it goes above 40
----------------------------------------------------------
Sell entry condition: RCI retraces when it goes above 70
Sell exit: when the condition retraces below -40
Total points: -11,850.
Still not good (^_^;;)
Let's look at the next one!
Close (Settlement) = 50
Buy exit condition: RCI retraces when it goes above 50
----------------------------------------------------------
Sell entry condition: RCI retraces when it goes above 70
Sell exit: when the condition retraces below -50
Total points improved slightly.
But it still doesn’t seem usable for trading.
From the slight improvement in Total Points, we can infer…
- Is there a near-term exit line around 50 showing potential for winning?
and
- It doesn’t seem that the number of bars in the RCI calculation is 9 right now
.
By only tweaking the RCI exit condition (Close)
you can learn many things (^_^)
With this in mind, I’ll try adjusting “Period (number of bars for RCI)” and “Open (entry condition)”.
\_Head (ω`●) wobble
As expected, it appeared!
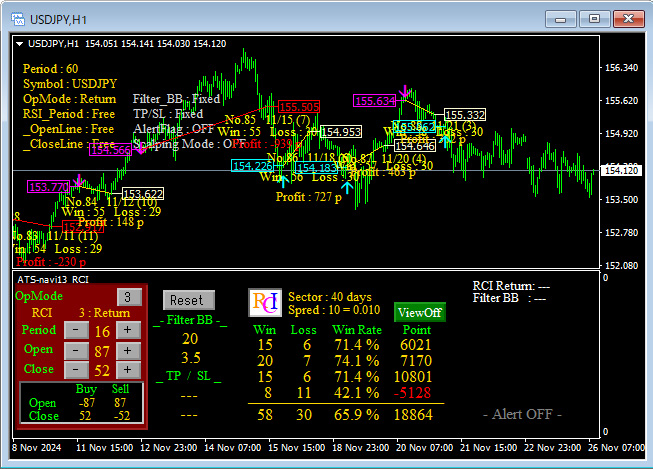
RCI calculation period: 16 bars
Buy entry: retrace when RCI goes below -87
Buy exit: retrace when RCI goes above 52
--------------------------------------------------------
Sell entry: retrace when RCI goes above 87
Sell exit: retrace when RCI goes below -52
Win rate over 65%, 18,864 points (18.864 yen) over 160 days with this RCI setting.
How about that?
Even just tweaking ATS-13 navi RCI like this reveals various possibilities.
Everyone, please give it a try as well.
See you next time (^_^)/