
【Smooth Trade】vol.2 About/manipulated stock-type charts
How to Find Free Public Entry Points
Here are the basic methods for stock trading
Here are premium-level trading techniques
How to aim for rapid gains with madness-style manipulable stocks
Delivering techniques, market conditions, and fundamentals
A newsletter that will surely be useful.
Japanese Stock Trading Essentials
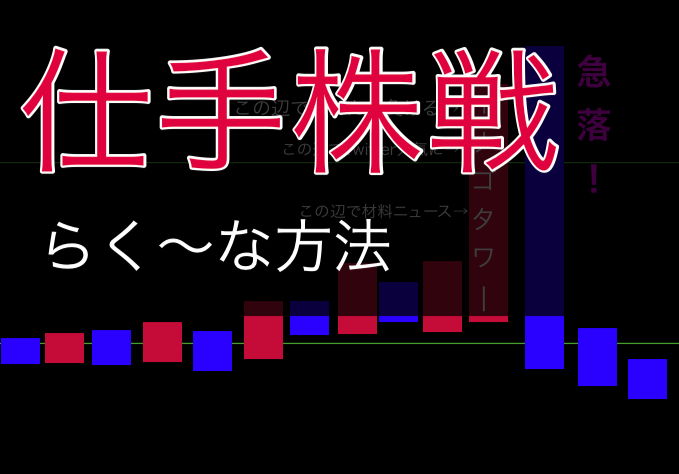
What exactly are manipulated stocks?
We will introduce what manipulated stock charts look like.
They can become manipulated on short-term timeframes, butwhen it happens slowly on longer timeframes,
on minute chartson hourly chartsor even on daily charts,
there are times when they are hard to distinguish.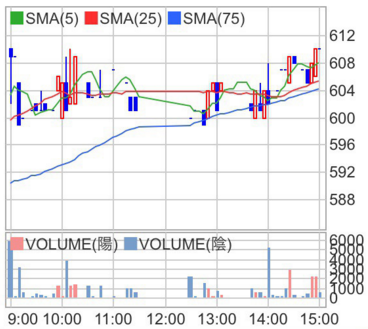
This is a 5-minute chart.Volume is low and sparse, soprices are erratic and jumpy.
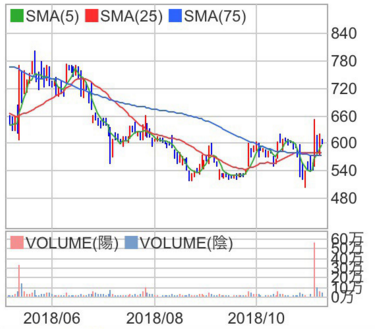
The image above is a daily chart.perhaps due to a rebound?
the reality is…??
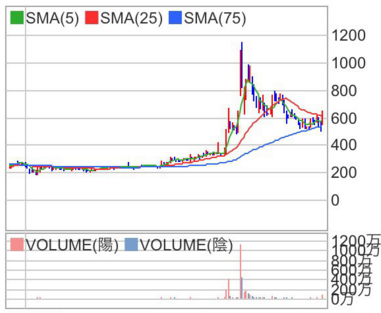
Huh??
I discovered that 200 yen became 1000 yen!!
The chart above is a weekly chart, and from this,
it has risen quite a bit at one point.
Now, let's look at the monthly chart.
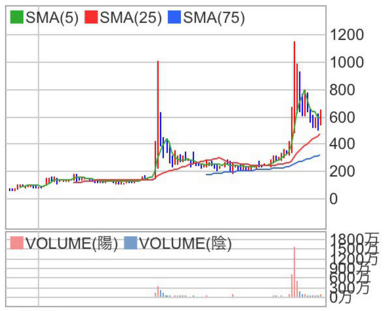
What, this stock was 50 yen??
In reality, a stock that was once cheap suddenly became popular due to some triggerand then boomed
They can become manipulated on short-term timeframes, but
when it happens slowly on longer timeframes,
on minute charts
on hourly charts
or even on daily charts,
there are times when they are hard to distinguish.
This is a 5-minute chart.
Volume is low and sparse, so
prices are erratic and jumpy.
The image above is a daily chart.
perhaps due to a rebound?
the reality is…??
Huh??
I discovered that 200 yen became 1000 yen!!
The chart above is a weekly chart, and from this,
it has risen quite a bit at one point.
Now, let's look at the monthly chart.
What, this stock was 50 yen??
In reality, a stock that was once cheap suddenly became popular due to some trigger
and then boomed
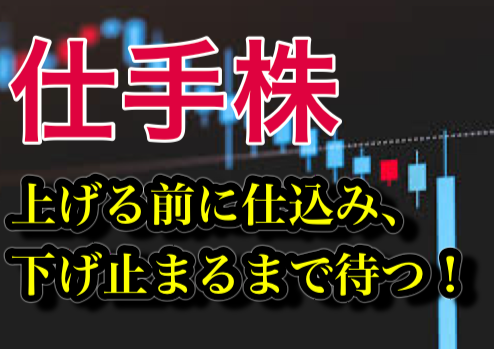
‘First, let the selling dry up’
Then you can see that another boom has started.
There are several things you can infer from this chart.
Here are premium-level trading techniques
Then you can see that another boom has started.
There are several things you can infer from this chart.
Here are premium-level trading techniques
How to target rapid gains with aggressively moving manipulated stocks
× ![]()