

Win at RCI! Second time / Free tool distribution ongoing!
Win with RCI! Episode 02
[ATS-Base] RCI Training Room
In trading, one of the indicators used by many investors is “RCI.” RCI is a very useful tool for catching market reversals and trend changes, but to use it effectively in practice, you need to pay attention to the number of RCI periods.
As you all know, changing the number of periods for RCI greatly affects its responsiveness and reliability. For example, using a shorter number of periods makes it more sensitive to price movements, but it tends to produce more false signals. On the other hand, using a longer number of periods yields steadier signals aligned with the larger market trend, but entry and exit timing tends to be slower.
This article willexamine how to set the number of RCI periods to obtain the most effective trading signalsand discuss how different period settings affect trading results.
By revisiting RCI settings, your current trading may become even more precise. We hope you find the RCI period that fits your trading style and achieve more effective trading.
Right now, we are distributing the “ATS-13 RCI Navi” for free, so please download it during this opportunity.
First, install MT4 and set RSI, which yields “Period = 9” (= 9 periods). The value “9” is set as a standard value because it covers many markets.
However, currency pairs have their own characteristics, and is this value the best for all timeframes? Also, in a constantly changing market, is this value always optimal?
So this time, let’s verify using ATS-13 RCI-navi!
Trading conditions【Fixed conditions】
-------------------------■ Chart
USDJPY
H1
■ Trading conditions
Buy entry: When RCI falls below -70 and reverses
Buy exit: When RCI rises above 20
Sell entry: When RCI rises above 70 and reverses
Sell exit: When RCI falls below -20
■ Filter (entry)
Only enter when Bollinger Bands are inside the Period = 20 (bands), Deviation = 3.5
■ Summary
40 days × 4 quarters (periods) = 160 days
■ Other
Spread: 10 (0.01 = 1 sen)
Starting with the standard value of “9 periods”…
■ Period = 9
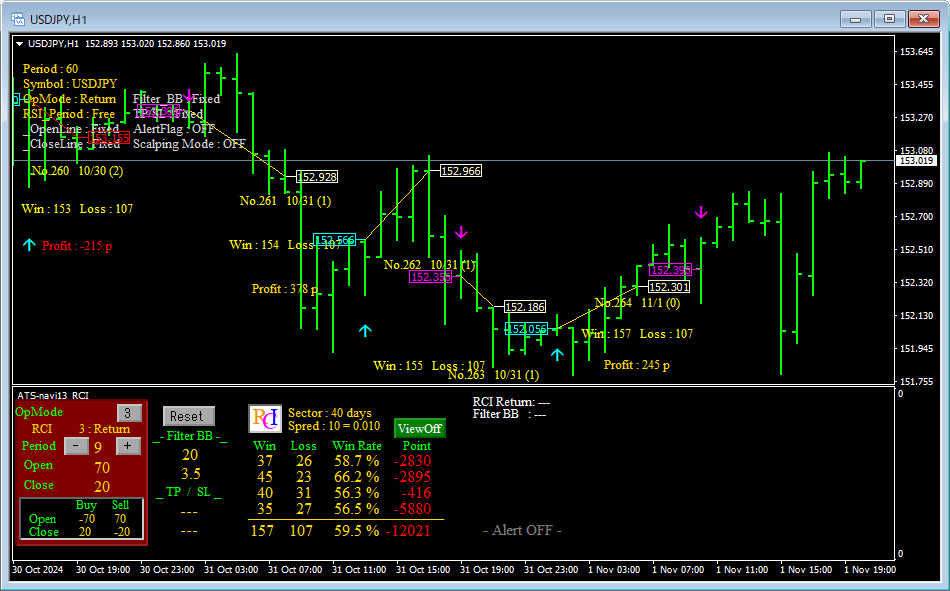
The score isn’t very good. All four periods are negative. Total negative points amount to 12,021.
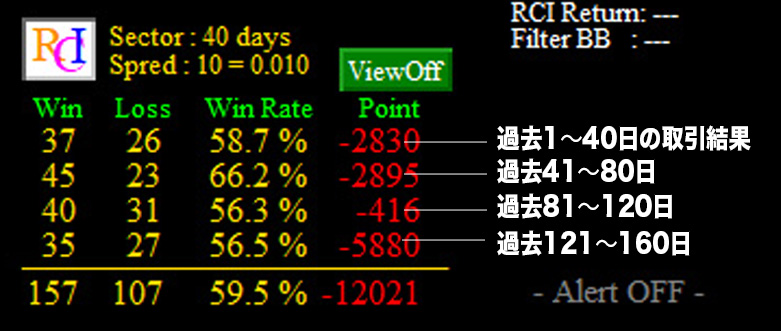
Periods correspond to the four rows in the table above: “-2830,” “-2895,” “-415,” and “-5880.” Each row represents 40 days of daily trading results. The top row is the most recent. In this way, ATS allows you to see at a glance the historical trading performance for the set RCI values over past 160 days (4 rows).
Back to the main discussion, let’s look at other periods as well: “7 periods” and “11 periods”…
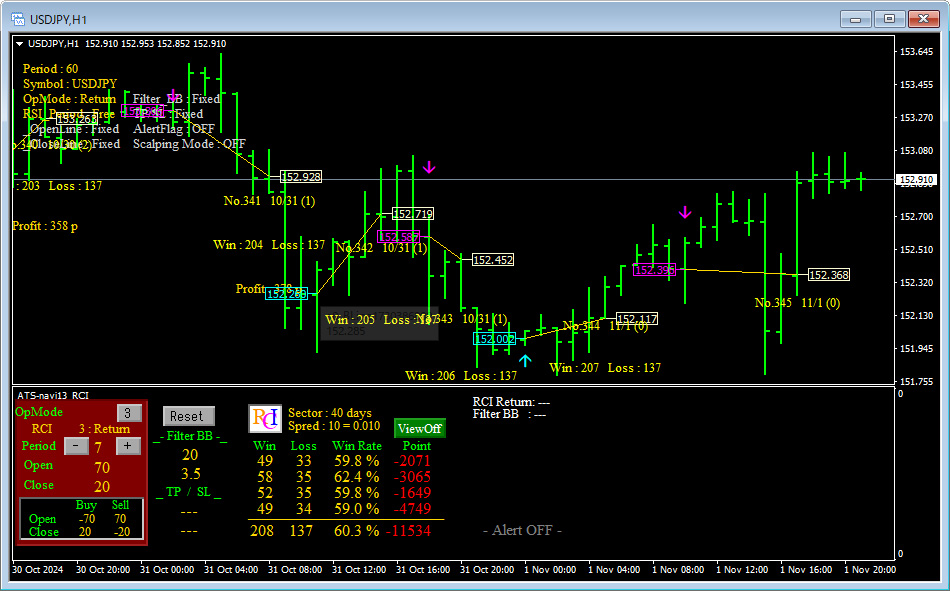
■ Period = 7
■ Period = 11
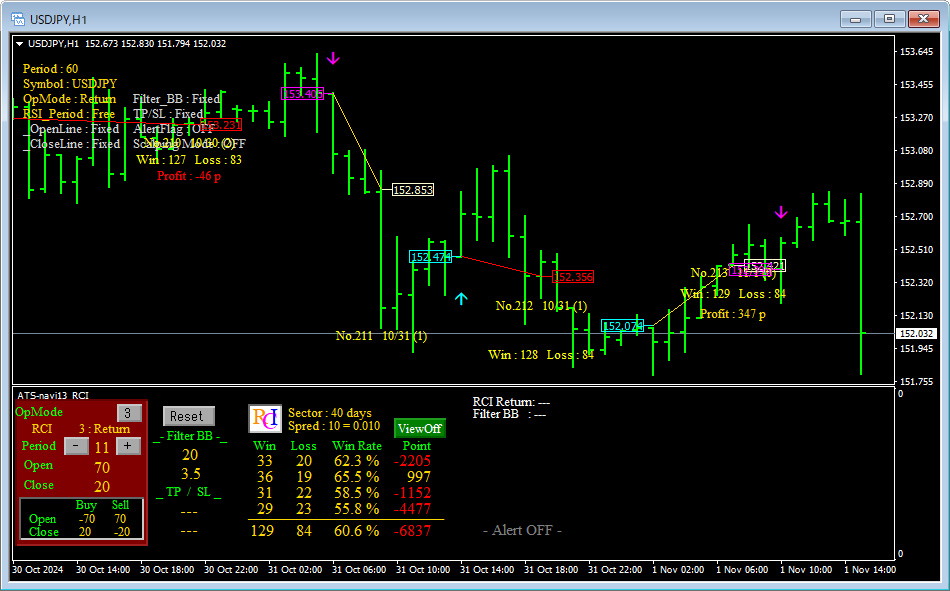
In USDJPY H1, under these trading conditions, it doesn’t look like you’ll win, but the key point here is that simplychanging the Period (number of bars) will also change the results.
Now, let’s try EURJPY H1 as well. Start again from the standard value of “9 periods”…
■ Period = 9
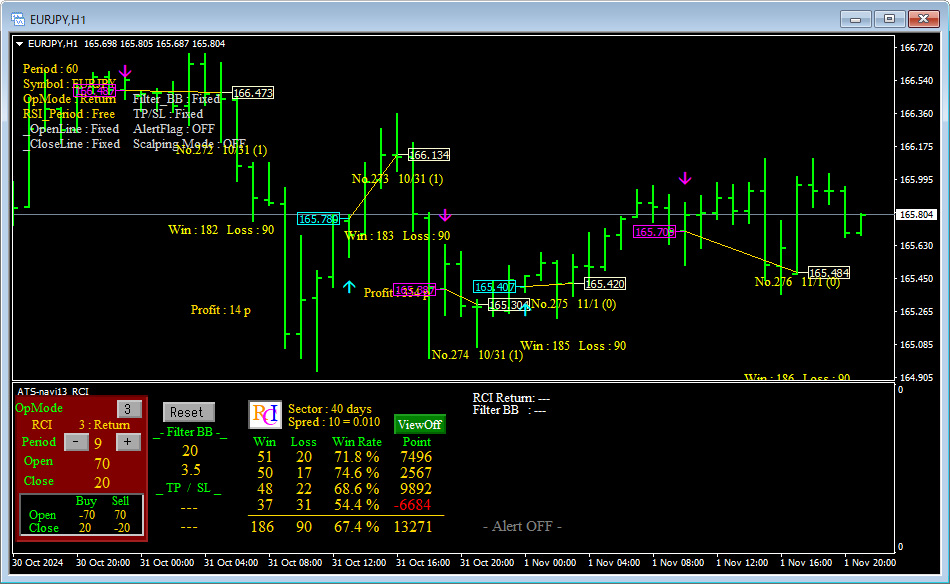
And similarly, try “7 periods” and “11 periods”…
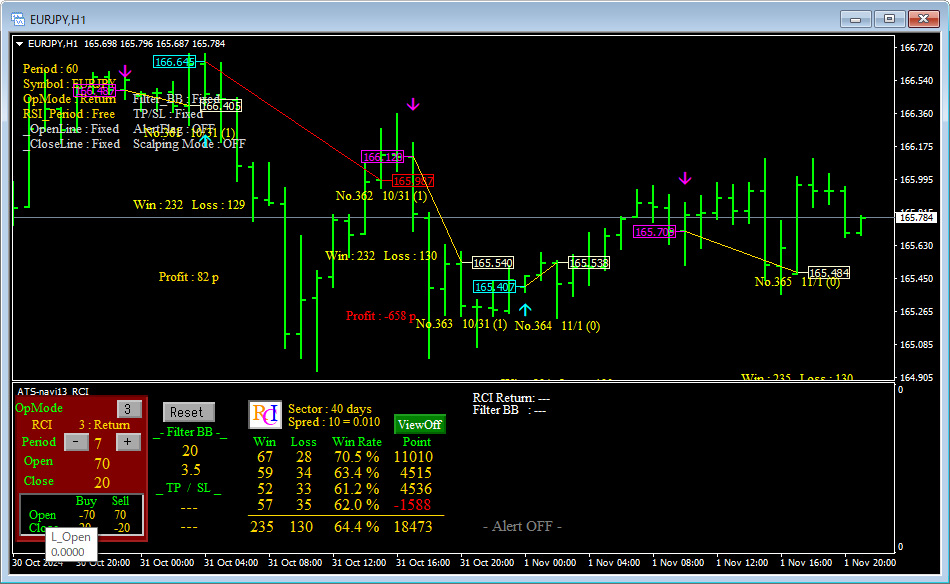
■ Period = 7
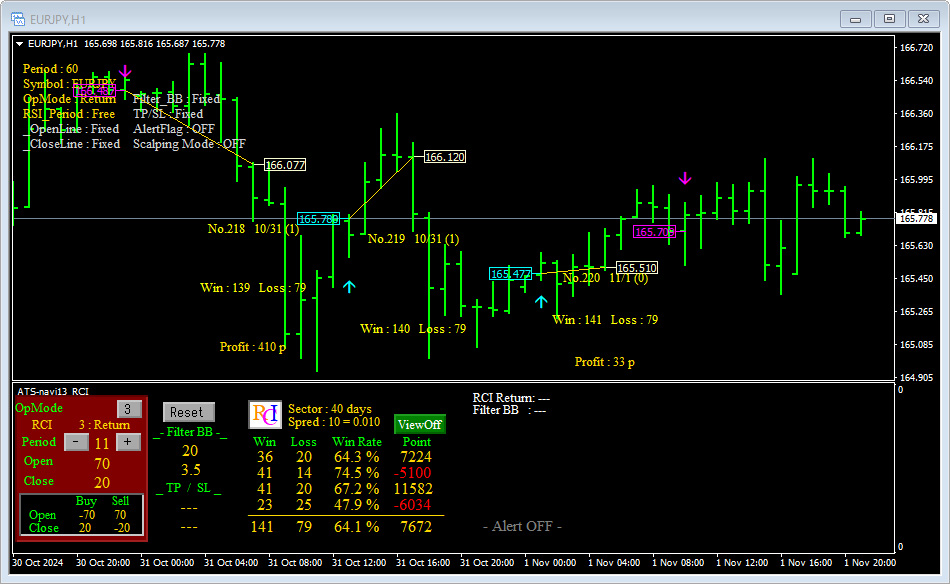
■ Period = 11
What becomes clear is that, compared with the standard 9 periods, the shorter 7 periods yielded better results this time.Even after accounting for the spread, the total across all periods shows a profit of“18,473 points (= 18.47 yen)”
In the EURJPY 1H chart for this time, 7 periods won more than 9 periods!
If you change other conditions as well, there might be even better trading conditions!
Not only across the entire period, but if you can find trading conditions that are positive in every phase of the period, it would be worth trying.
In this way, with “ATS,” you can adjust RCI settings to verify past trading results. By changing settings according to market conditions, you can always trade under the most appropriate conditions for the moment.
We will continue to pursue methods that trade with the most suitable settings for currency pair characteristics, timeframes, and current market conditions in the next installment as well.