

“ATS-12 RSI” Optimization Data Release 2024/10/21 (Mon)
The data introduced here is a portion of the optimized data extracted from the “ATS-12 RSI.” Although it is a sample, it is practical enough to be used in research or trading, and I would be glad if you could make use of it.
Of course, I would like many people to use the paid version of the“ATS”before that!
“Trading that matches the current trend”This is the idea behind this method, the sample data, and the results. I have prepared several articles so you can see the system’s excellence and effectiveness.https://www.gogojungle.co.jp/finance/navi/series/1762
This post concerns the parts of the following table.■
Using RSI to trade in alignment with the current trend, we would like to introduce some of the data extracted from “ATS.”
We will again Introduce how to read and use this data at the end!
(Paid Version) |
(8 sessions total) (Free) |
(Free) |
(Free) |
||
| ATS-12 RSI | 70% OFF [From here] |
Now Open for Free! [From here] |
|
Continuing! [From here] |
|
| ATS-13 RCI | 75% OFF [From here] |
Start Decided! |
Now Public! [From here] |
I Won with It! [From here] |
|
| ATS-11 Ma | 80% OFF [From here] |
Starting Soon! |
Please! [From here] |
Continuing! [From here] |
The [ATS-12 RSI] free articles across 8 sessions will surely be useful for future trading! Please take a look!!
It’s finally time!
【Today’s Public Data】
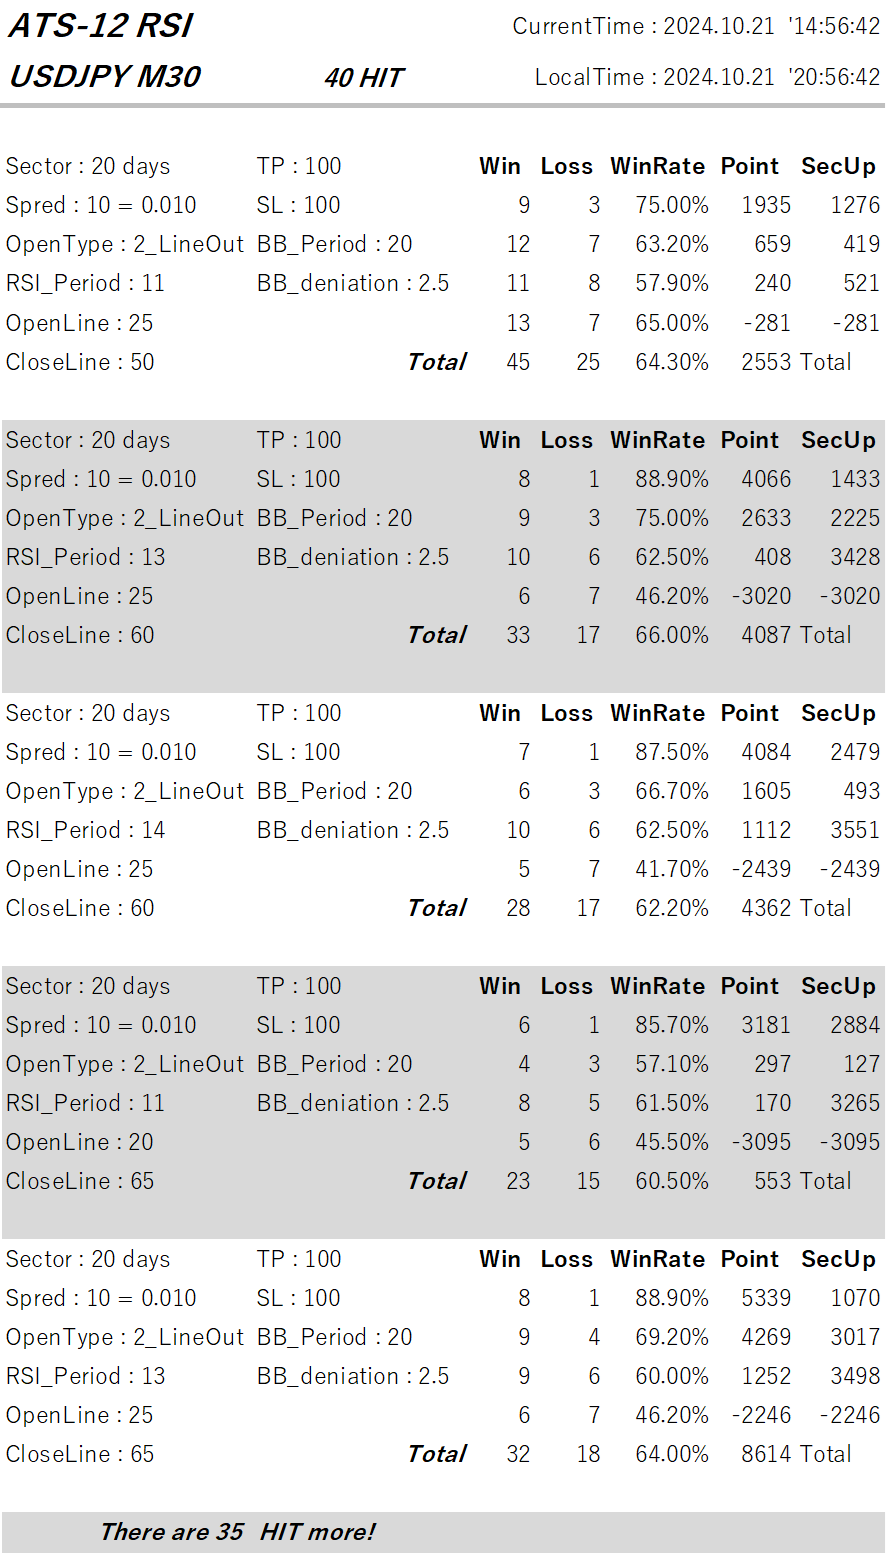
How to Read the Data
This time, we have published five optimal data sets from among many data that performed well under favorable conditions.
First, I will explain how to read the data. The first line is “CurrentTime” and “LocalTime,” which are the MT4 server time used for the weekly work and the local time of the PC used.
Now, I will explain how to read the data.
This is broadly divided into“① Settings”and“② Backtesting Results”sections.
This shows what results would have been obtained by trading under these criteria.
It is similar to backtests in an EA.
This time, the data is for the currency pair “EURJPY,” with a time frame of “H1.”
Now, let’s go through it in order!
③“Sector”:The unit being aggregated. The data is “40 days,” but please first look at the results on the right side⑩. There are four lines of data, which indicates four periods are aggregated. One row (“one period”) is the aggregation result for each “40 days.” And⑪’s total is the aggregation over the entire period of “160 days.”
④“Spred”:To obtain more accurate results, you must also properly consider negative elements such as spreads. “10 = 0.01” means “1 sen.”
⑤“OpenType”: specifies which RSI timing to use as the entry condition. ATS supports three RSI acquisition patterns. This time it is “1:LineIn,” so positions are opened when RSI exits the opened line (oversold/overbought).

⑥“RSI_Period”:Is the number of data points used to calculate RSI. The default is 14, but the market constantly changes and moves in various ways. The default value of 14 is not always the best. It is very important to adopt a setting that matches the current trend.
⑦“OpenLine” and “CloseLine”:RSI baseline lines (levels) for entering and exiting positions. These are not fixed and can be configured to suit the current trend for more effective results.
⑧“TP” and “SL”:Take Profit and Stop Loss. For “EURJPY,” “100” means 1 yen.
⑨“BB_Period” and “BB_deniation”:Equipped with a safety feature using Bollinger Bands. When a sharp change occurs, the immediate trend is hard to read and spreads may widen, placing you at a disadvantage. Therefore, it is prudent not to take positions in such cases. “20” and “2.5” refer to the Bollinger Band with a 20-band, outside of which the deviation is 2.5; positions are not taken outside this range.
⑩As described in③ above, this system aggregates data in four sectors (periods). This is very important. Each data from left to right shows “Wins,” “Losses,” “Win Rate,” and “Subtotal Points.” “SecUp” displays the point difference from the previous period. This helps determine whether this setting is trending upward.
⑪is the total for the four sectors (periods). The Point value 4,320 means there was a net positive of “4 yen 32 sen” over 160 days after excluding spreads. Impressive, isn’t it?
Examples of Using the Data!
If you use this data, you can set indicators on the chart like this to trade optimally. You can also combine it with other tools or compare results for added enjoyment.
We will continue to work hard so that many users can gain substantial profits!!