

『ATS-12 RSI』 Optimization Data Release 2024/10/14 (Tue)
The data introduced here is a part of the optimized data extracted from "ATS-12 RSI". Although it is a sample, it is practical enough for real use, so we would be happy if you could use it for research or trading.
Of course, we would like many people to use the paid version of『ATS』, but before that!
“Trading that fits the current trend”is the concept of this method, and we have prepared several articles to show the sample data and results, so that you can learn the excellence and effectiveness of this system.https://www.gogojungle.co.jp/finance/navi/series/1762
This post focuses on the following table’s■section.
We would like to introduce a portion of the data extracted from ATS to trade in line with the current trend using RSI.
We will introduce how to view and utilize this data again at the end!
In Laboratory (All 8 Sessions), an original tool is distributed for free!
[ATS-12 RSI] All 8 sessions offer free articles that will surely help your future trading! Please have a look!!

Finally!
【Today’s Public Data】
How to Read the Data!
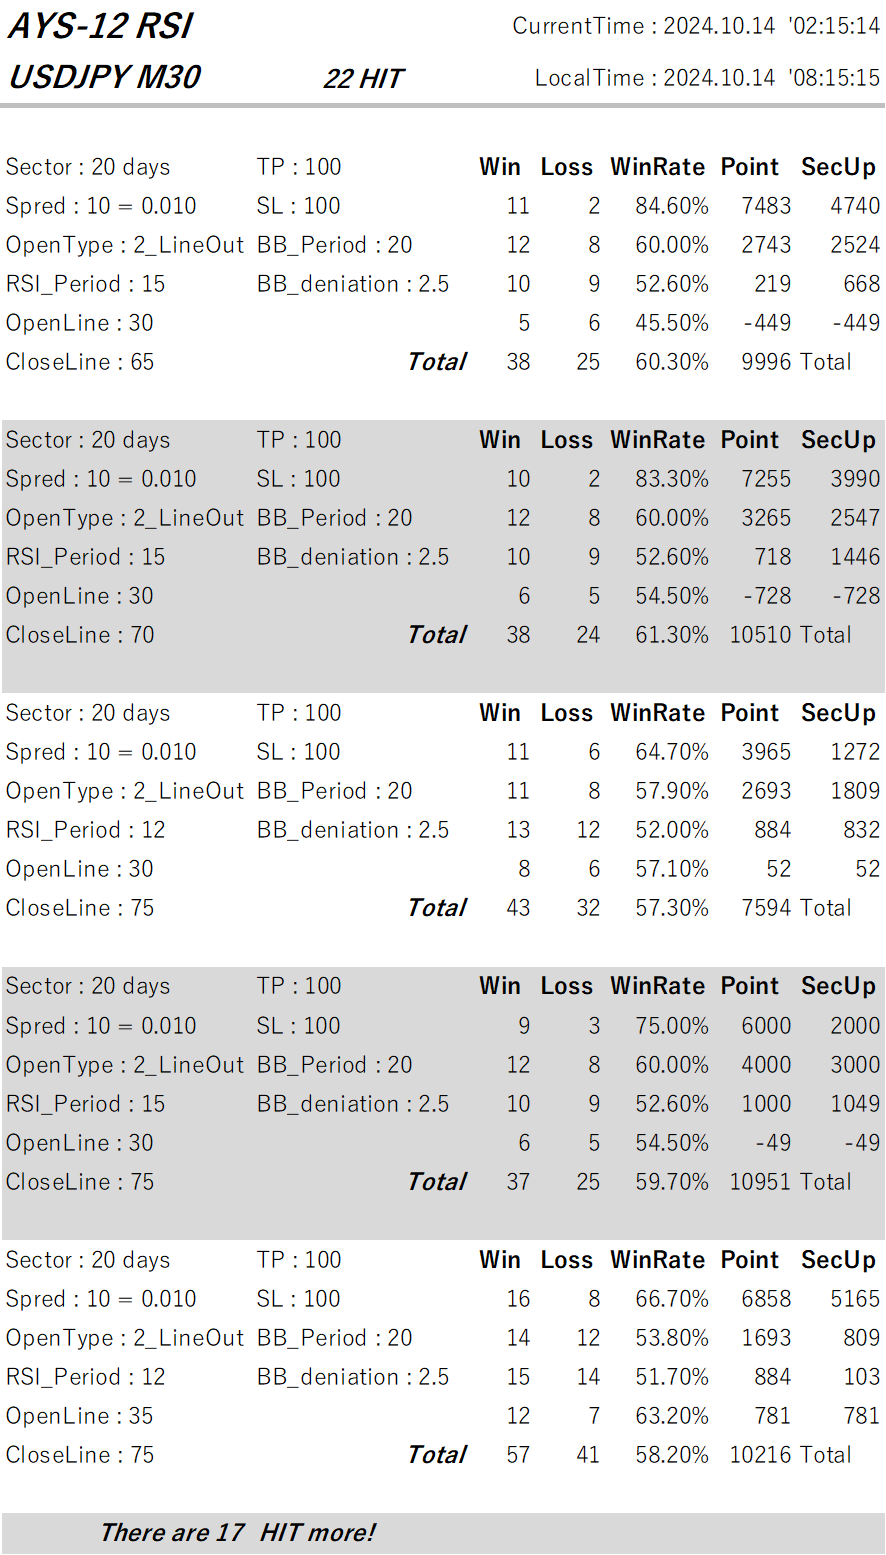
This time, we published five optimized data variants that met favorable conditions from among many data that hit well.
In the last row, there is “There are 〇〇 HIT more!”, so there were 〇〇 more optimized data items!
To view all data,here, ‘ATS-12 RSI’
First, we will explain how to read the data. The first row is “CurrentTime” and “LocalTime,” which are the MT4 server time and the local time of the PC used for the data generation.
Now, let’s explain how to read the data.
This can be broadly divided into,“①Settings”and“②Backtest Results”sections.
It shows what results would be obtained if trading under these conditions.
It is similar to a backtest in an EA.
This time the data is for the currency pair “EURJPY” and the timeframe is “H1.”
Now, let’s go through the items in order!
③ “Sector”:Unit of aggregation. The data is for 40 days, but first look at the right-side result item ⑩. There are four rows of data, indicating that the data is aggregated over four periods. One row (one period) is the result over 40 days. And the total in ⑪ is the aggregate for all periods, i.e., 160 days.
④ “Spred”:To obtain more accurate results, you must also properly account for negative elements like spreads. “10 = 0.01” means 1 pip.
⑤ “OpenType”:This is the opening condition for RSI, a crucial element. ATS supports three RSI acquisition patterns. This time it is “1:LineIn,” so positions are opened when RSI moves outside the set open line (oversold, overbought).

⑥ “RSI_Period”:The number of bars used to compute RSI. Default is 14, but the market is always changing and behaves differently. The default value 14 is not always optimal. Adopting a setting that fits the current trend is very important.
⑦ “OpenLine” and “CloseLine”:These are the reference RSI levels for opening and closing positions. They are not fixed and can be set to suit the current trend to achieve more effective results.
⑧ “TP” and “SL”:Take Profit and Stop Loss. In “EURJPY,” “100” means 1 yen.
⑨ “BB_Period” and “BB_deniation”:They include a safety mechanism using Bollinger Bands. During sudden changes, it can be hard to read the immediate trend, and spreads may widen unfavorably, so it is prudent not to take positions in such times. “20” and “2.5” refer to Bollinger Bands, and with “20 bars” and deviation of 2.5, positions are not opened outside that range.
⑩As explained in ③ above, this system aggregates data into four sectors (periods). This has very important implications. Each data item from left to right shows: wins, losses, win rate, and subtotal points. “SecUp” shows the point difference from the previous period. This helps determine whether this setting is trending upward or not.
⑪is the total of the four sectors (periods). The Point of “4,320” indicates that even after excluding spread, there was a positive gain of 4.32 yen over 160 days. Impressive, isn’t it?
Examples of using the data!
If you use this data, you can set indicators on the chart like this and perform discretionary trading! You can also enjoy using it in combination with other tools or for comparisons.
We will continue to work hard so that everyone who uses it can earn many profits!!
Of course, we would like many people to use the paid version of『ATS』, but before that!
“Trading that fits the current trend”is the concept of this method, and we have prepared several articles to show the sample data and results, so that you can learn the excellence and effectiveness of this system.https://www.gogojungle.co.jp/finance/navi/series/1762
This post focuses on the following table’s■section.
We would like to introduce a portion of the data extracted from ATS to trade in line with the current trend using RSI.
We will introduce how to view and utilize this data again at the end!
(Paid Version) |
(All 8 Sessions) (Free) |
(Free) |
(Free) |
||
| ATS-12 RSI | 70% OFF [From Here] |
Freely Available Now! [From Here] |
|
Ongoing! [From Here] |
|
| ATS-13 RCI | 75% OFF [From Here] |
Start Decided! |
Now Available! [From Here] |
I Won with It! [From Here] |
|
| ATS-11 Ma | 80% OFF [From Here] |
Planned Start! |
There is [From Here] |
Continuing! [From Here] |
[ATS-12 RSI] All 8 sessions offer free articles that will surely help your future trading! Please have a look!!
【Today’s Public Data】
How to Read the Data!
This time, we published five optimized data variants that met favorable conditions from among many data that hit well.
In the last row, there is “There are 〇〇 HIT more!”, so there were 〇〇 more optimized data items!
To view all data,here, ‘ATS-12 RSI’
First, we will explain how to read the data. The first row is “CurrentTime” and “LocalTime,” which are the MT4 server time and the local time of the PC used for the data generation.
Now, let’s explain how to read the data.
This can be broadly divided into,“①Settings”and“②Backtest Results”sections.
It shows what results would be obtained if trading under these conditions.
It is similar to a backtest in an EA.
This time the data is for the currency pair “EURJPY” and the timeframe is “H1.”
Now, let’s go through the items in order!
③ “Sector”:Unit of aggregation. The data is for 40 days, but first look at the right-side result item ⑩. There are four rows of data, indicating that the data is aggregated over four periods. One row (one period) is the result over 40 days. And the total in ⑪ is the aggregate for all periods, i.e., 160 days.
④ “Spred”:To obtain more accurate results, you must also properly account for negative elements like spreads. “10 = 0.01” means 1 pip.
⑤ “OpenType”:This is the opening condition for RSI, a crucial element. ATS supports three RSI acquisition patterns. This time it is “1:LineIn,” so positions are opened when RSI moves outside the set open line (oversold, overbought).
⑥ “RSI_Period”:The number of bars used to compute RSI. Default is 14, but the market is always changing and behaves differently. The default value 14 is not always optimal. Adopting a setting that fits the current trend is very important.
⑦ “OpenLine” and “CloseLine”:These are the reference RSI levels for opening and closing positions. They are not fixed and can be set to suit the current trend to achieve more effective results.
⑧ “TP” and “SL”:Take Profit and Stop Loss. In “EURJPY,” “100” means 1 yen.
⑨ “BB_Period” and “BB_deniation”:They include a safety mechanism using Bollinger Bands. During sudden changes, it can be hard to read the immediate trend, and spreads may widen unfavorably, so it is prudent not to take positions in such times. “20” and “2.5” refer to Bollinger Bands, and with “20 bars” and deviation of 2.5, positions are not opened outside that range.
⑩As explained in ③ above, this system aggregates data into four sectors (periods). This has very important implications. Each data item from left to right shows: wins, losses, win rate, and subtotal points. “SecUp” shows the point difference from the previous period. This helps determine whether this setting is trending upward or not.
⑪is the total of the four sectors (periods). The Point of “4,320” indicates that even after excluding spread, there was a positive gain of 4.32 yen over 160 days. Impressive, isn’t it?
Examples of using the data!
If you use this data, you can set indicators on the chart like this and perform discretionary trading! You can also enjoy using it in combination with other tools or for comparisons.
We will continue to work hard so that everyone who uses it can earn many profits!!