

Utilization of the “Visualization Indicator” (No. 165)
"Visualization Indicator" usage (part165)
1. Further evolve the "28 Currency Pairs List Indicator" into an indicator
"8CP visualization indicator" forCADJPY to be drawn
"8CP visualization indicator" includesOceania edition,London edition,NewYork edition,AnyCP edition. This time, I used theNewYork
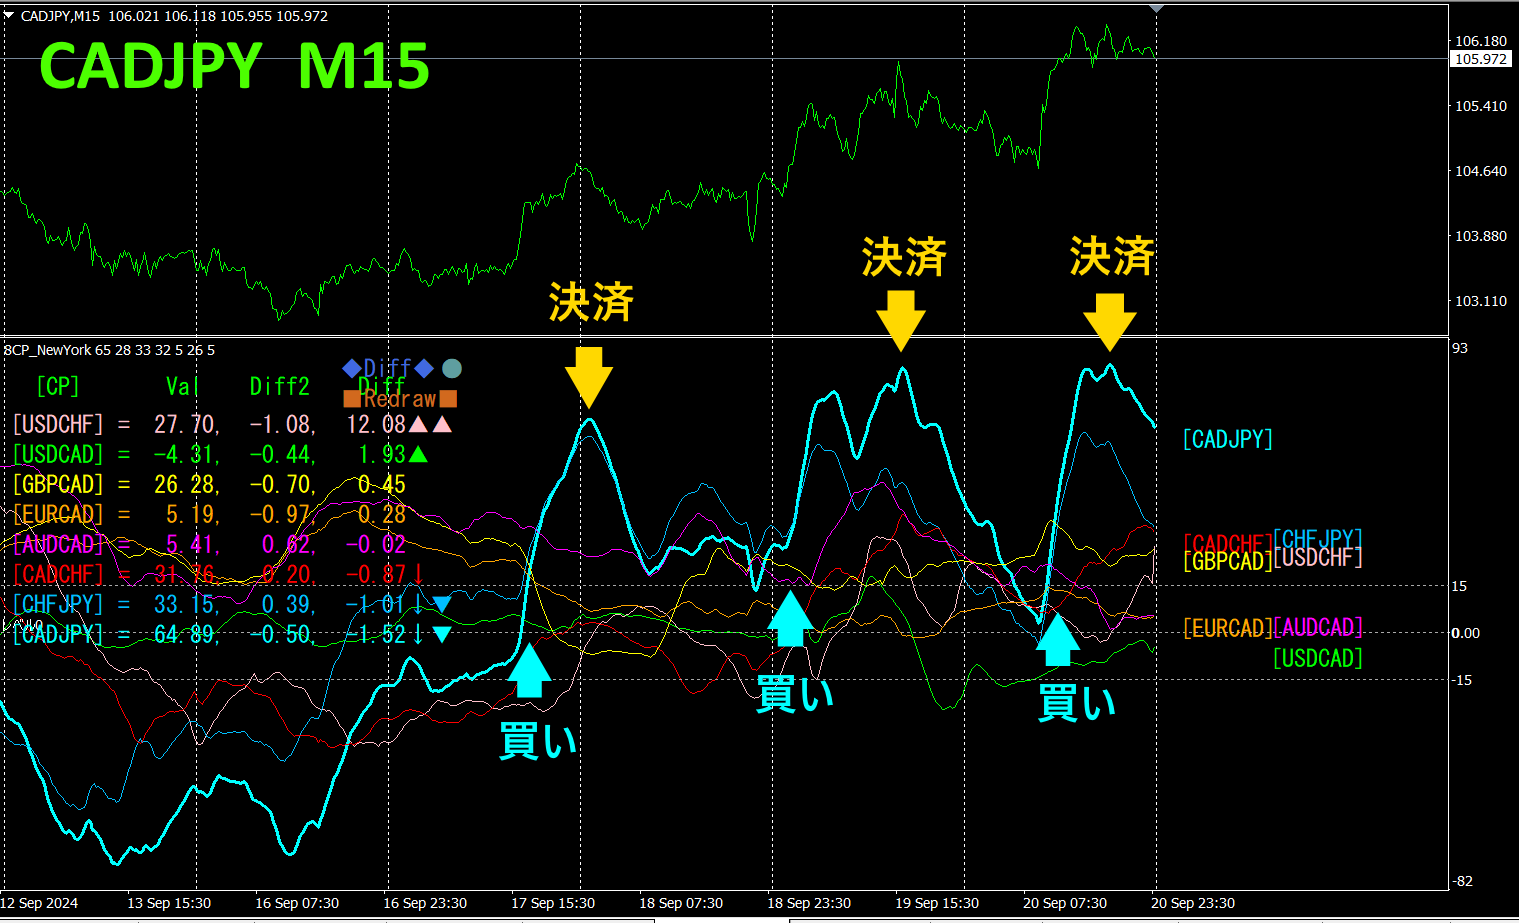
The upper half is the 15-minute chart ofCADJPY. The lower half is from the "8CP visualization indicator"; the light blue thick line graph corresponds to.
Buy at the point where the graph breaks upward. I repeated the settlement three times at the peaks. With three buy entries, I earned a total of about300pips of profit.
If you use theTrendLine-EX, you can automate entry and exit on diagonal trendline breaks. You can leave it as is for ease of trading. TheTrendLine-EX is a semi-automatic EA that can automatically sell on a trendline lower break and automatically settle on an upper break.
2. Best Select Try the indicator
The figure below shows a screenshot from2024 year9 month day03:20 (JST)
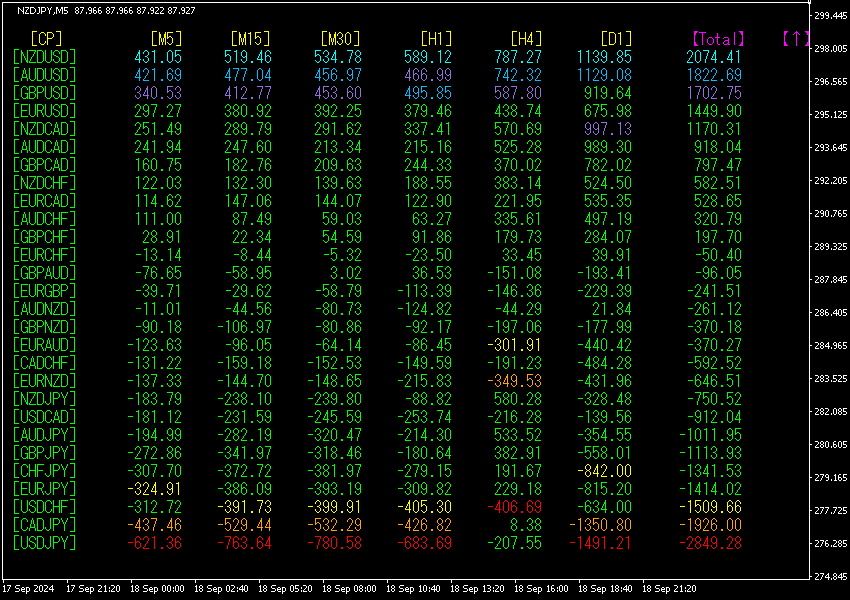
[Total] The numbers are in descending order. The top row,NZDUSD, is blue in all timeframes. Moreover, the value is, a large positive number. This indicates that an upward trend is occurring in.
Now, let's look at the chart of.
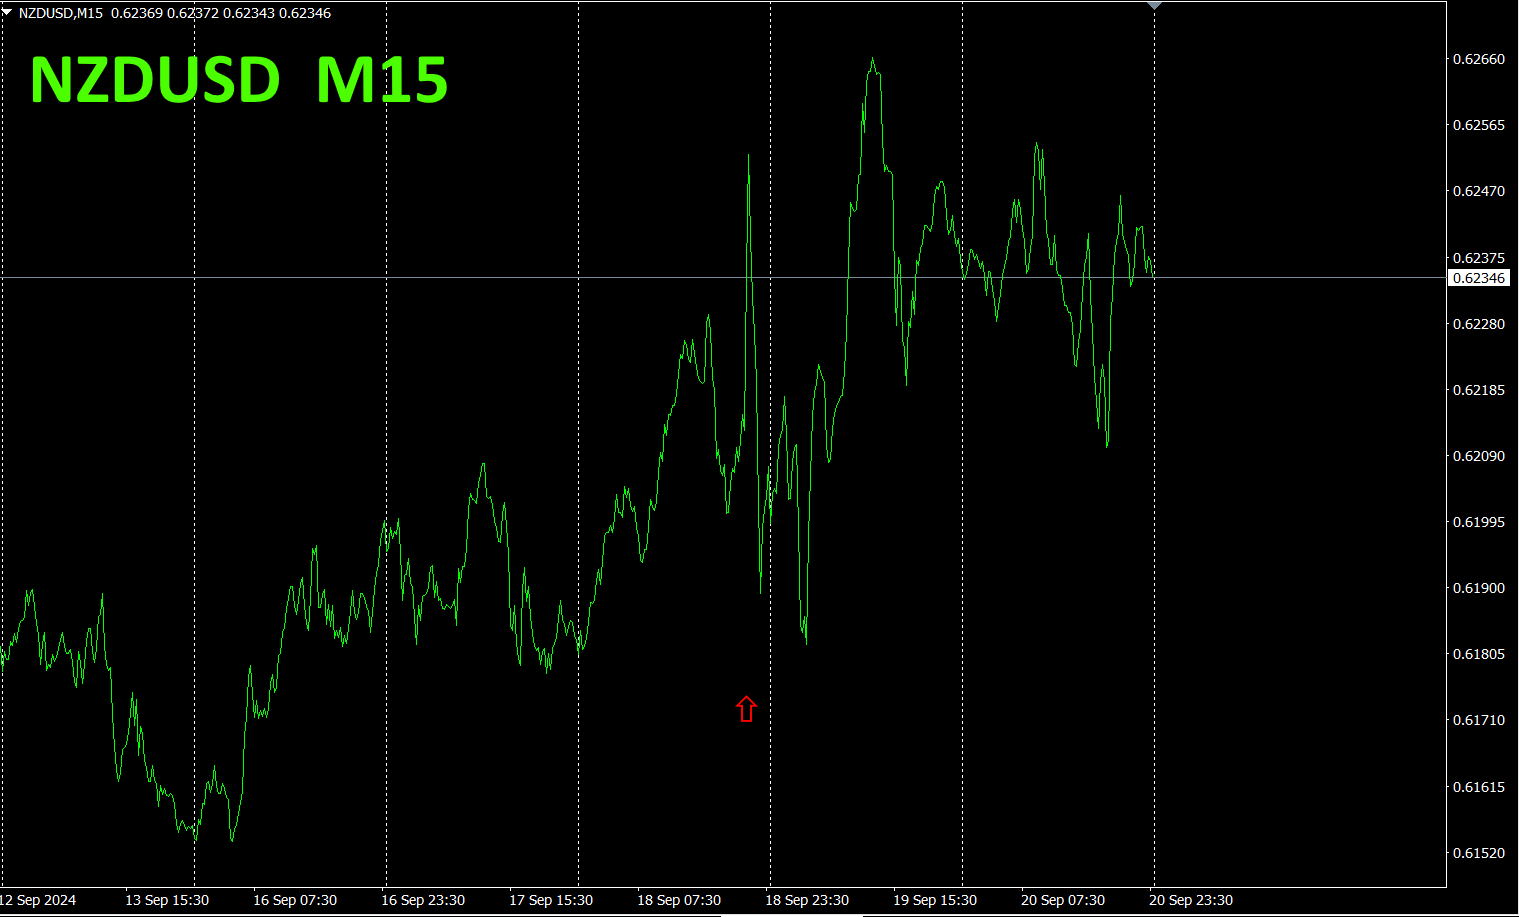
The red arrows mark where the screenshot was taken. It captures the point where the chart is surging.
The "28" Currency Pair Best Select Indicator" can easily identify which currency among the 28 pairs shows the strongest trend. It also tells you, with numbers and colors, whether you should trade now. It is an excellent indicator for judging all currency pairs at a glance.
The "28" Currency Pair Best Select Indicator
https://www.gogojungle.co.jp/tools/indicators/35128

3. 2021 year5 month follow
From 2021 year5 month the movement of is being tracked.
To view the overall trend, a 30-minute chart of the last about weeks is drawn.
Last time I wrote the following.
is horizontal to slightly downward, is almost horizontal, with no clear sense of direction. Going forward, is expected to move in a range.
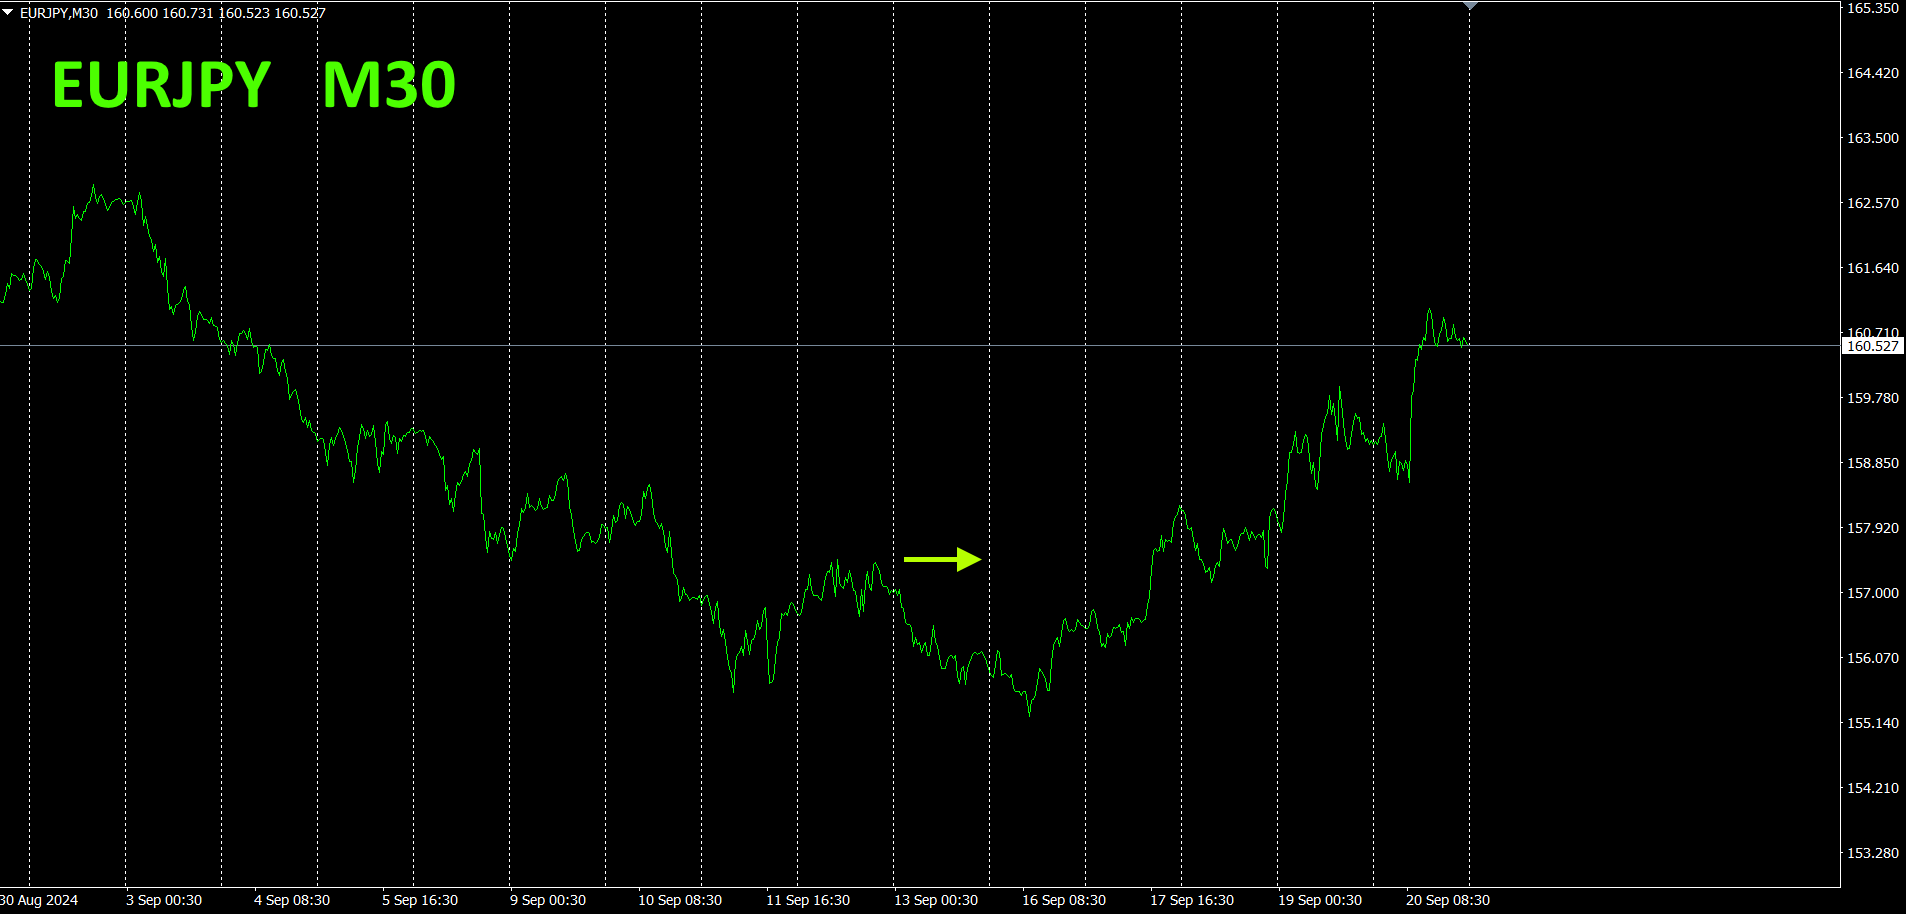
I predicted a range, but it rose slightly upward.
30 minutes currency strength chart.
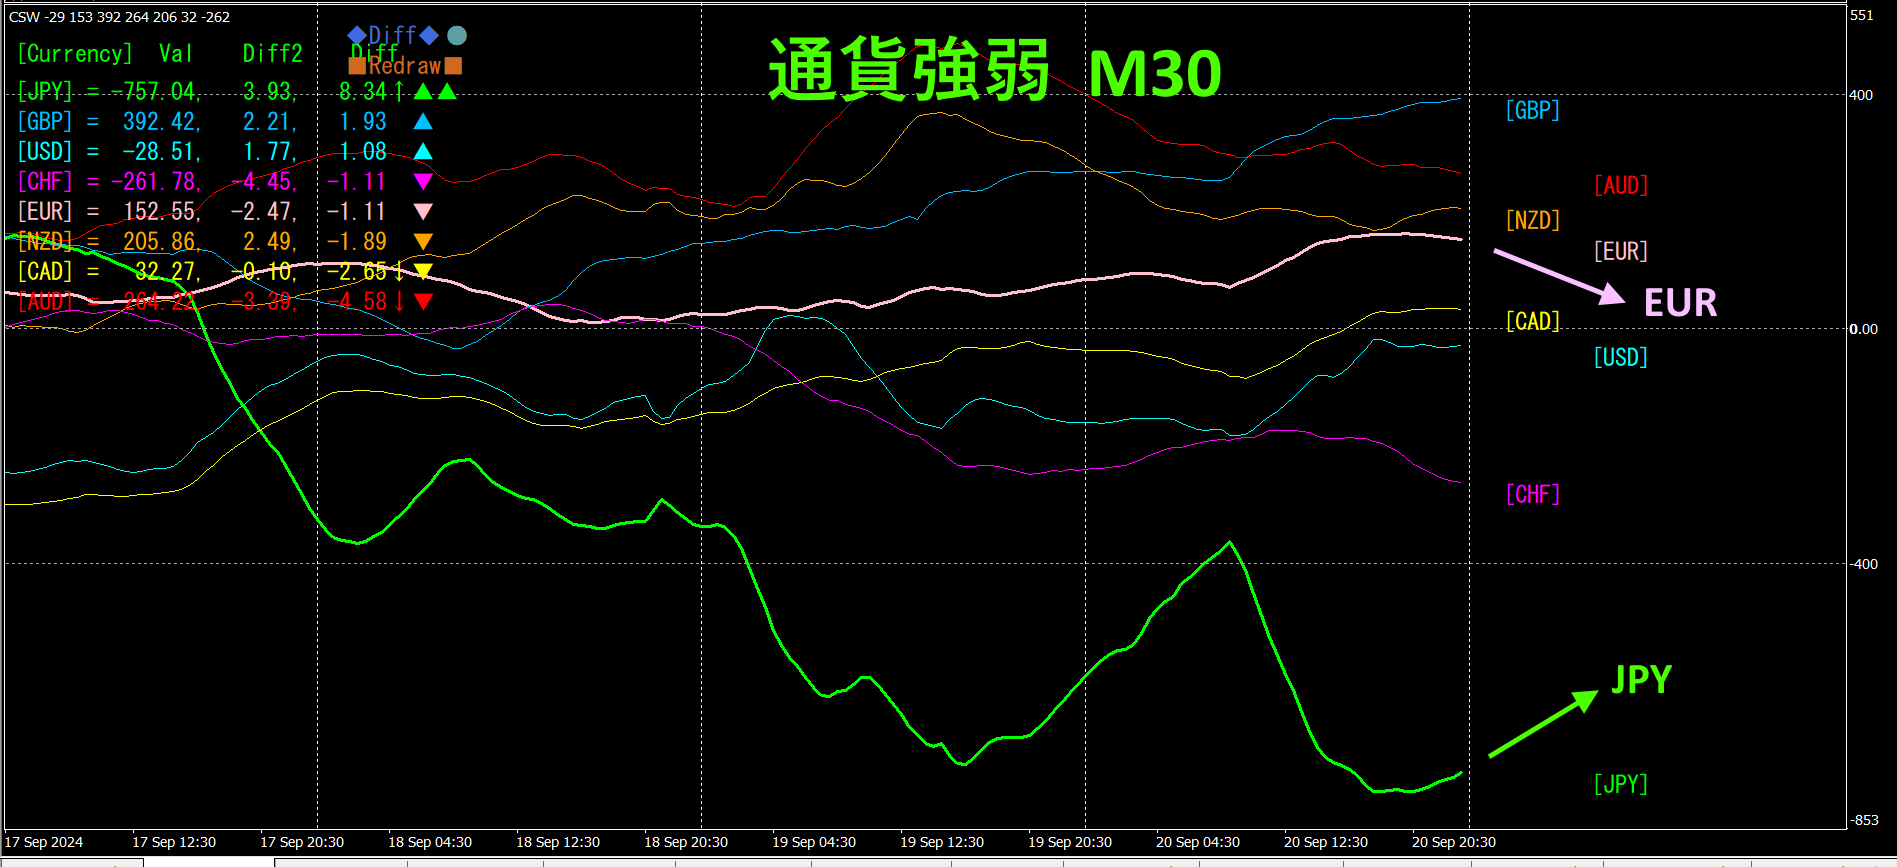
Pink is, green isEUR is slightly downward, is slightly upward. In the future, the. is expected to move slightly downward.
4.
EA「 Ikigai (one-shot)」() is not performing well, so I developed another.
「 Ikigai」 is an that analyzes the market with AI and has developed about 90% of it with AI, a “billion-yen EA,” but the recent forward test has been terrible. Therefore, I created a newEA
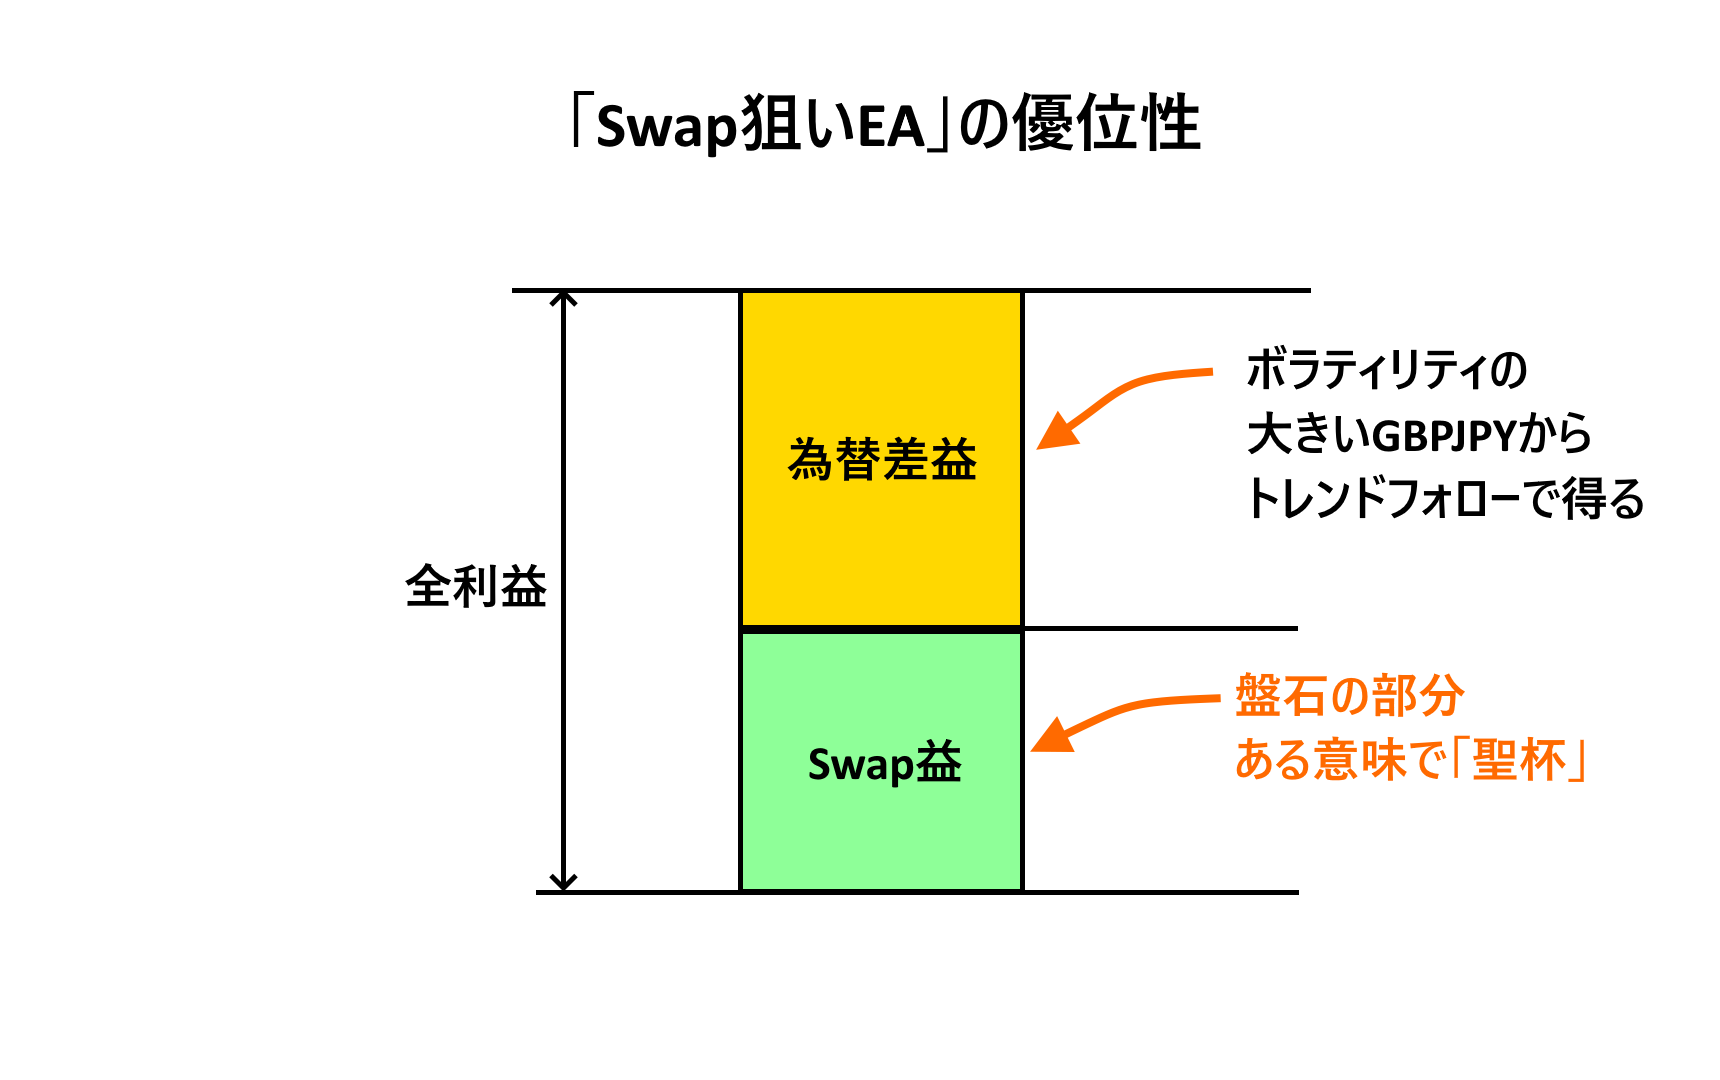
The new EA is named,「狙い」. It is already available asSwap on Gogojungle, but this version is specialized for as an EA. Entry count is quite low (about– times). It buys only when there is a trend and aims to profit from both fluctuations andSwap gains. It is also designed for traders with small capital, allowing efficient capital growth from a small amount. It takes only one long position.
※ An example of a backtest is shown.
<Million-yen EA>
Currency pairGBPJPY-cd (Great Britain Pound vs Japanese Yen)
Period minutes(M5) 2012.01.03 15:20 - 2024.09.18 04:50
Model All ticks(Using the most accurate method with the smallest available timeframe)
Initial margin1,000,000.00
Spread40
Net profit109,227,903.49
Profit factor1.45
Absolute drawdown325,007.22
Maximum drawdown15,074,260.89 (13.27%)
Total trades473
From 2012 year the foreign exchange gains alone exceed 100 million yen. Plus gains of million yen are added, totaling00,000,000 "Million-yen EA"
<Example with small capital>
Assuming only available, I ran a backtest from year month to
Currency pairGBPJPY-cd (Great Britain Pound vs Japanese Yen)
Period minutes(M5) 2024.01.02 00:00 - 2024.08.30 23:45 (2024.01.01 - 2024.08.31)
Model All ticks(Using the most accurate method with the smallest available timeframe)
Initial margin10,000.00
Spread40
Net profit13,421.71
Profit factor2.04
Absolute drawdown323.11
Maximum drawdown6,047.52 (21.87%)
Total trades28
Win rate
Net profit is, but with gains of about added, total profit is. gains added to capital grew to times over eight months. Moreover, absolute drawdown was only., with a 64% win rate, making it a relatively safe and comfortable trade.
「狙い」 advantages image.
Note: the狙い” is currently under review on Gogojungle.

5.
“Torotore Indicator” usage
I upgraded the “Torotore Indicator.” Added alert function and arrows display. I also added several use-case examples. Please see the product page for details.
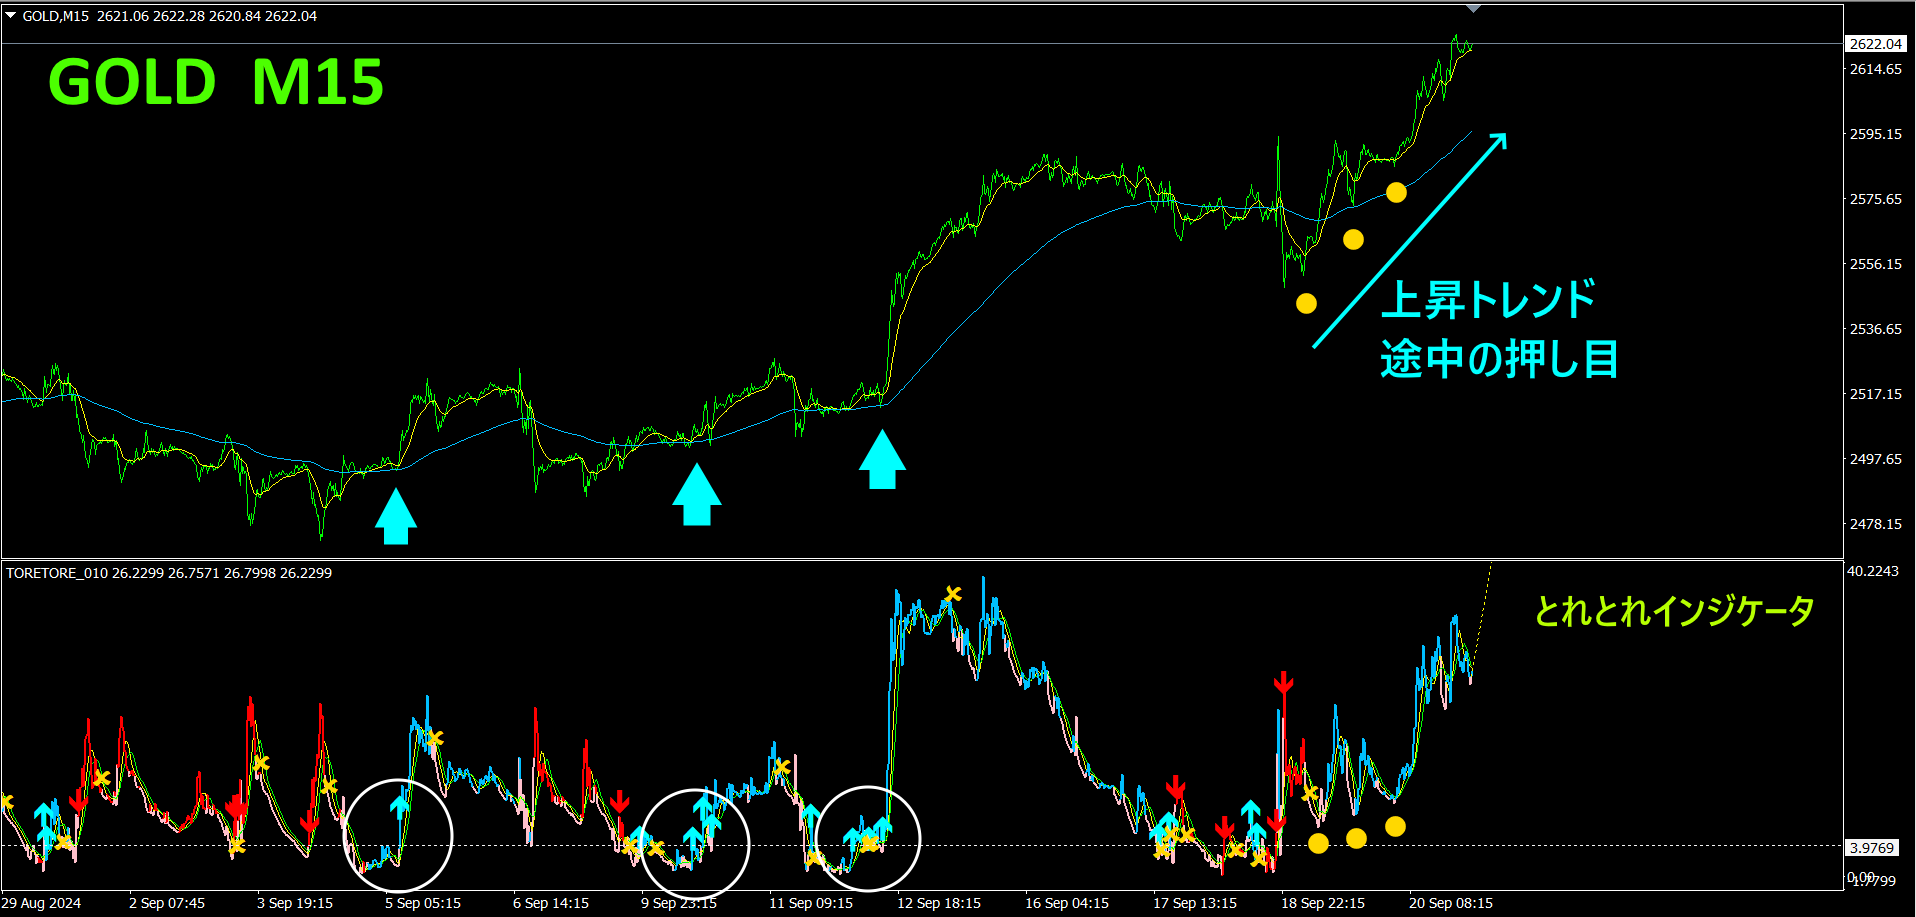
The “Torotore Indicator” is a versatile indicator that can be used in various places.GOLD’s 1-minute chart has been tested.
The lower half is the “Torotore Indicator.”’s-minute chart shows an uptrend with an increasing right shoulder. By waiting for the main line of the indicator to approach the zero line and confirming a reversal before entering a buy, you can enter at an excellent point (circled in white on the top diagram). You will not be left holding a rising price.
In addition, the pullback position within an uptrend corresponds to the valley position of the main line of the indicator. The point where the pink line of the main line traces a V shape marks the pullback point (yellow circle in the diagram above).
6.
Recommended indicators
“Torotore Indicator”
https://www.gogojungle.co.jp/tools/indicators/50115
“TrendLine-EX”
https://www.gogojungle.co.jp/tools/indicators/42257

The “8C Currency Strength Visualization Indicator” is described on the following page.

MT4 version https://www.gogojungle.co.jp/tools/indicators/39150
MT5 version https://www.gogojungle.co.jp/tools/indicators/39159
【My listed items】


