

Horizontal line & Bollinger Bands|Expansion Detection Indicator
Good evening, this is Aime.
Last night, the Japan national soccer team had another decisive victory, didn’t they!
・・That said, it wasn’t broadcast on commercial TV, so I couldn’t watch it in real time..
But! Combining with the previous time, scoring 12 points total— isn’t that amazing?!
Until now, even with high ball possession, we couldn’t convert to goals
and so Japan national team often couldn’t win, right?
However, since the opening match against China, the goal image has been clear
and it’s been well rehearsed... I can hardly wait!!!
Well, for the Middle East games I’ve given up watching live, but I would still like to hold strong support
in my heart.
Well then—
Today, I’ll talk about the tools I’ve been using recently for environmental awareness.
In these talks about environmental awareness, I think you’ll see them appearing from time to time
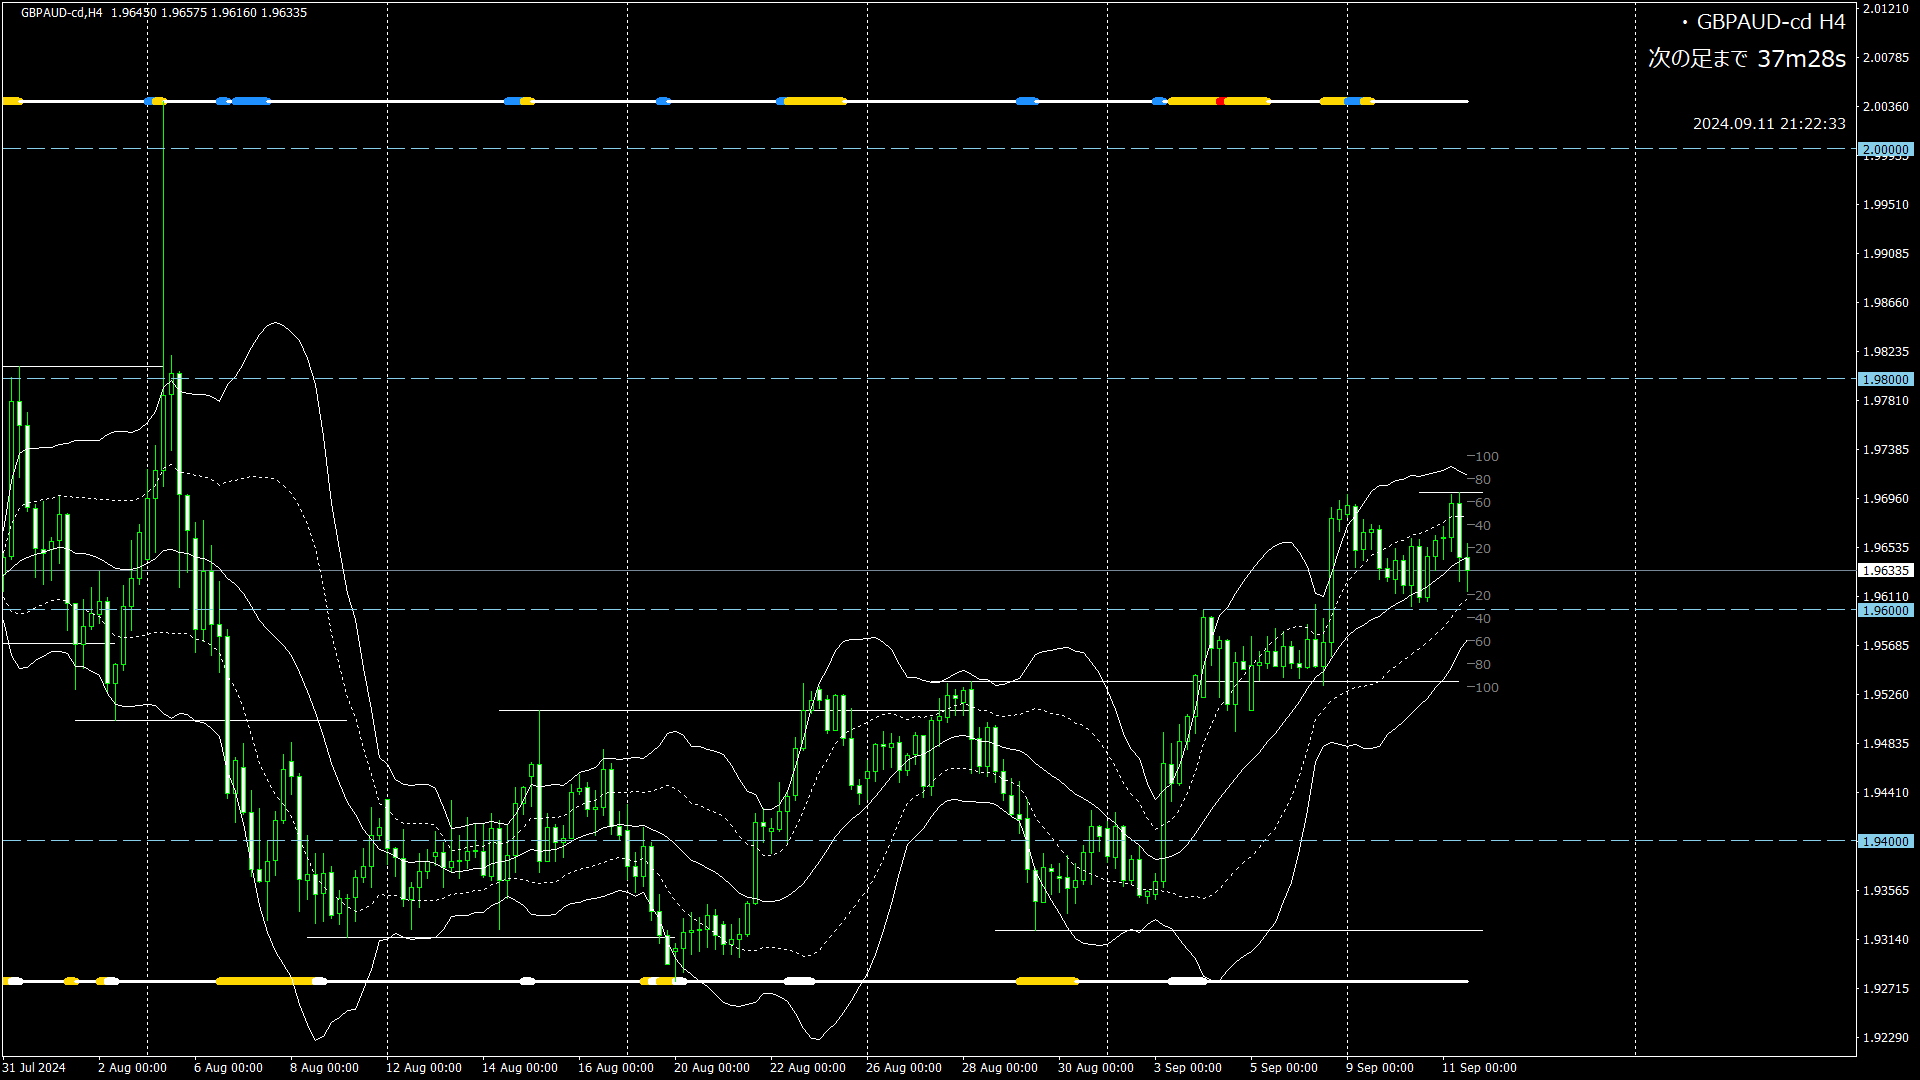
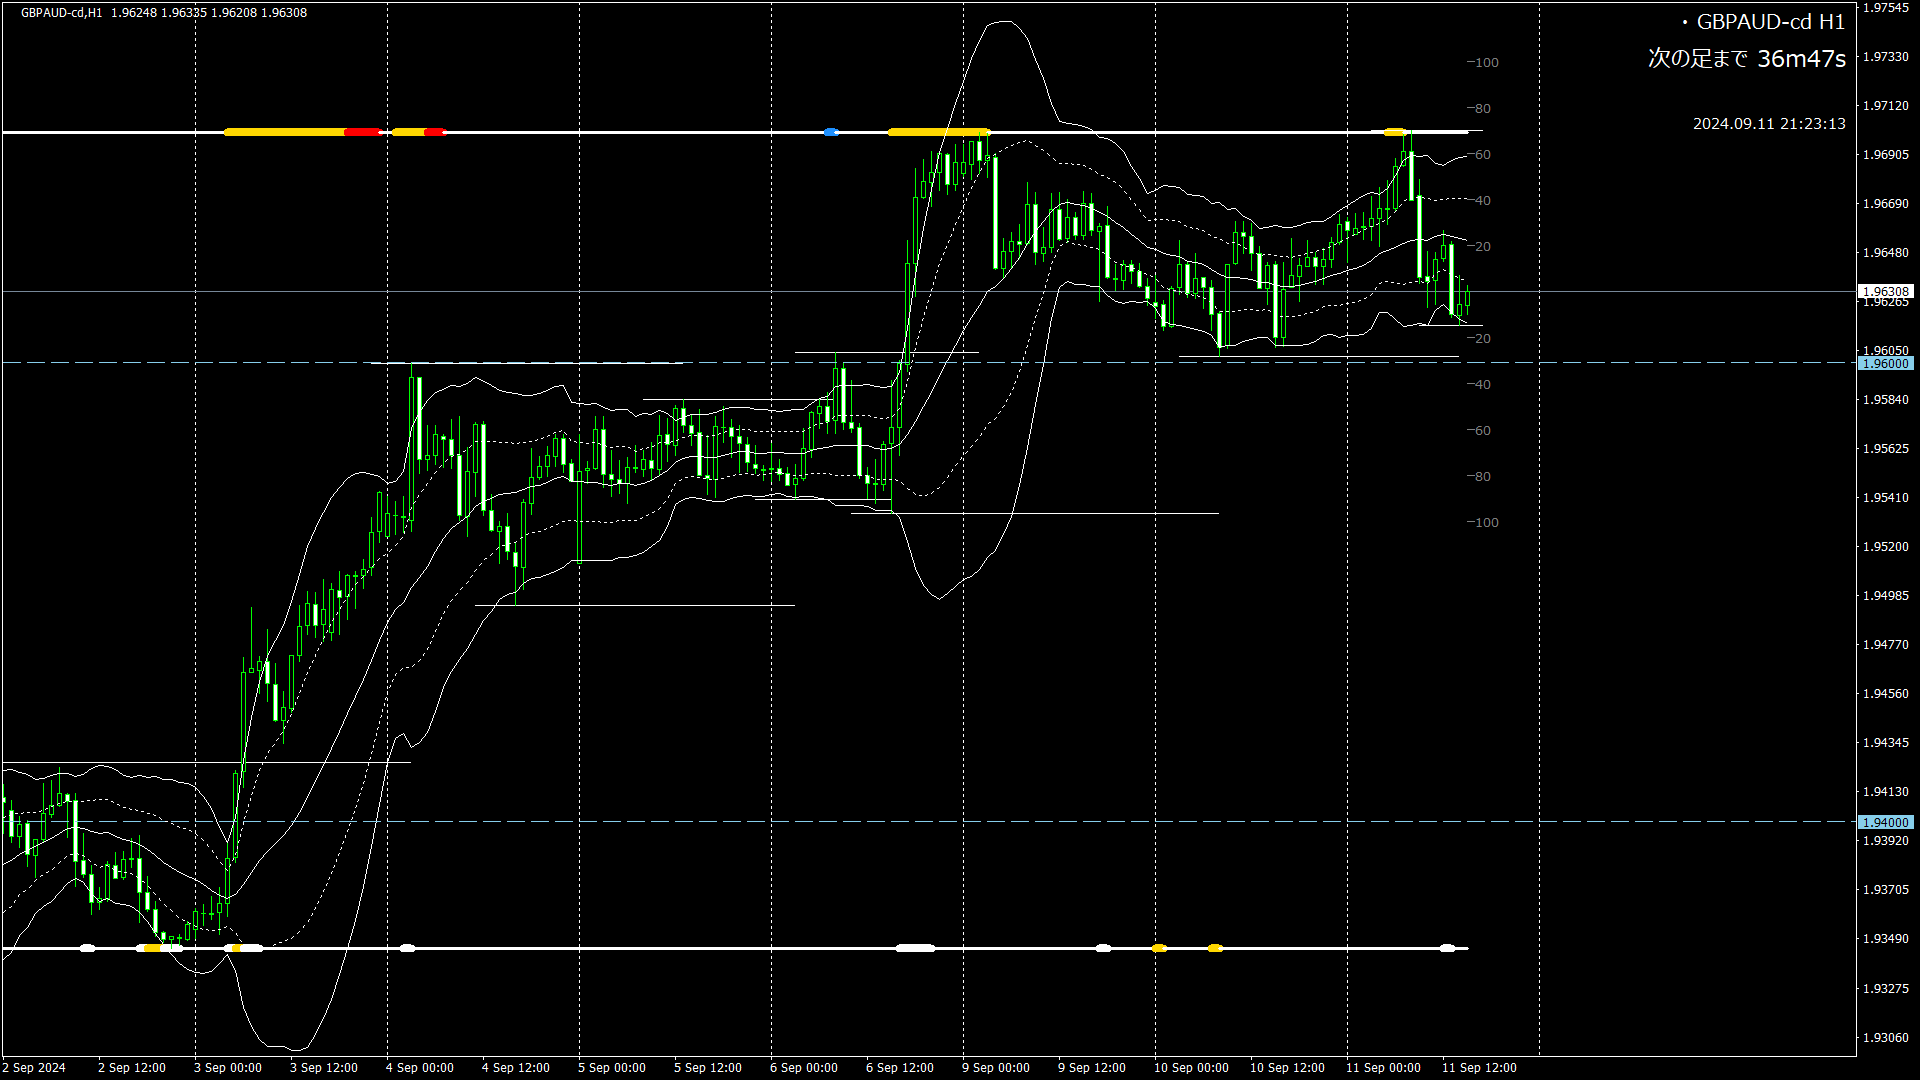
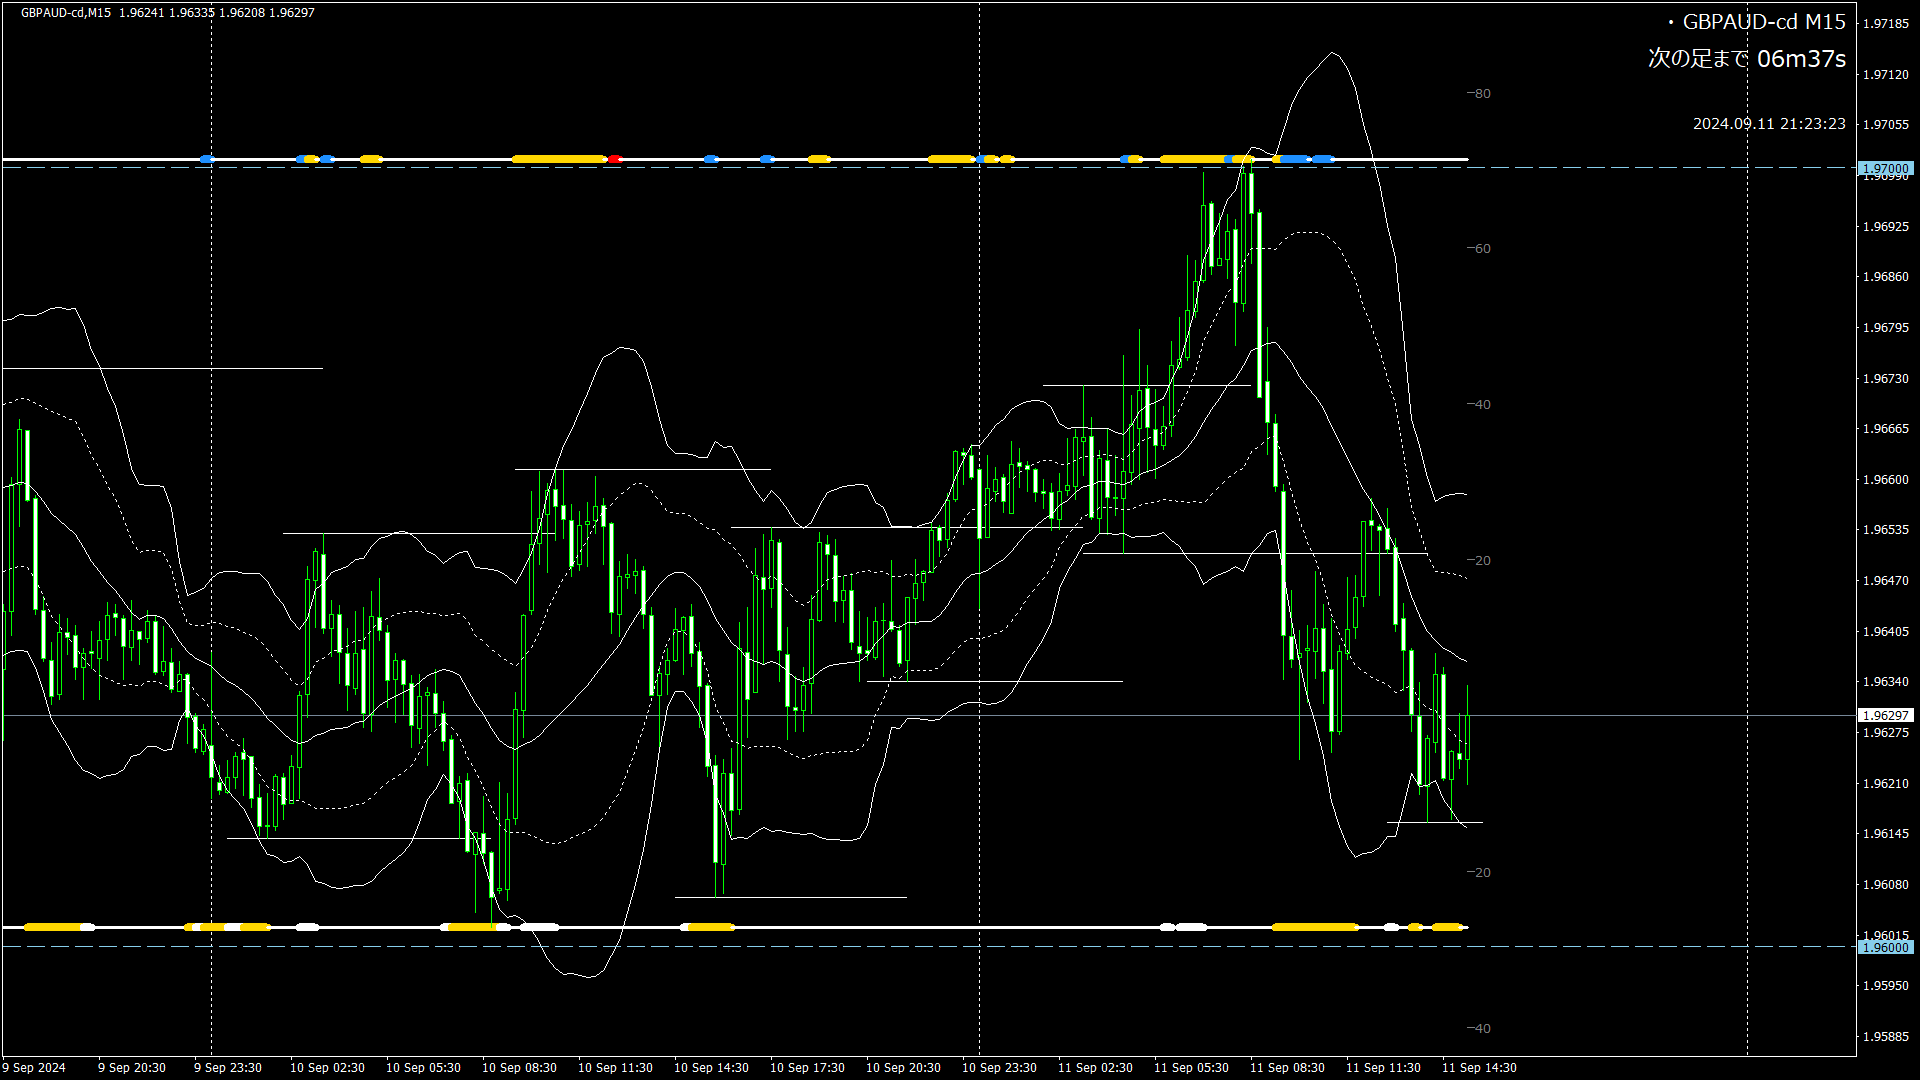
ActuallyBollinger Bands’sexpansion detectiontool I am using.
The base is an indicator that draws horizontal lines.
The horizontal line between the high and low is drawn as the peak itself.
Where two or more peaks overlap, I draw a horizontal line
which was already released as an indicator, but
this time I draw lines at each peak (both peaks and troughs).
The display of expansion is shown with color on the lines of the high and low, as follows.
- If expansion occurs for both standard deviation 1 and 2 → yellow
- If expansion occurs for only standard deviation 1 → red
- If expansion occurs for only standard deviation 2 → blue
- If there is no expansion → white
Below is an example of the display.
In addition, a past verification mode for “entry by horizontal line” is included.
This feature will be introduced next time.
That is all.