
Cycle Theory - Environmental Awareness | GBPAUD 2024.9.9 (pm10:30)
This is Aime. Good evening.
Last night was my friend's birthday, so I brought four bottles of alcohol to my friend's house to celebrate.
It was a fun drinking party, but around when the date changed, my wife ended up getting overwhelmed, and I feel sorry for what happened.
I just went to check in the early evening and saw that she looked well, which was good.
I was asked to drink again, so I guess I’ll go drinking once more without learning my lesson. lol
Now, for tonight’s market environment awareness, I will deliver it for GBP/AUD (GBPAUD).
Environmental Awareness
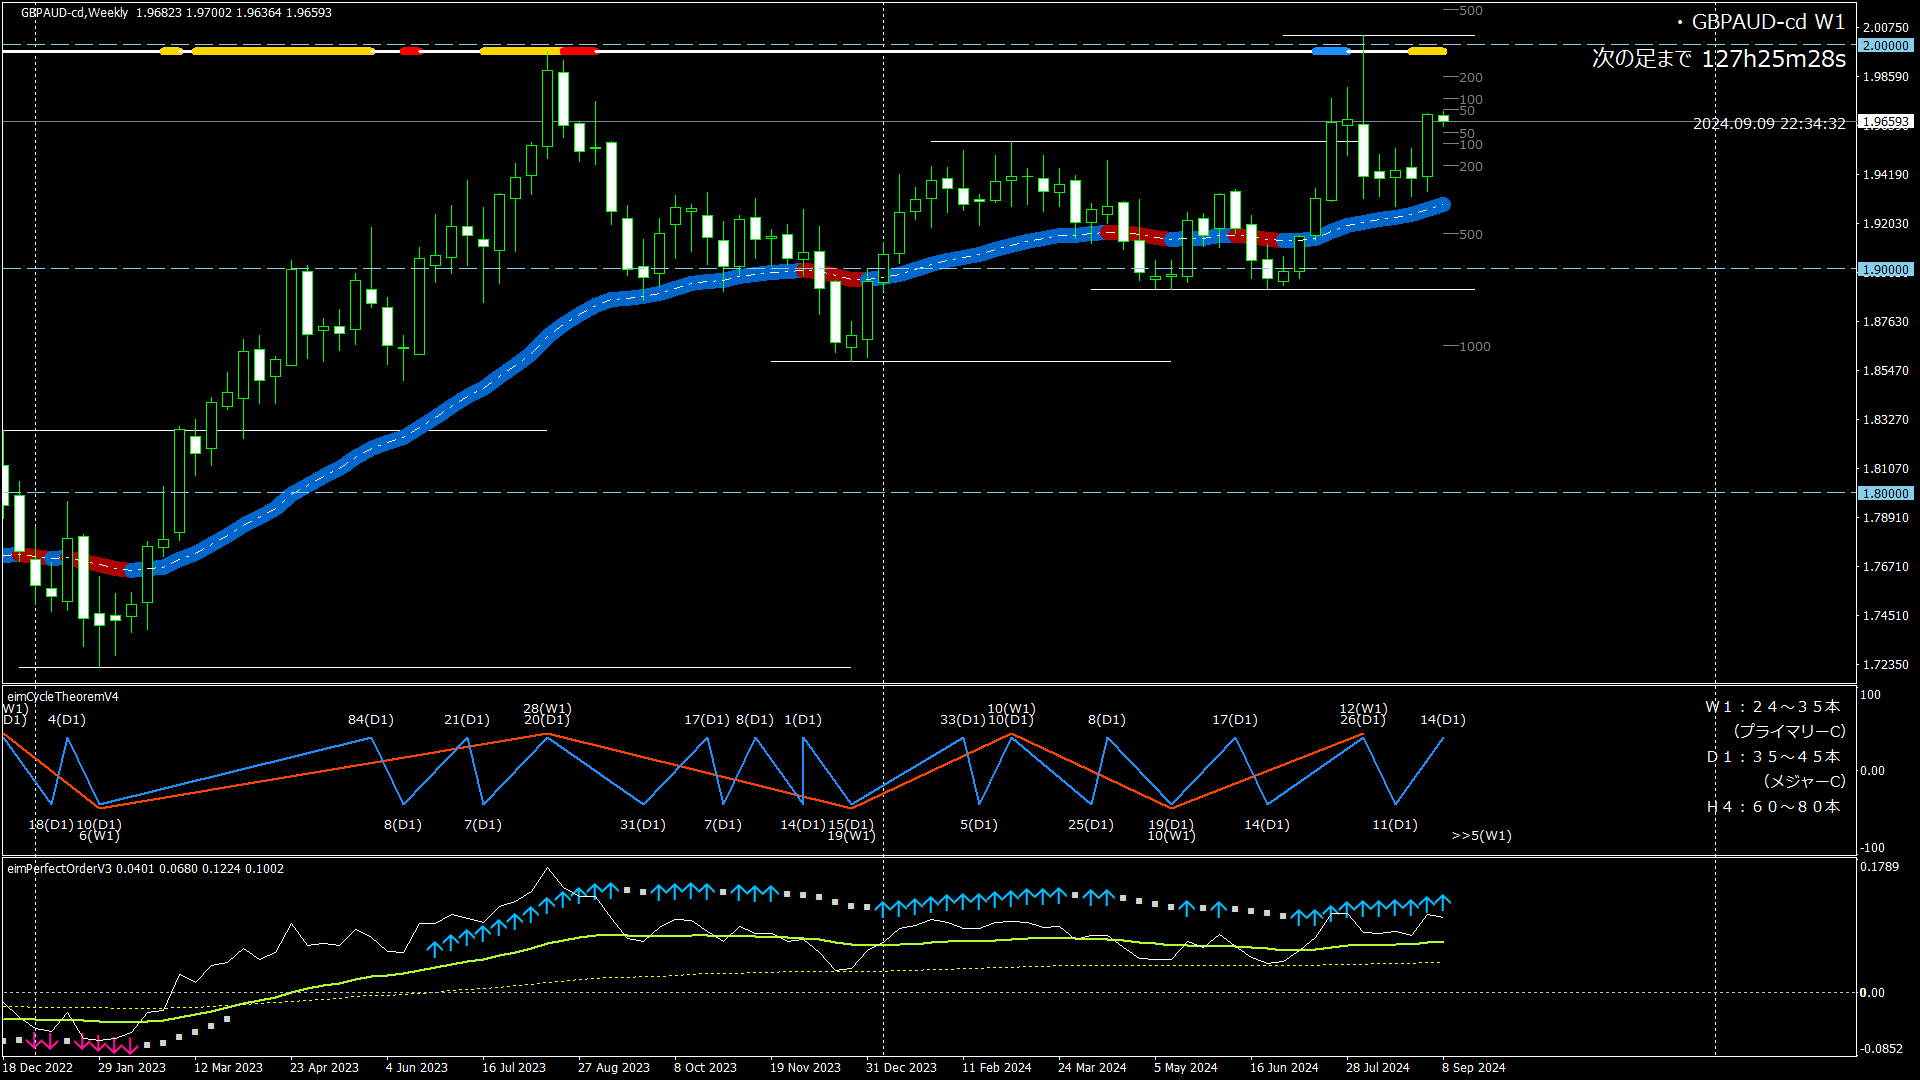
Weekly Cycle
Cycle theory: The W1 cycle is currently the 18th, with the high set on the 13th. It is currently moving toward the low.
(Usually 24–35 bars per cycle)
Moving averages: gradually rising.
Perfect Order: rising signal is on. The signal will remain on for a while.
Bollinger Bands: expansion on the upside
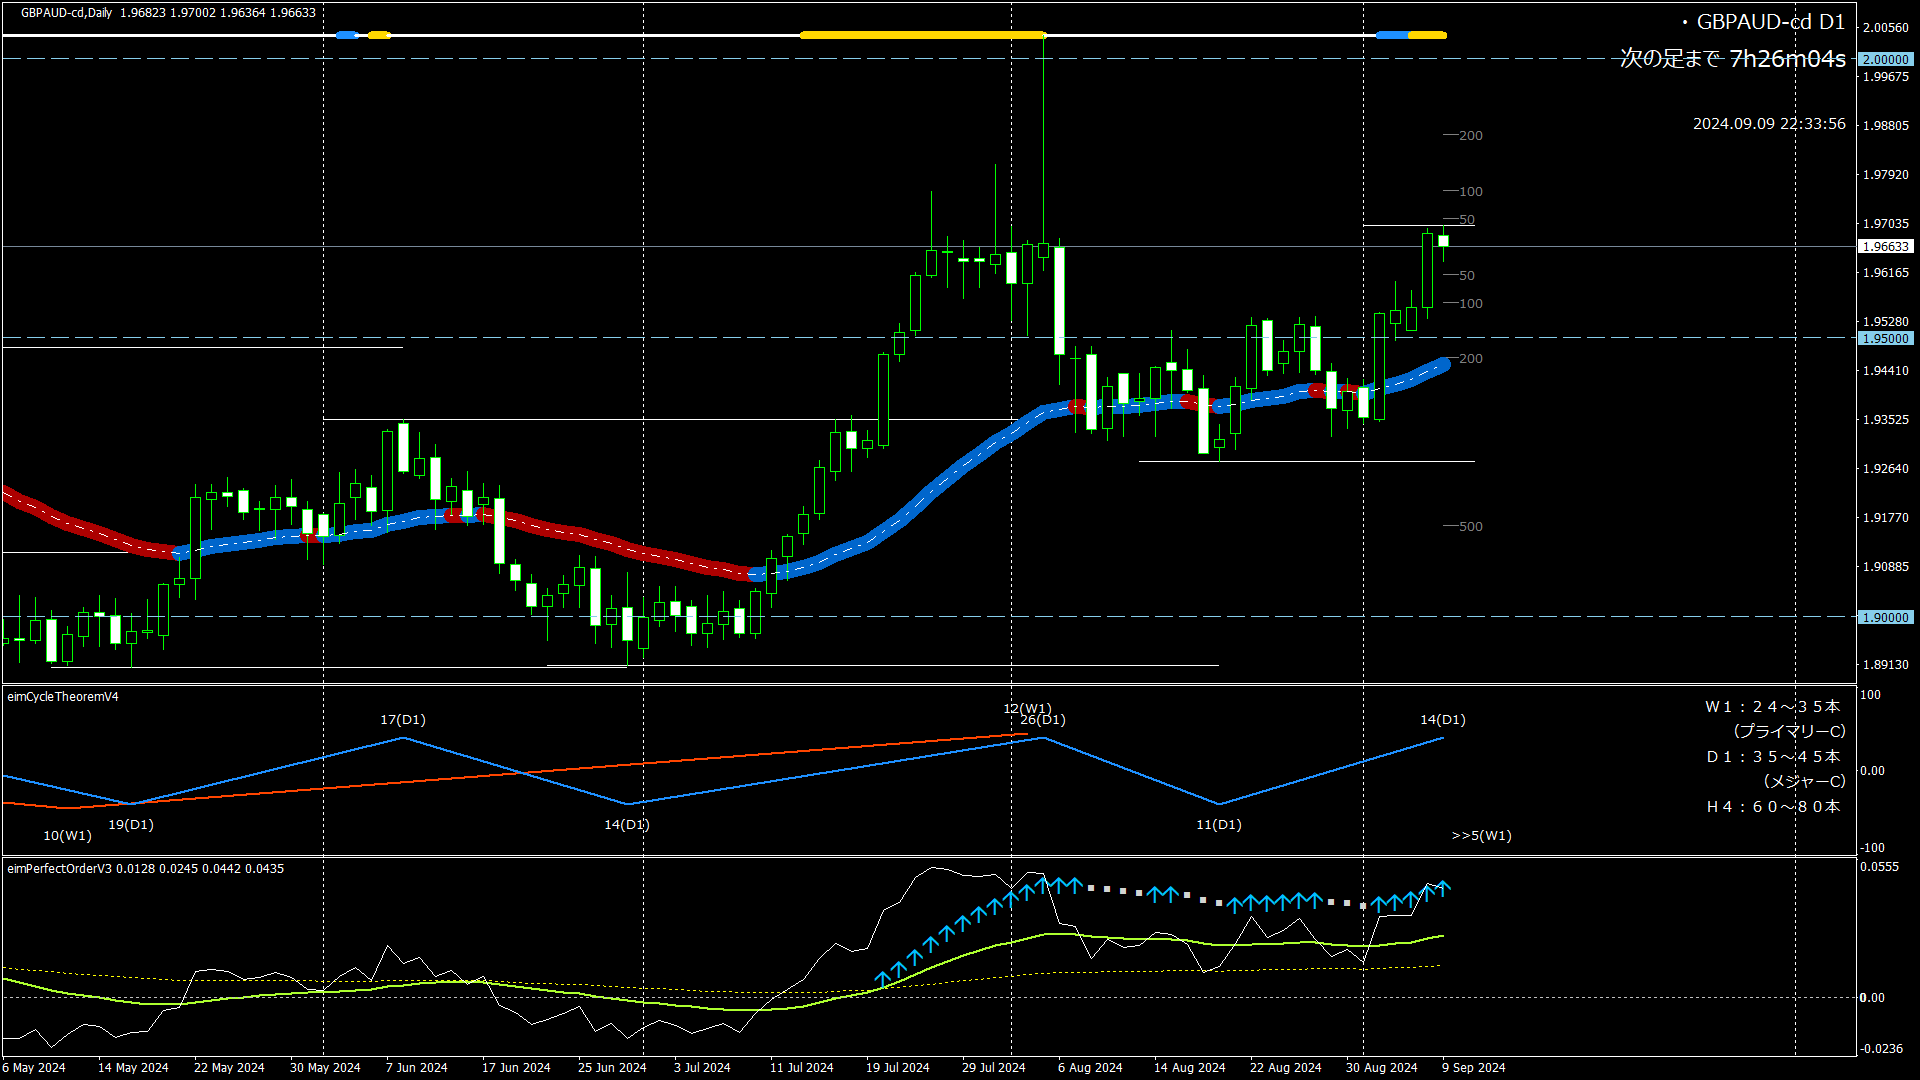
Daily Cycle
Cycle theory: The D1 cycle is currently the 15th. As feared in the previous environmental awareness (9/5 Thursday), the high was updated (Zigzag also repainted), updating the high position to the 15th.
From a cycle theory perspective, it appears to be heading toward a low, but it is testing the 1.9700 line, so the outcome of this battle is worth watching.
→ On today’s candlestick, a close above 1.97 indicates bullish momentum; if it returns to around the previous day’s open, bearish momentum is seen.
(Usually 35–45 bars per cycle)
Moving averages: rising.
Perfect Order: rising signal is on. Likely to continue for a while.
Bollinger Bands: expansion on the daily chart as well.
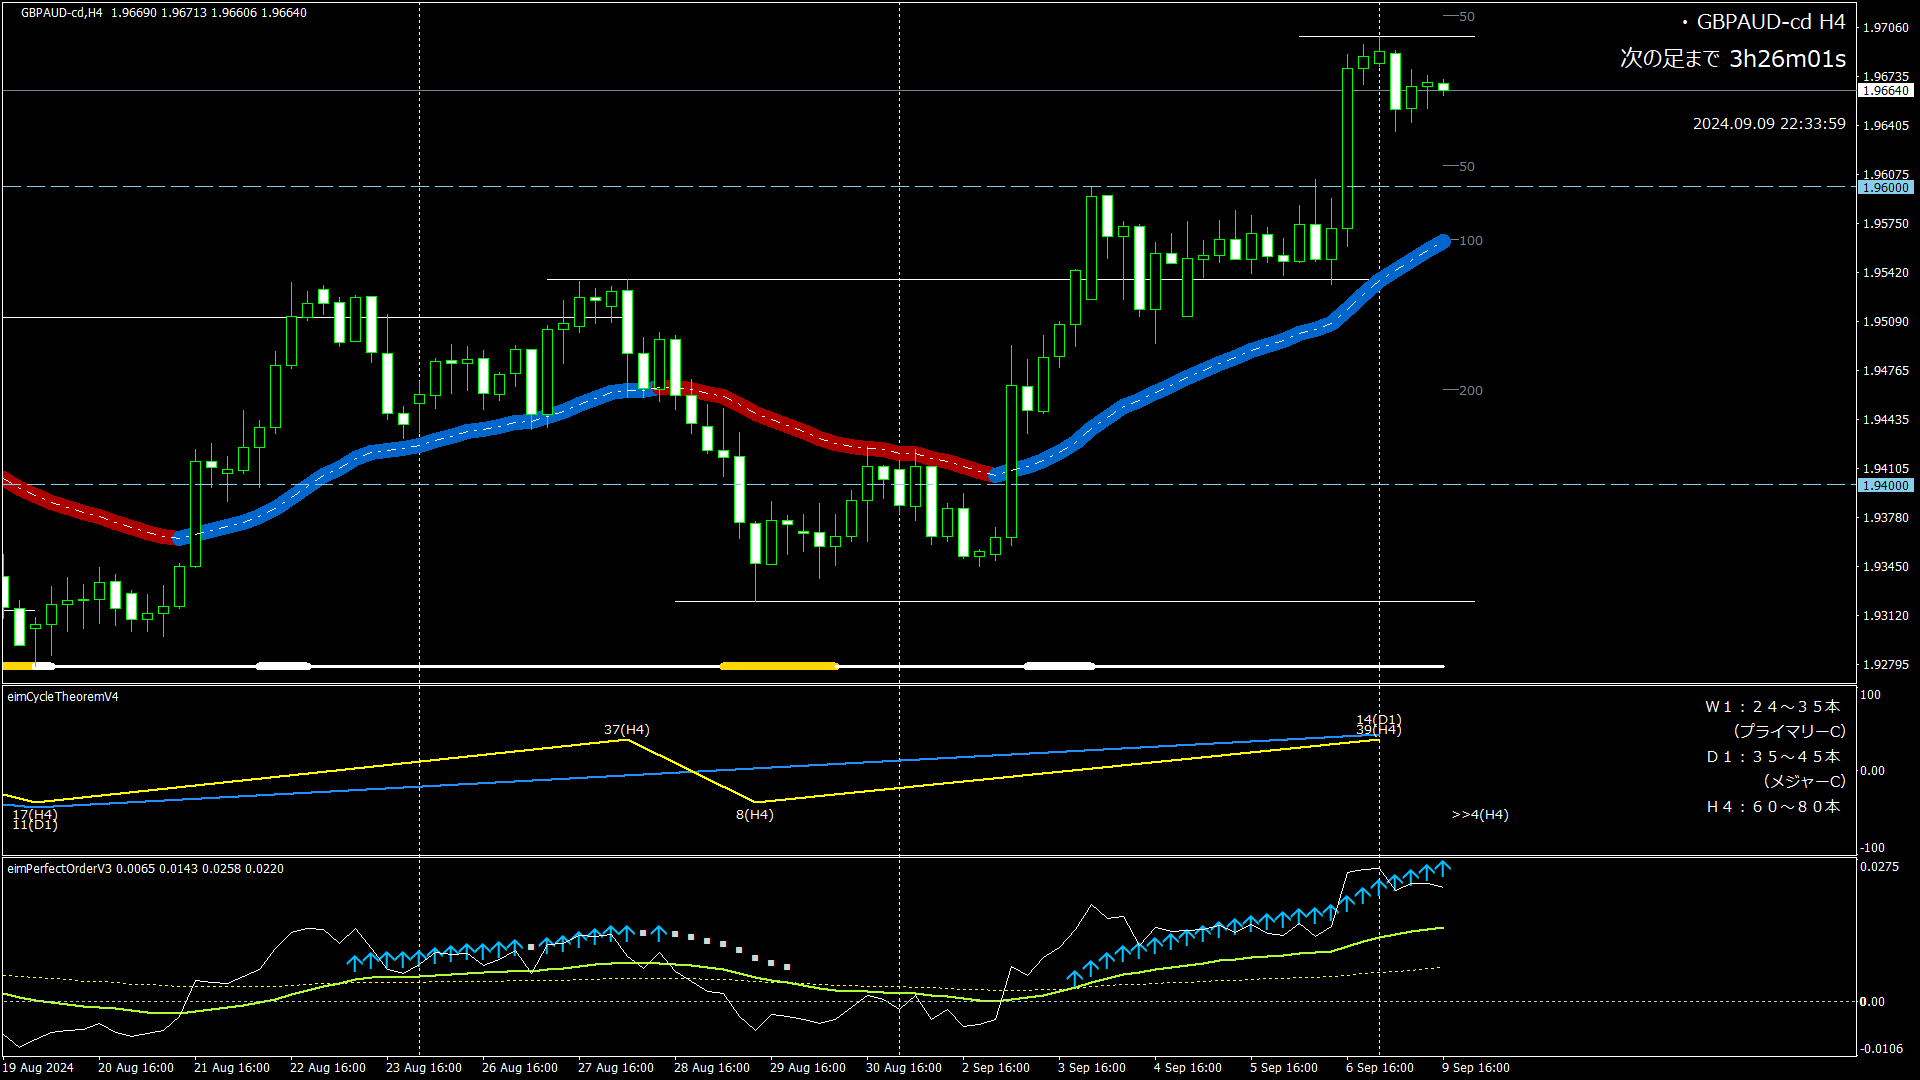
4-Hour Cycle
Cycle theory: The H4 cycle is currently the 44th, with the high at the 40th. As with the daily chart, the high position has been updated (repainted). Cycle theory suggests this is a long cycle, and it is expected to move toward a low and then return up to the moving average.
(Usually 24–35 bars per cycle)
Moving averages: rising.
Perfect Order: rising signal is on. Because the distance between the short-term MA and the daily chart has widened, the PO signal is expected to continue for a while longer.
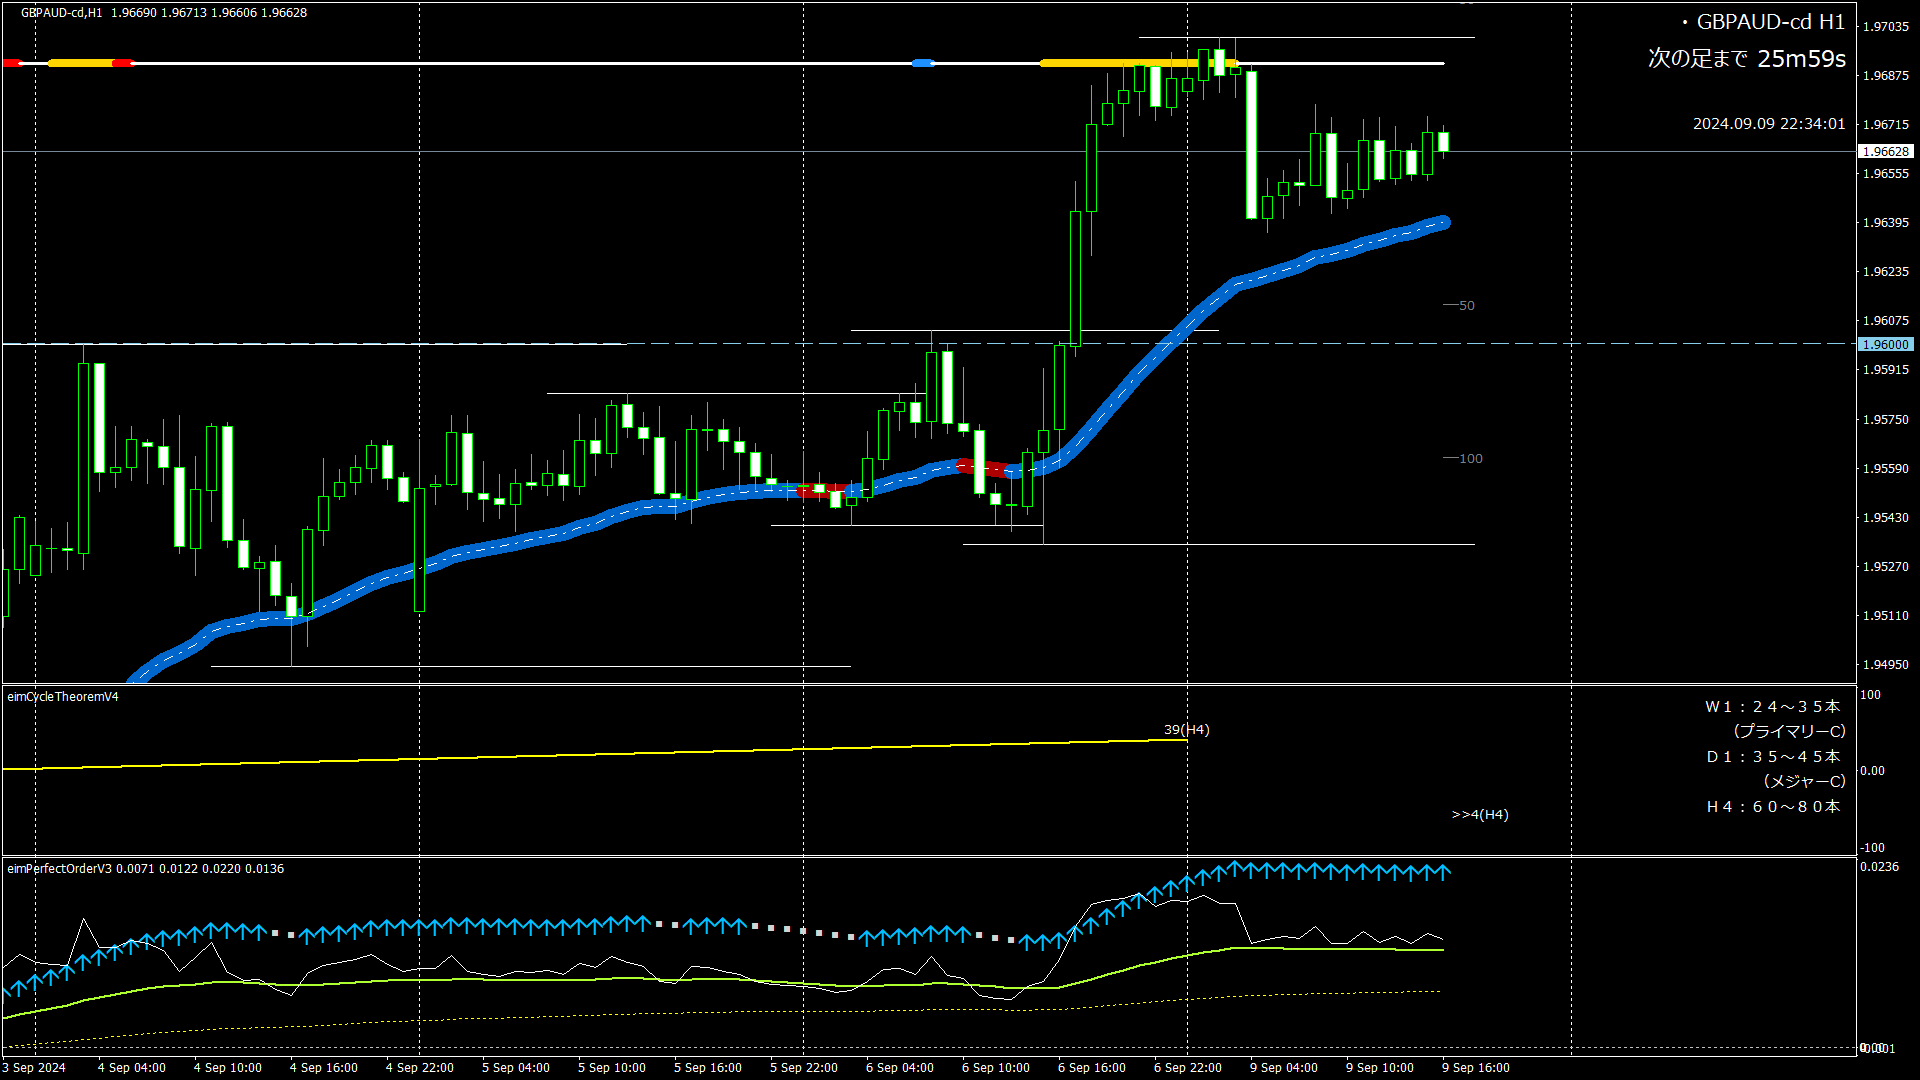
※ Reference: 1-hour chart (no commentary)

Entry Judgment
Sell bias, aiming for a decline.
If the recent high of 1.97 is exceeded, apply a stop loss
(That is all for the environmental awareness based on cycle theory.)
*1) This is a research article on environmental awareness based on cycle theory.
*2) Trading stance:
Determine the perspective on the daily and 4-hour charts, and adjust entry timing on the hourly chart.
*3) The article title and the times in the upper right of each chart are in Japan Standard Time.
That is all for today. Thank you very much.
(Reference) Description of the image
<Top> Candlestick chart. The thick line is the moving average (MA). MA rising is shown in blue; when it falls, it is shown in red.
<Middle> Cycle theory. Yellow is the 4-hour cycle. Blue is the daily cycle (= major cycle). Red is the weekly cycle (= primary cycle). The numbers at the peaks (mountains) and troughs indicate the number of candles since the previous peak. Note that the first bar is not counted. The ">> numbers" on the right indicate the number of candles from the last peak to the current point.
<Bottom> Perfect Order (= PO).
・Arrows (↑↓) indicate a complete PO, and a square (■) indicates that the closing price has crossed the MA (which is considered a sign that PO is about to break).
・The line graph shows positions based on the long-term MA.
Yellow dotted line shows the position of the mid-term MA. The light green solid line shows the position of the short-term MA. The white solid line shows the closing price position.