
Cycle Theory - Environmental Recognition | USDJPY (2024.9.6 pm06:00)
This is Eime.
This evening, we will deliver the environment recognition for USDJPY.
Environmental Recognition
Medium to long term (weekly level): a new cycle has begun.
Up to now, it has been in an uptrend with light translation, but now we will watch whether the level of resistance changes (i.e., whether the trend becomes down).
On the daily chart, the trend is down. It is being held down by moving averages, preventing a rise.
On the 4-hour chart, it is regarded as the start of a new cycle and heading toward higher values.
(For details, please refer to the following)
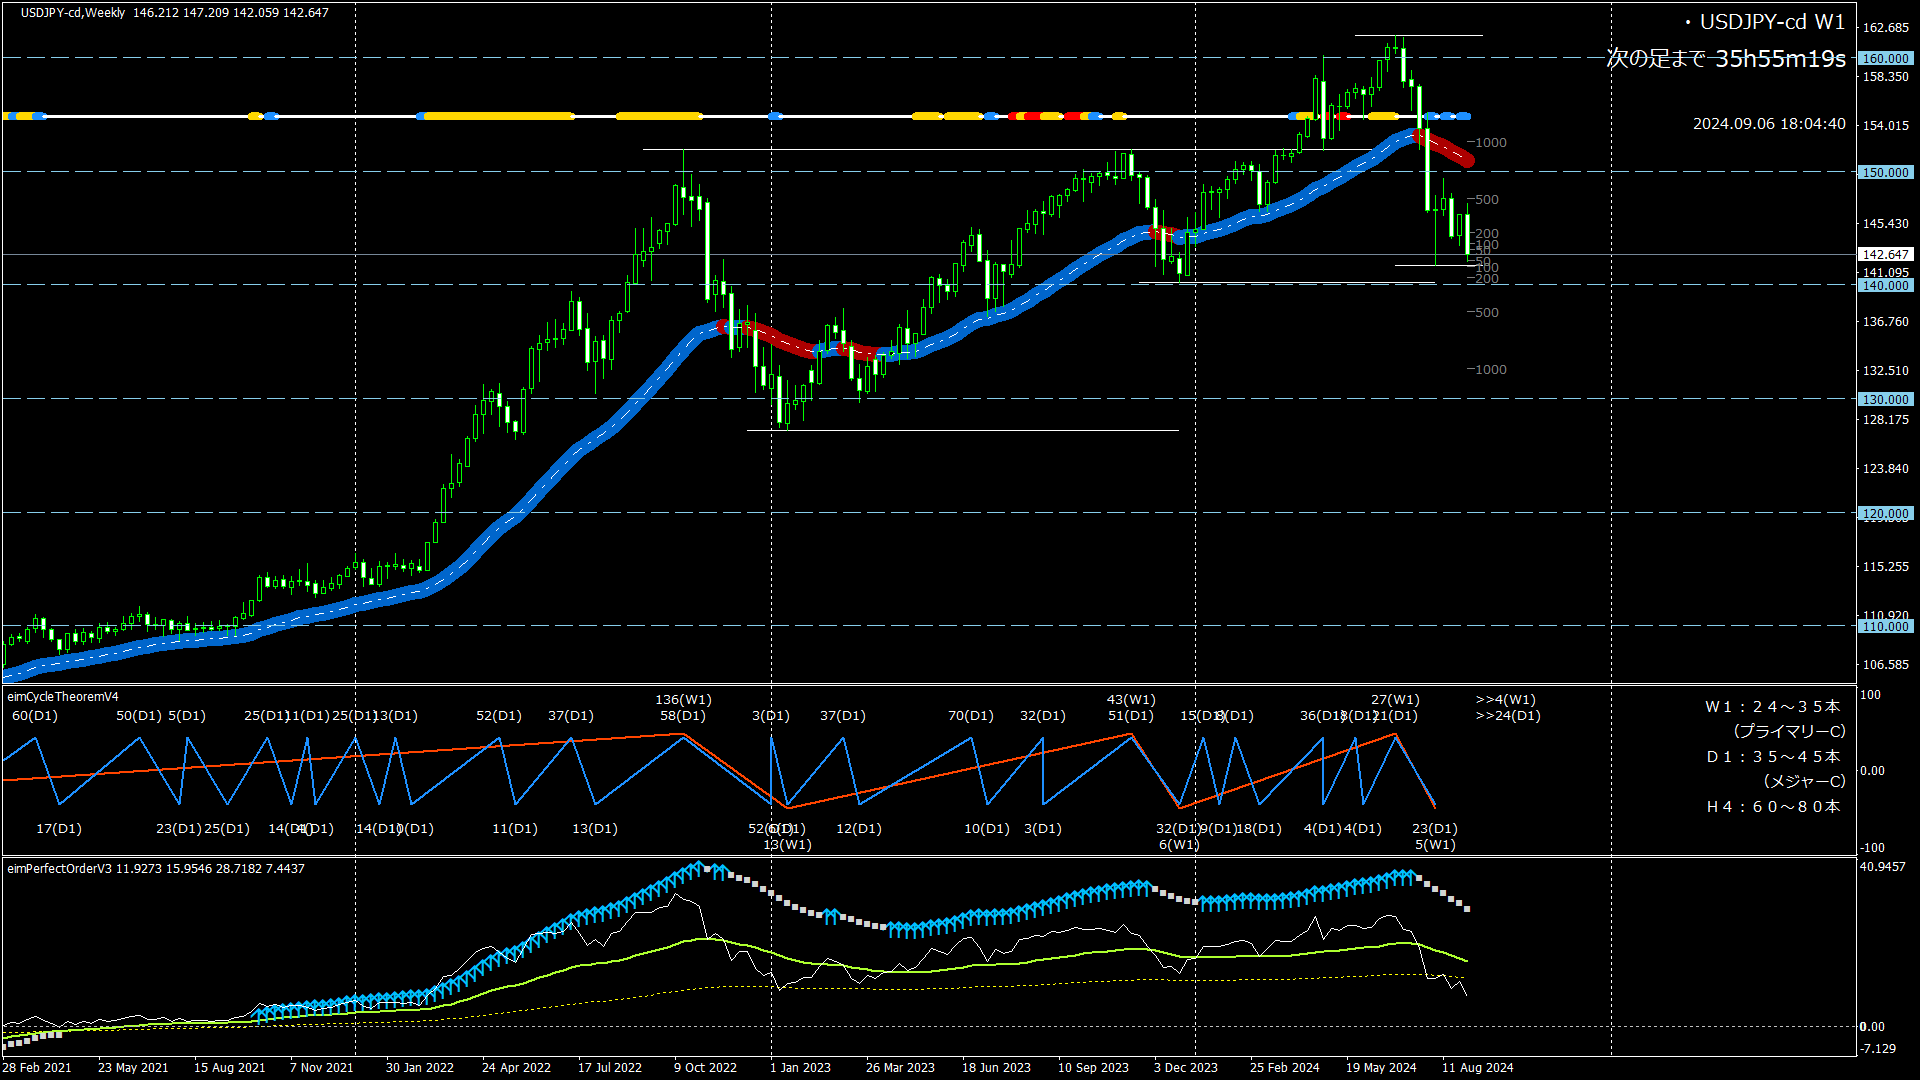
Weekly Cycle
Cycle theory: W1 cycle is currently the fifth bar. It is heading toward a high, but since the wick extended below five bars ago, it is slightly downward and range-bound.
(Typically 24–35 bars per cycle)
Moving average: has turned downward.
Perfect Order: The previous upward momentum has not yet ended, but the upward signal has collapsed (close price closed below the short-term MA).
Other: Bollinger Bands show downward expansion, indicating bearish pressure. If the price breaks below 141.698, a reevaluation of the cycle period will be necessary.
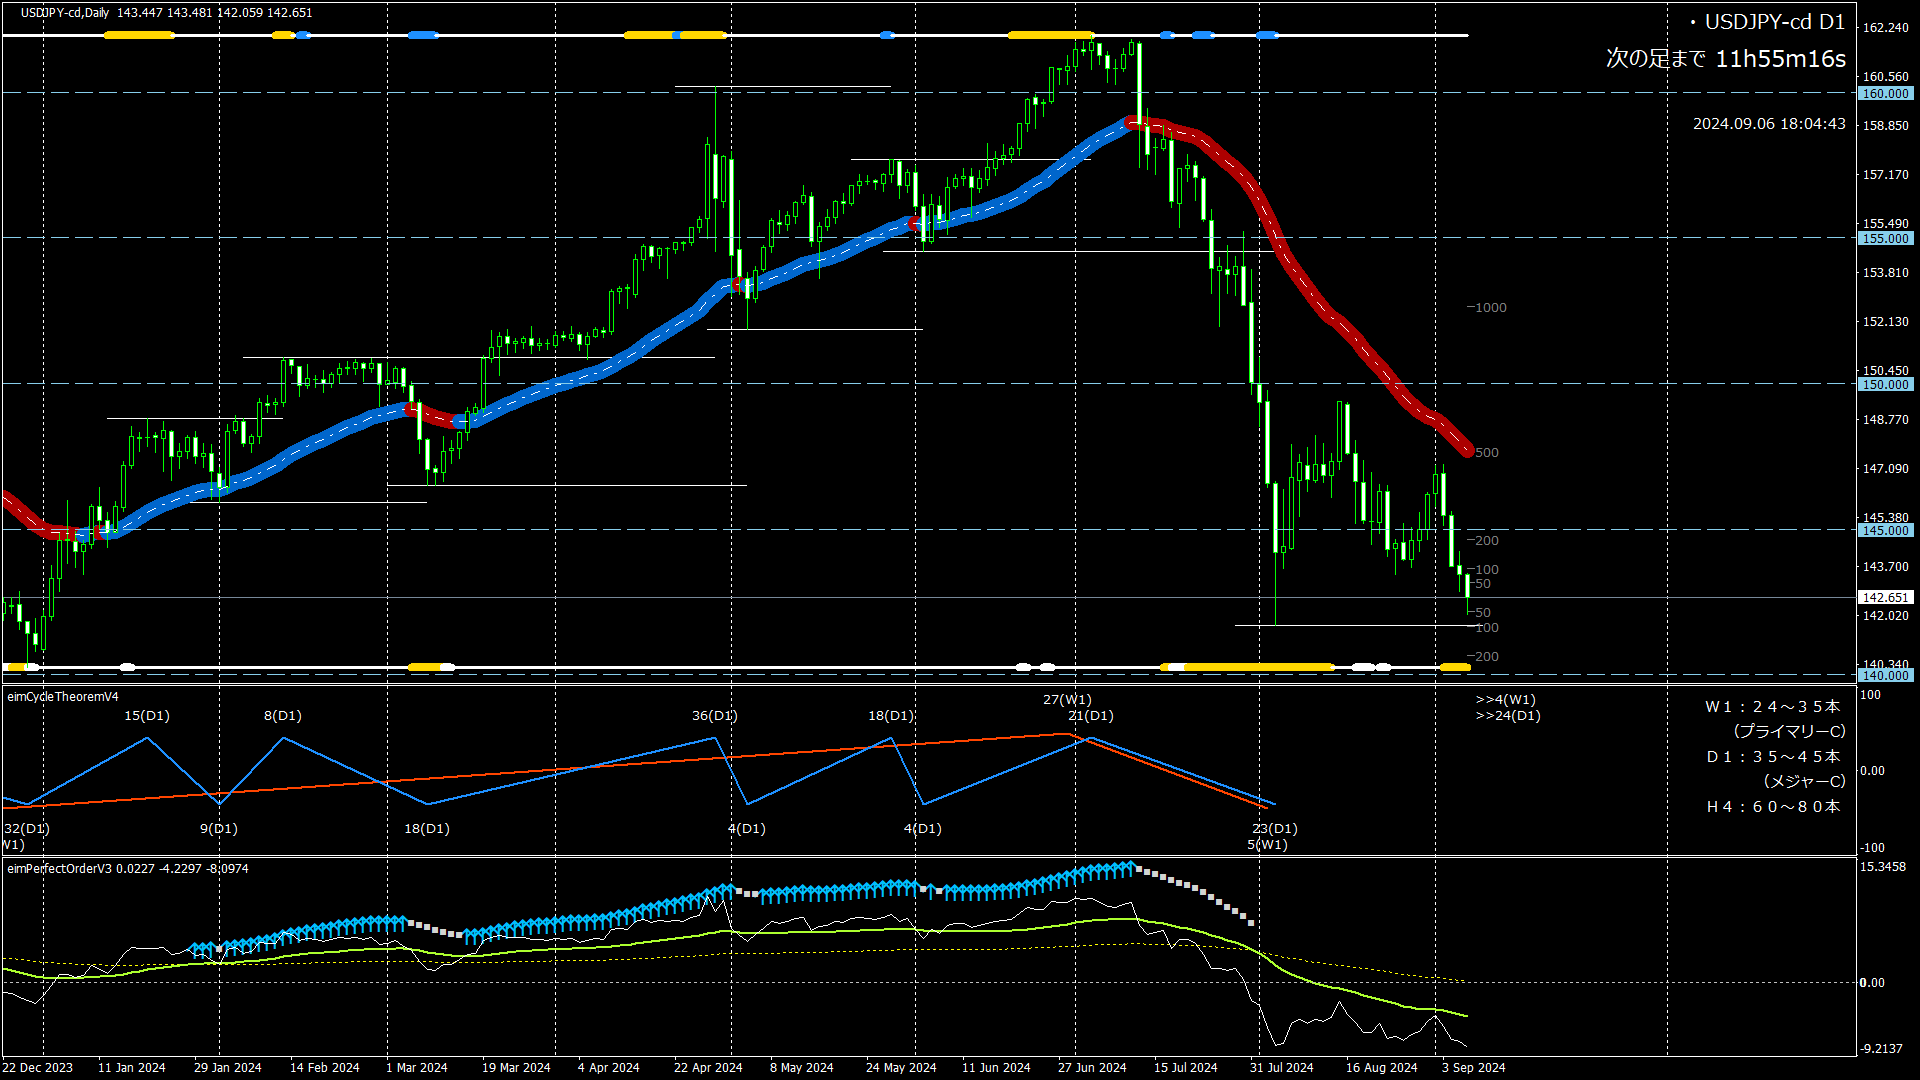
Daily Cycle
Cycle theory: D1 cycle is currently the 25th bar. It had been rising, but the preceding cycle was a down cycle, so this one is likely to be a left translation.
It is currently in a time zone heading toward a high, but unable to form a clear high and has been meandering. From a Zigzag perspective, a clear high has not been identified, but given the short cycle, there is a view that the highs on Aug 15–16 could be considered as highs.
(Typically 35–45 bars per cycle)
Moving average: continues to decline.
Perfect Order: Signals are off. However, mid-term PO seems to be overtaking the long-term PO, and a downward PO signal may light up.
Other: On the daily chart, Bollinger Bands show downward expansion, indicating bearish pressure; if price breaks below 141.698, a reevaluation of the cycle period will be necessary.
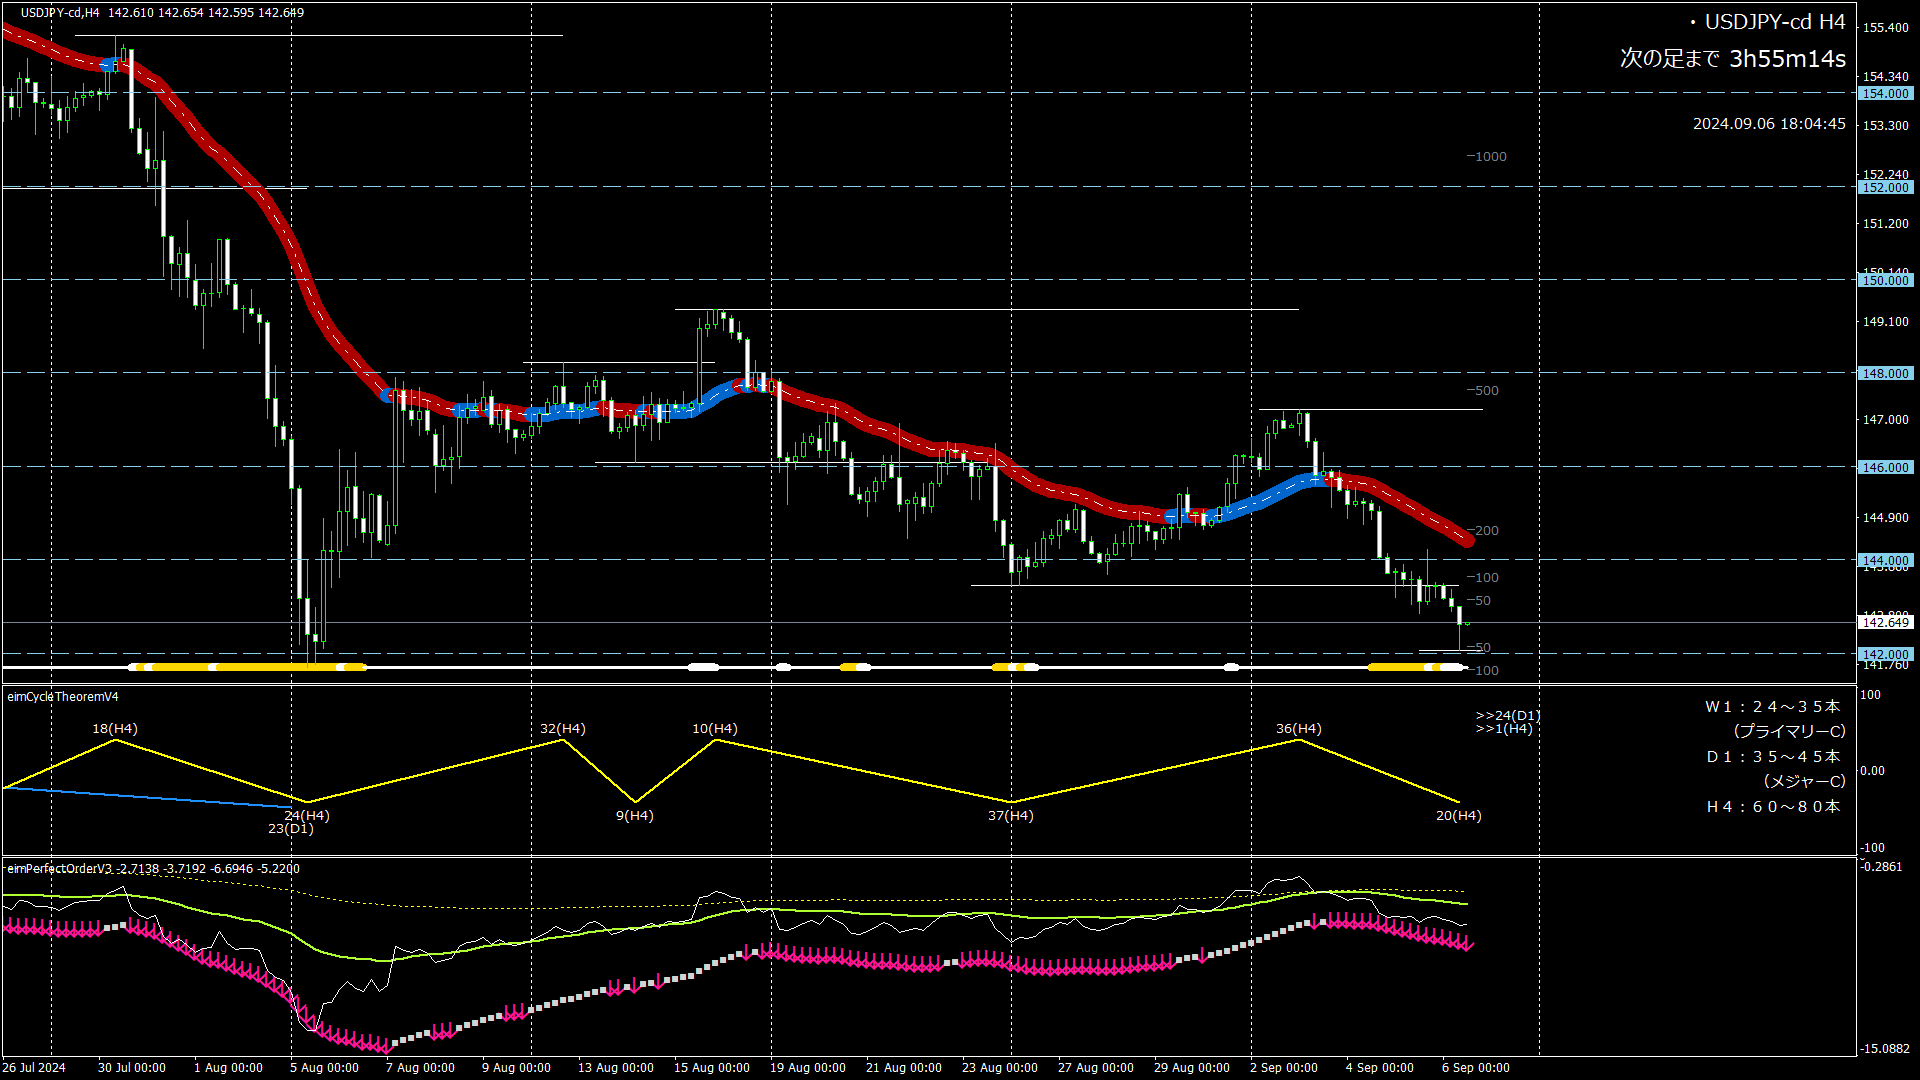
4-Hour Cycle
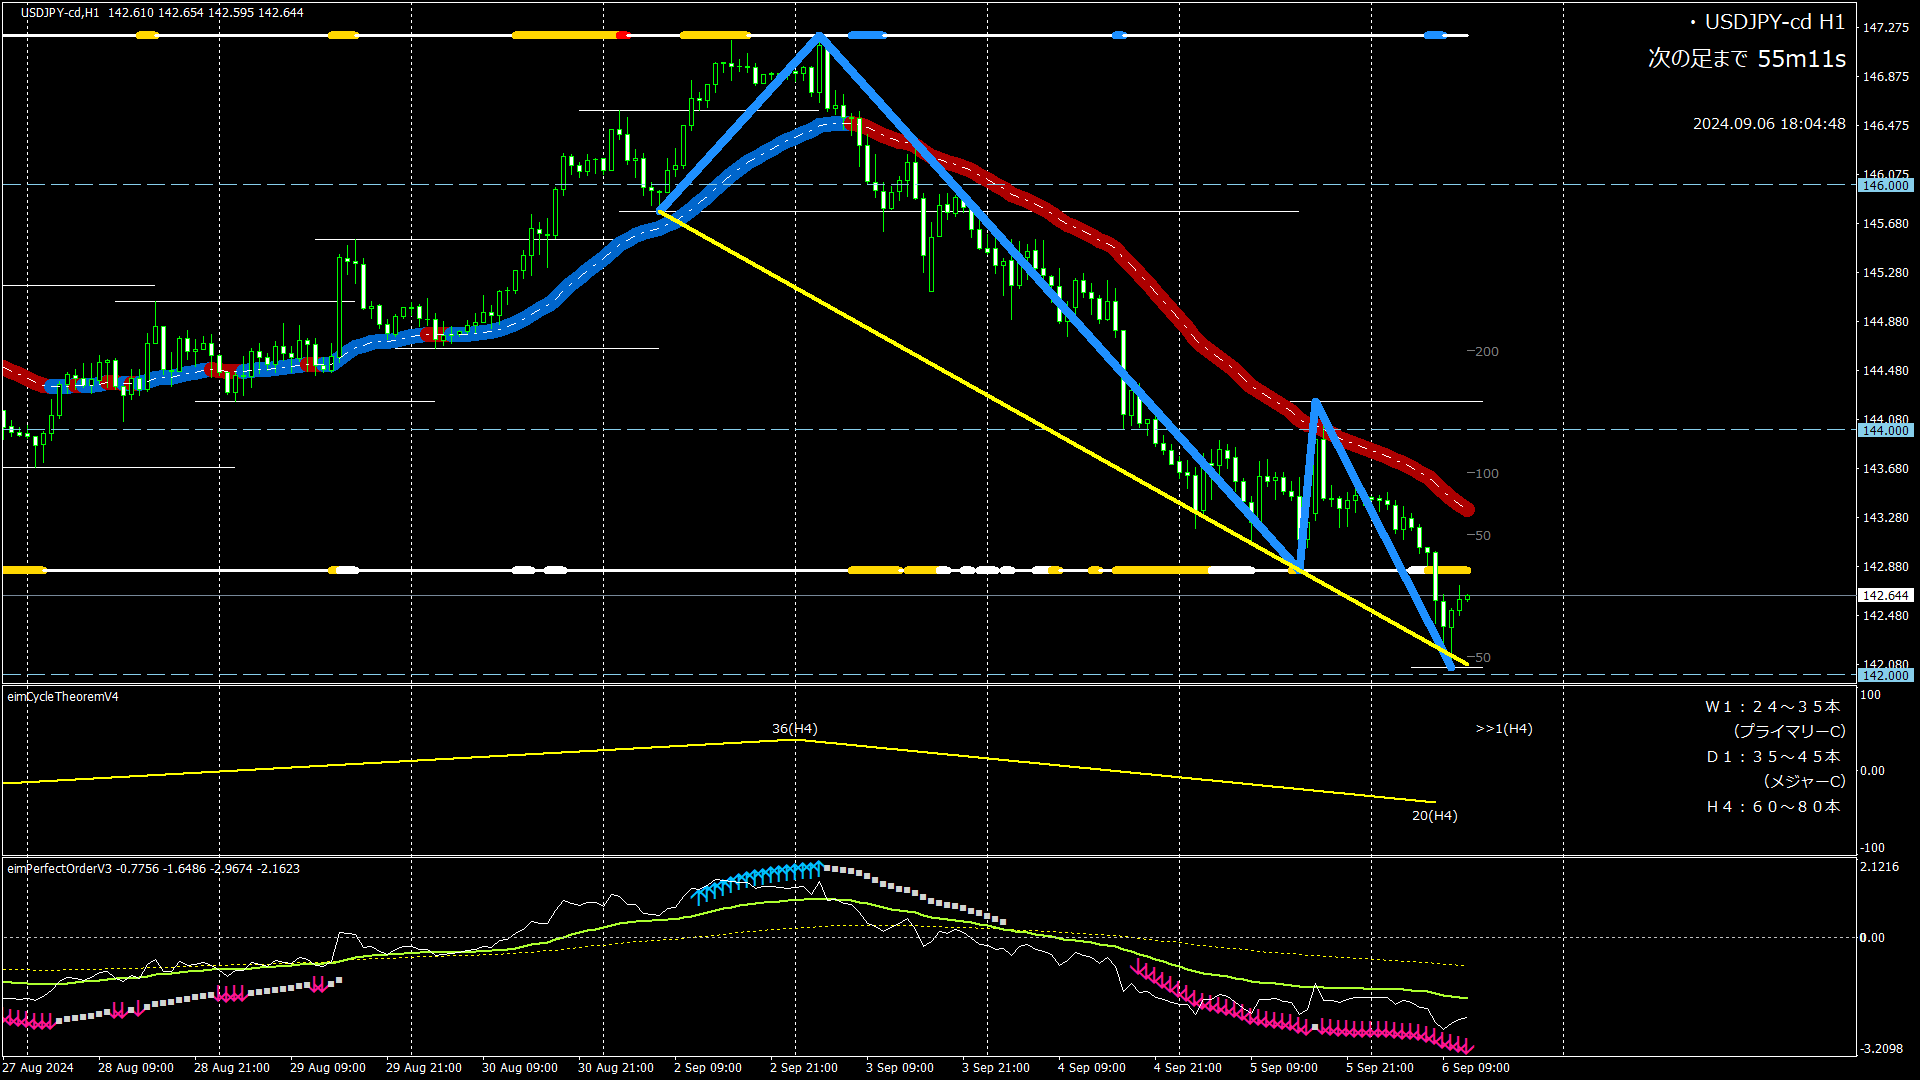
Cycle theory: H4 cycle is considered to have entered a new cycle after putting a lower wick two bars ago. It is currently the second bar.
(Typically 24–35 bars per cycle)
Moving average: declining. However, there is a widening gap between the moving average and the price.
Perfect Order: Downward signal is lit.
Other: Range around August 5th.
※ Reference: 1-hour chart (no commentary)
↑↑↑ A W-top had appeared.

Entry Judgment
Bullish view. From cycle theory perspective, a reversal is in sight.
Assume that the H4 moving average will act as resistance and target up to the retracement level.
If the H4 moving average rebounds, the plan is to switch to a selling scenario.
Also, if the price continues to fall below 141.698 as is, this line will require cycle period reevaluation (i.e., a scenario revision).
(End of environmental recognition based on cycle theory)
*1) This is a research article on environmental recognition based on cycle theory.
*2) Trading stance:
Determine the appropriate view on both daily and 4-hour charts, and adjust entry timing on the 1-hour chart.
*3) The article title and the time in the top-right corner of each chart are in Japan Standard Time.
That is all for today. Thank you very much.
(Reference) Description of the image
<Top> Candlestick chart. The thick line is the moving average (MA). When MA is rising, it is shown in blue; when falling, in red.
<Middle> Cycle theory. Yellow is the 4-hour cycle. Blue is the daily cycle (= major cycle). Red is the weekly cycle (= primary cycle). The numbers at the peaks (mountains, valleys) indicate the number of candlesticks from the previous peak. Note that the first candlestick is not counted. The “>> number” on the far right shows the number of candles from the last peak to the current point.
<Bottom> Perfect Order (= PO).
- Arrows (↑↓) indicate a complete PO, and squares (■) indicate that the close price has crossed the MA (which is a sign that the PO may be breaking down).
- The line chart shows positions relative to the long-term MA.
Yellow dotted line indicates the position of the mid-term MA. Light green solid line is the position of the short-term MA. White solid line is the position of the closing price.
---