
Cycle Theory - Environmental Recognition | EURUSD (2024.9.4 pm9:10)
Good evening. It’s me, Ame.
Today, on my way back from the office, I stopped by Akihabara.
I had been using a wired mouse with my home casual PC, so I bought a wireless receiver-type mouse. It’s pure white and very smooth. It feels lighter than I expected, but this is surprisingly nice in its own way. (There were other things I bought as well, you know?)
I started writing this article a little after 9:00, but the TV had “Ueda and the women…” on, and I couldn’t get any progress at all?! The Kansai women’s force knocked me out!!!
Now that I’ve regained my composure... tonight I’ll deliver an environmental view of EURUSD.
EURUSD trading volume should be high, but in Japan, not many people may be trading it.
Environmental View
In the medium-to-long term (weekly level), the decline has begun.
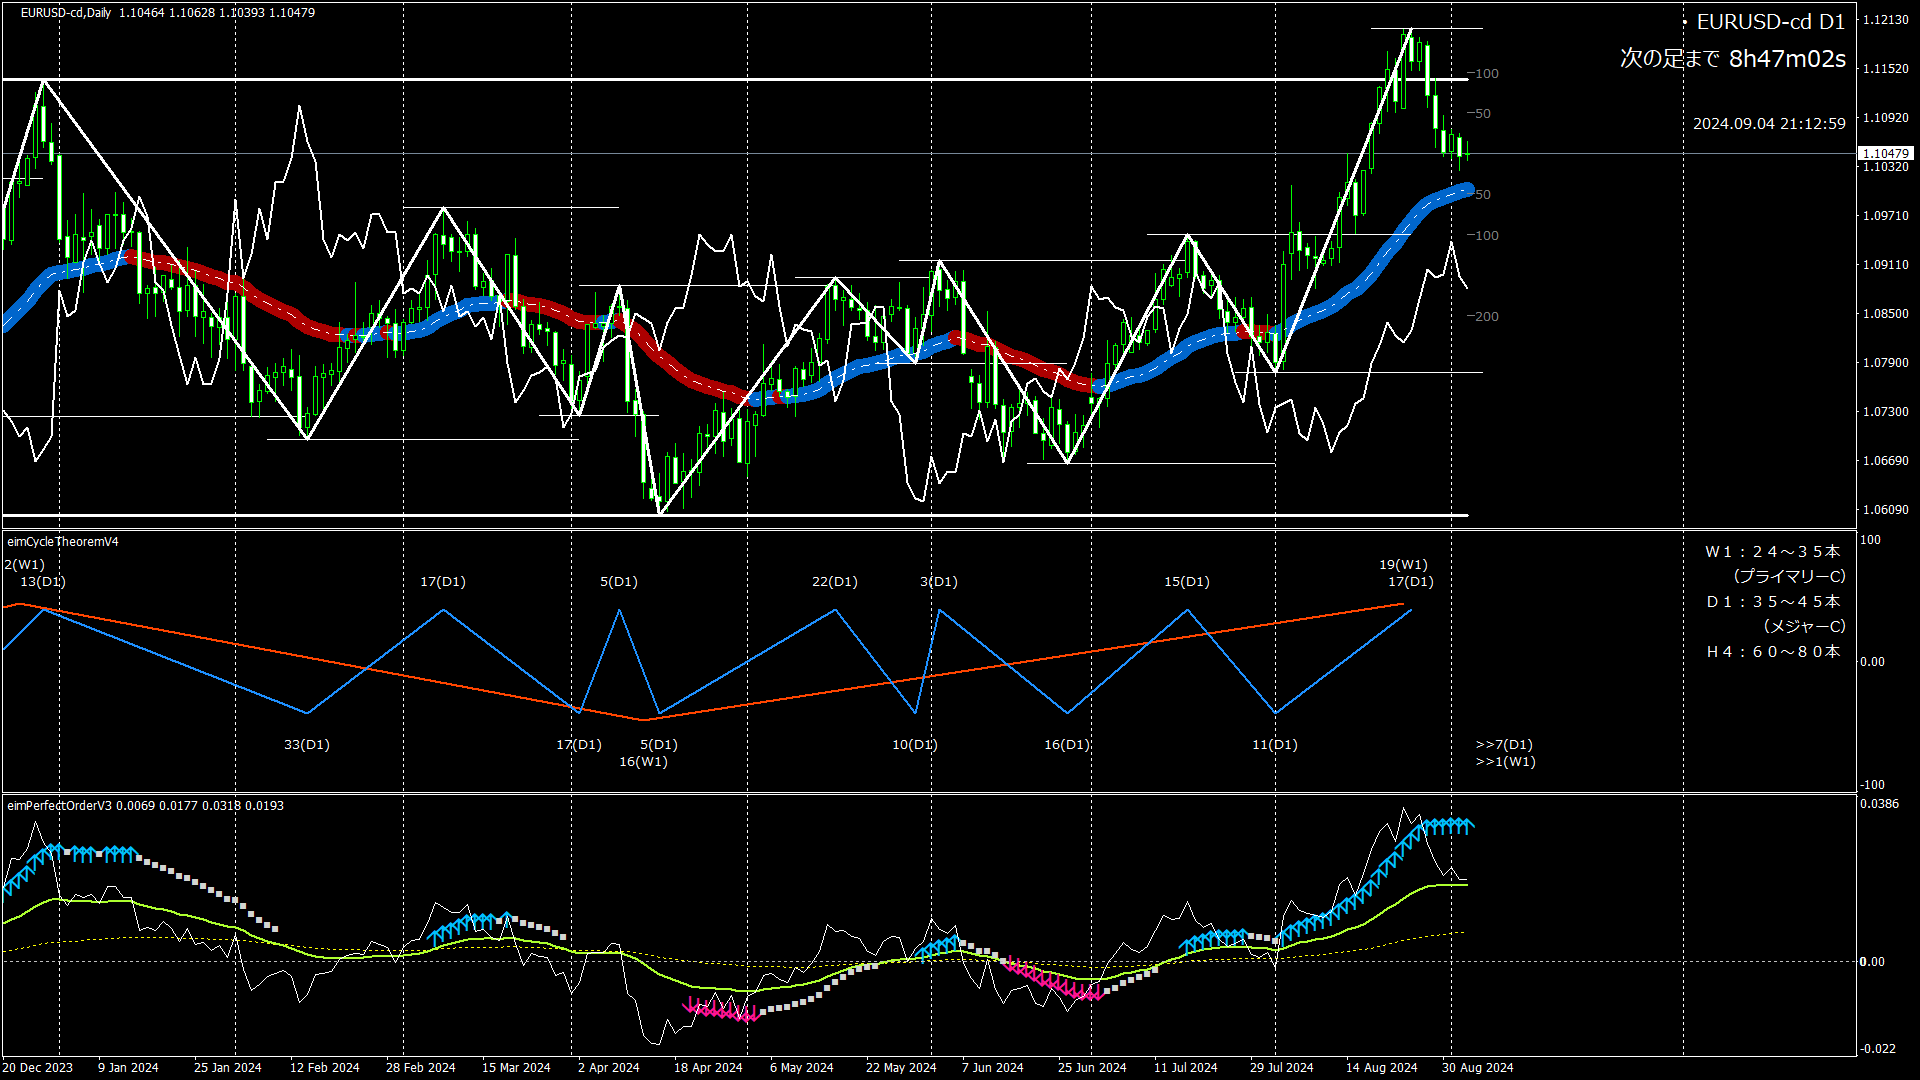
At the daily level, it is also in a downtrend.
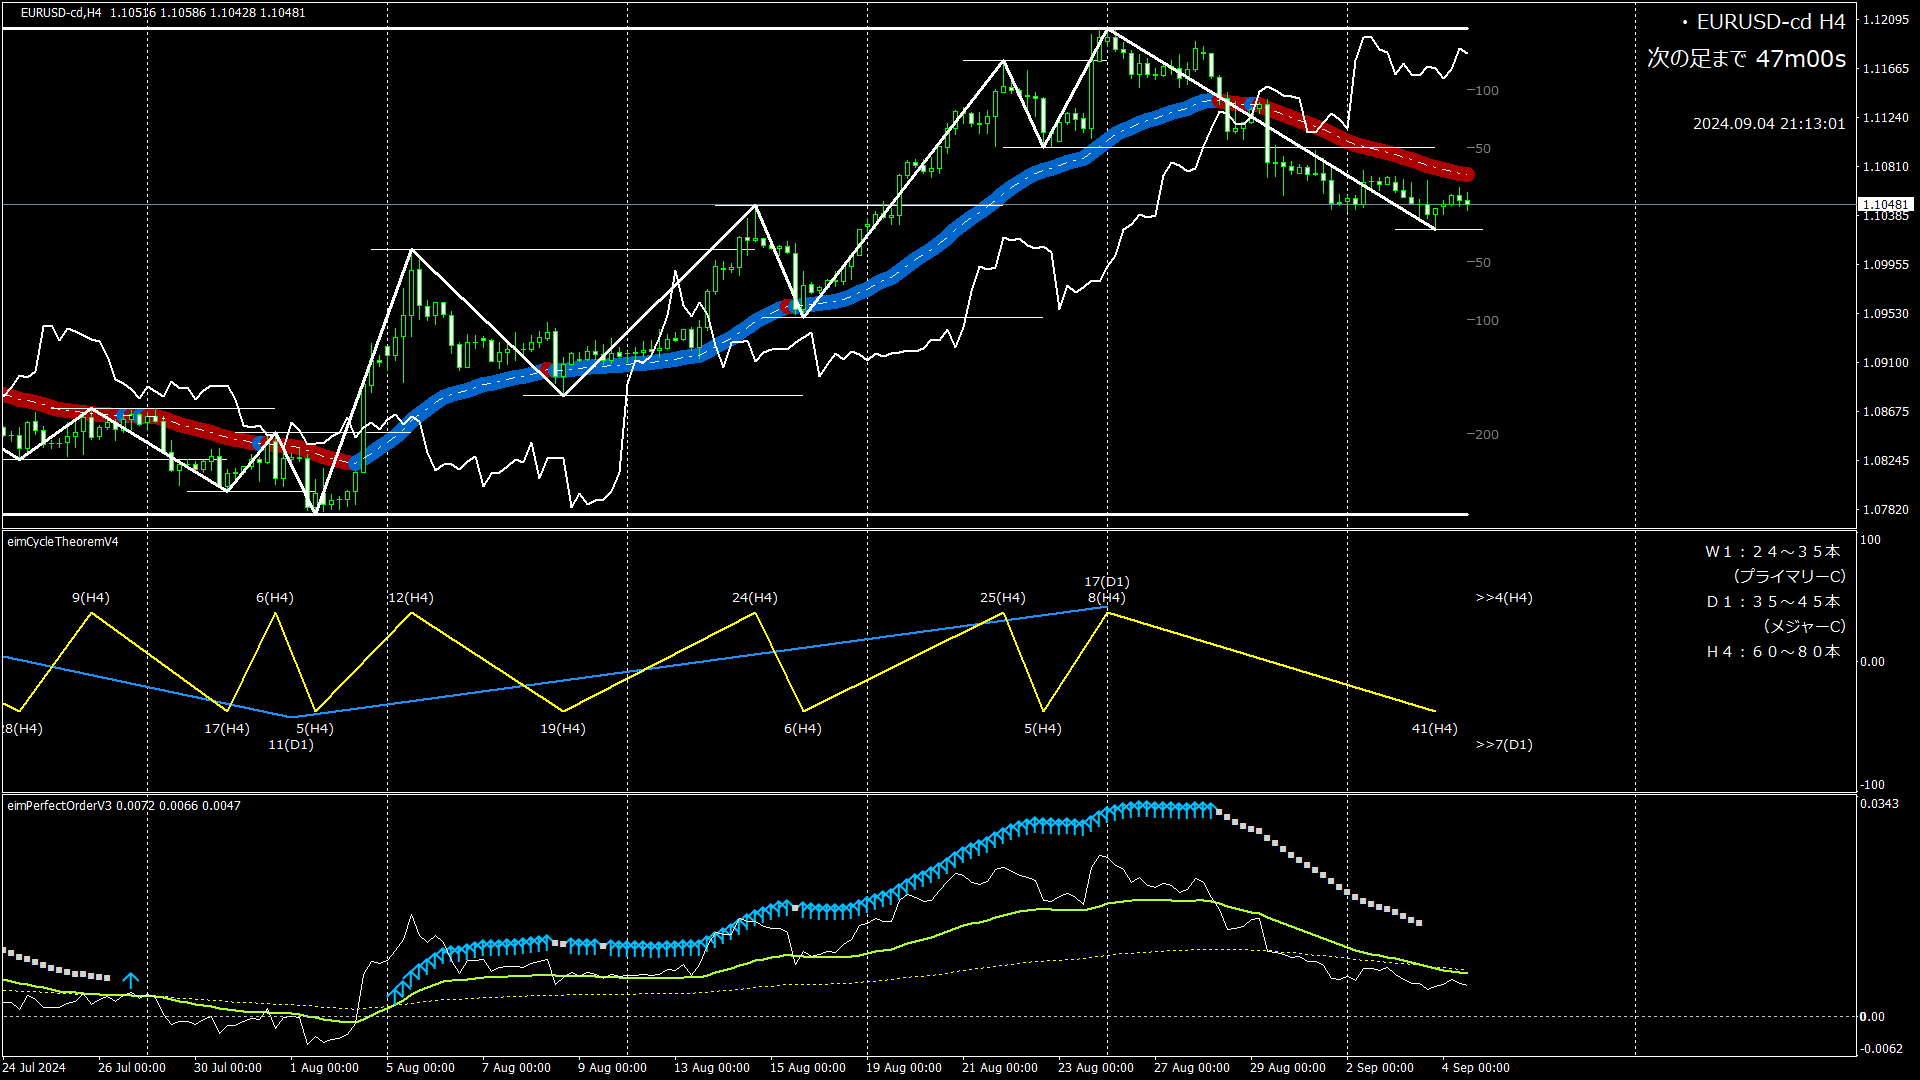
On the 4-hour level, a new cycle has begun after the previous downward cycle ended.
Weekly Cycle
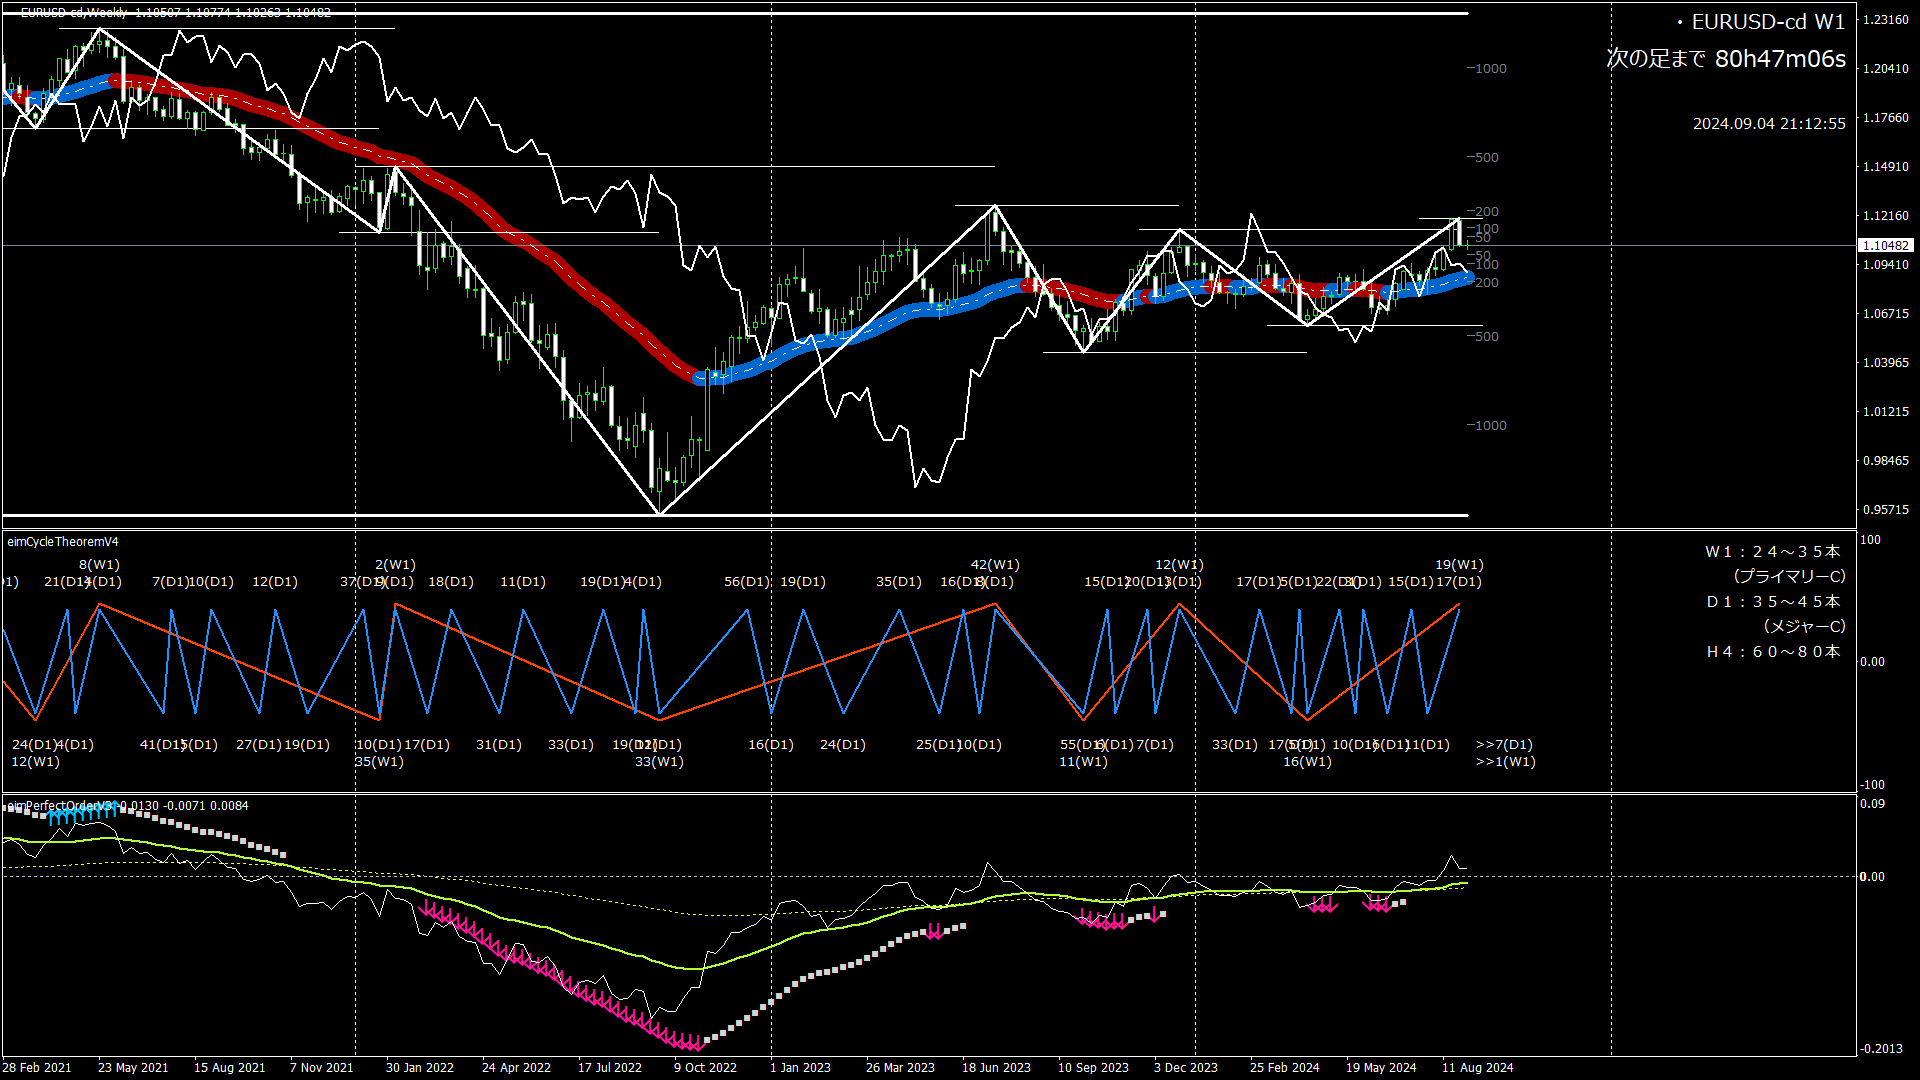
Cycle theory: W1 cycle is currently the 21st, with the high at the 20th. It is now heading toward the low.
(Typically 24–35 bars complete one cycle)
Moving averages: rising, but recently in a trendless state.
Perfect Order: no lights. Because it’s trendless, when a direction emerges, the PO will light in that direction.
Daily Cycle
Cycle theory: D1 cycle is currently the 25th, high around the 18th. It is now heading toward the low.
(Usually 35–45 bars per cycle)
Moving averages: rising. The current upward move continues from the previous cycle, but is now somewhat leveling off.
Perfect Order: bullish signal still on. The current price is falling and is close to breaking below the short-term MA (imminent).
4-Hour Cycle
Cycle theory: H4 cycle is currently the 8th. The cycle has started in anticipation of moving toward the high.
(Usually 24–35 bars per cycle)
Moving averages: previously shifted to a downtrend and have continued downward.
Perfect Order: sign off. The uptrend sign has completely faded.
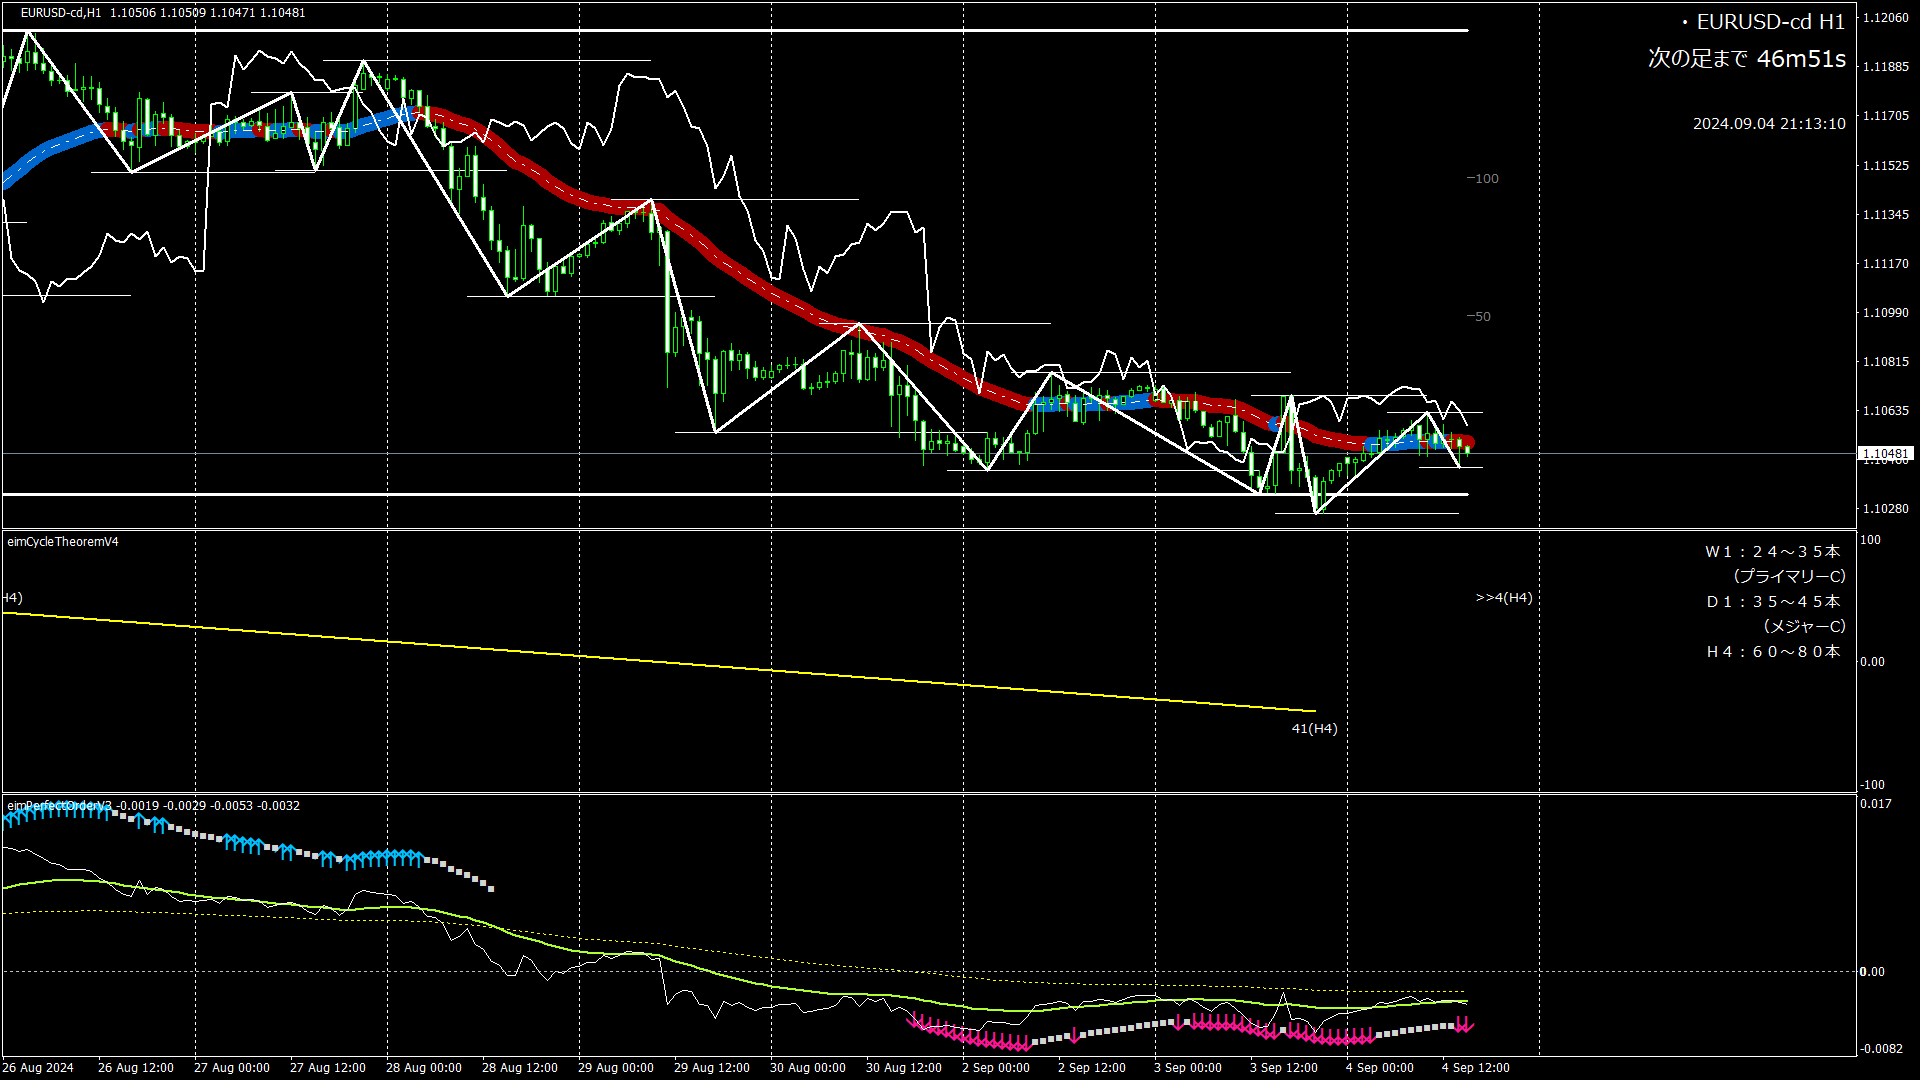
※ Reference: 1-hour chart (no commentary)

Entry Judgment
We’re not entering now. Waiting for a pullback to target.
(以上、サイクル理論による環境認識 )
*1) This is a research article on environmental recognition according to cycle theory.
*2) Trading stance:
Determine the perspective using the daily and 4-hour charts, and adjust entry timing on the 1-hour chart.
*3) The article title and the times in the upper right of each chart are in Japan Standard Time.
That’s all for today. Thank you very much.
(Reference) Image explanations
<Top> Candlestick chart. The thick line is the moving average (= MA). When MA is rising, it’s blue; when falling, it’s red.
<Middle> Cycle theory. Yellow is the 4-hour cycle. Blue is the daily cycle (= Major Cycle). Red is the weekly cycle (= Primary Cycle). The numbers at the peaks (highs) and troughs show the number of candles since the previous peak. Note that the first candle is not counted. On the far right, the “>> number” indicates the number of candles from the last peak to the present.
<Bottom> Perfect Order (= PO).
・Arrows (↑↓) indicate a complete PO, and a square (■) indicates that the closing price has crossed the MA (which is taken as a sign that PO is about to break).
・The line chart shows positions based on the long-term MA.
Yellow dotted line indicates the position of the mid-term MA. The light green solid line shows the short-term MA. The white solid line shows the closing price.