

The Use of "Visualization Indicators" (Part 162)
“Visualization Indicator” utilization (part162)
1. Further develop the “28 Currency Pairs List Indicator” into an indicator
“8CP Visualization Indicatorto drawEURNZD on the chart
The “8CP Visualization Indicator” hasOceania version,London version,NewYork version,AnyCP version. This time, I used theAnyCP version. When using it, I指定EUREUR
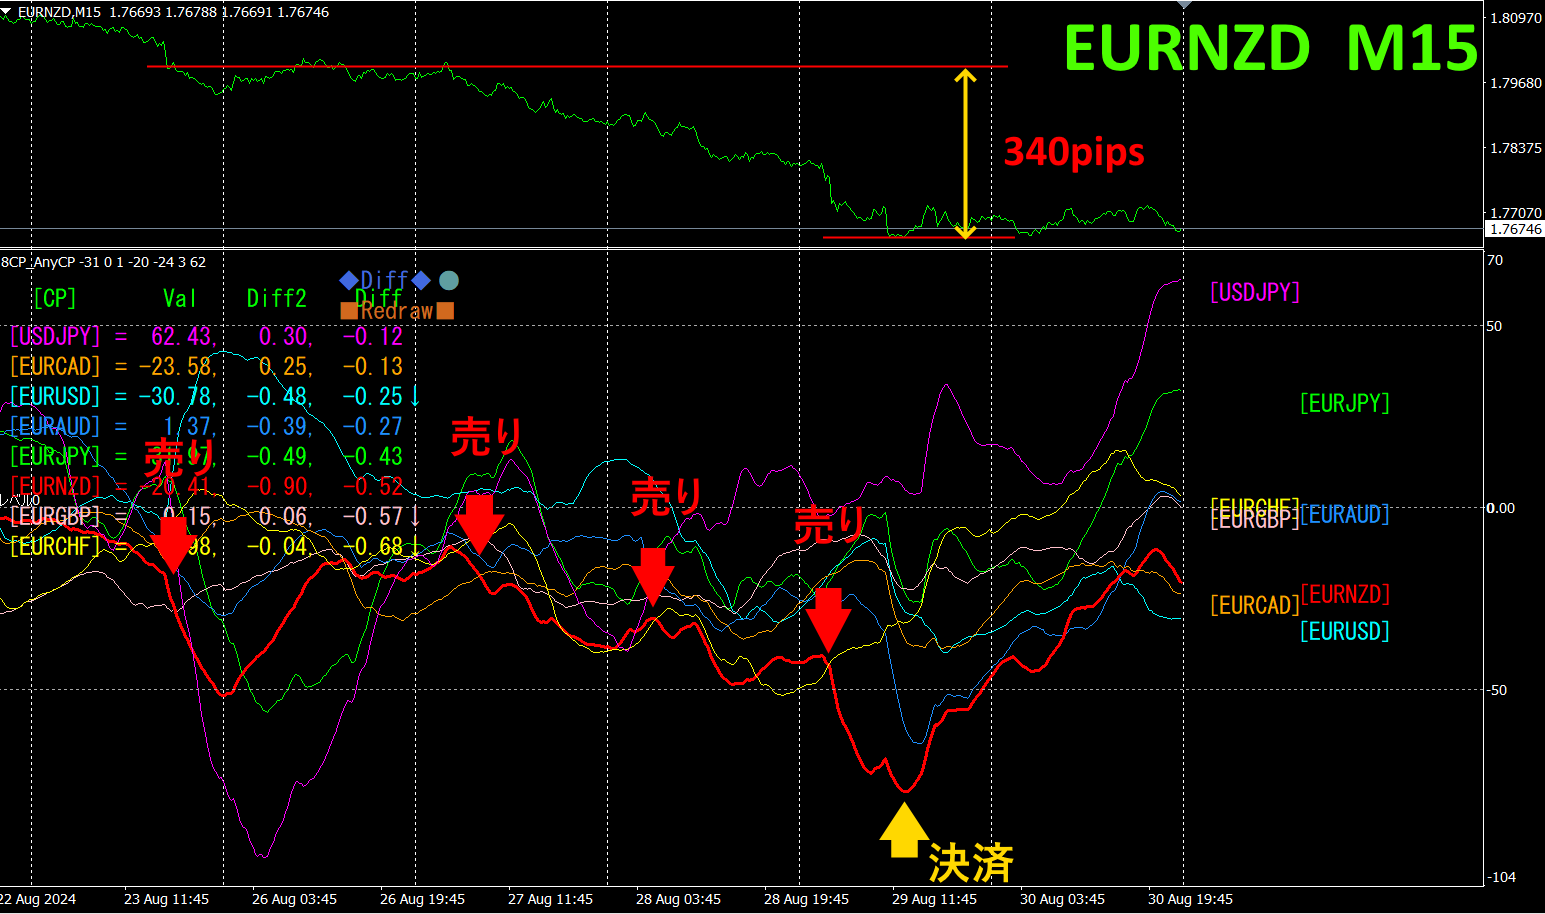
The top half is theEURNZD 15-minute chart. The bottom half is from the “8CP Visualization Indicator,” where the red thick line graph corresponds toEURNZD.
Other EUREUR graphs that have broken below indicate selling entry points. If you had built positions from the first downward arrow, you would have gained about340 pips in profit.
If you use “TrendLine-EX, you can automate entry and exit when breaking trendlines. You can leave it as is for easy trading. “TrendLine-EX is a semi-automatic EA that sells automatically when the trend line is broken downward and auto-closes when broken upward.
2. Best SelectTry the Indicator
The figure below is a screenshot taken on2024 year8 month29 day10:25
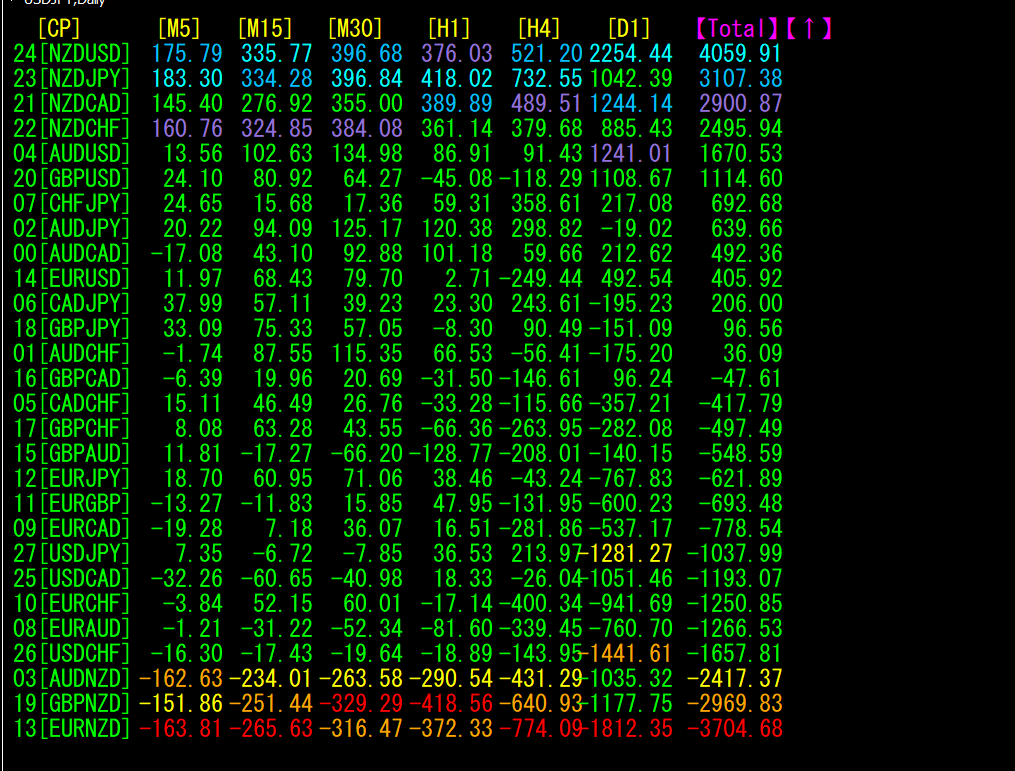
[Total]The numbers are in descending order. At the very top line,NZDUSD is shown in blue on all timeframes. Also,4059.91, a large positive figure. This indicates a strong uptrend in NZDUSD.
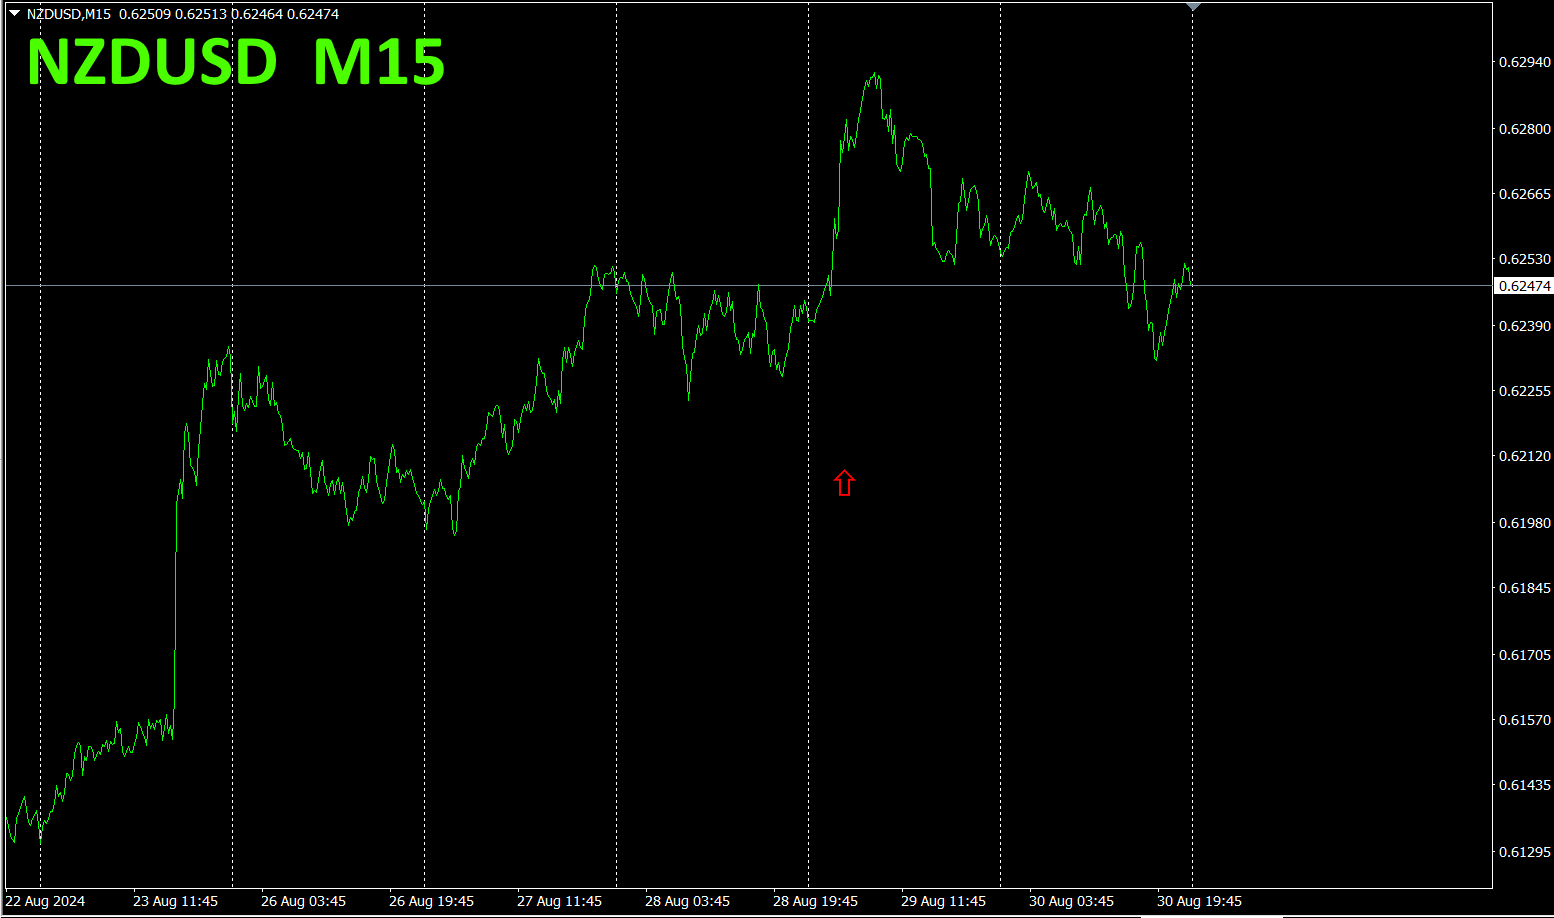
Now, let’s look at the chart ofNZDUSD.
The red arrows show where the screenshot was taken. Looking at the chart, a steady uptrend with a right-shoulder rise is clearly formed.“The Road to Investing”The 140(Summer Vacation Special)But,NZDUSD had already risen by more than130pips since last week. If you had used “TrendLine-EX, you could have earned substantial profits.
“28 currency pairBest Select indicator
“28 currency pairBest Select indicator”
https://www.gogojungle.co.jp/tools/indicators/35128

3. 2021 year5 month onward, what happened to the movement ofEURJPY? movement.
Since year5 month, we have been tracking
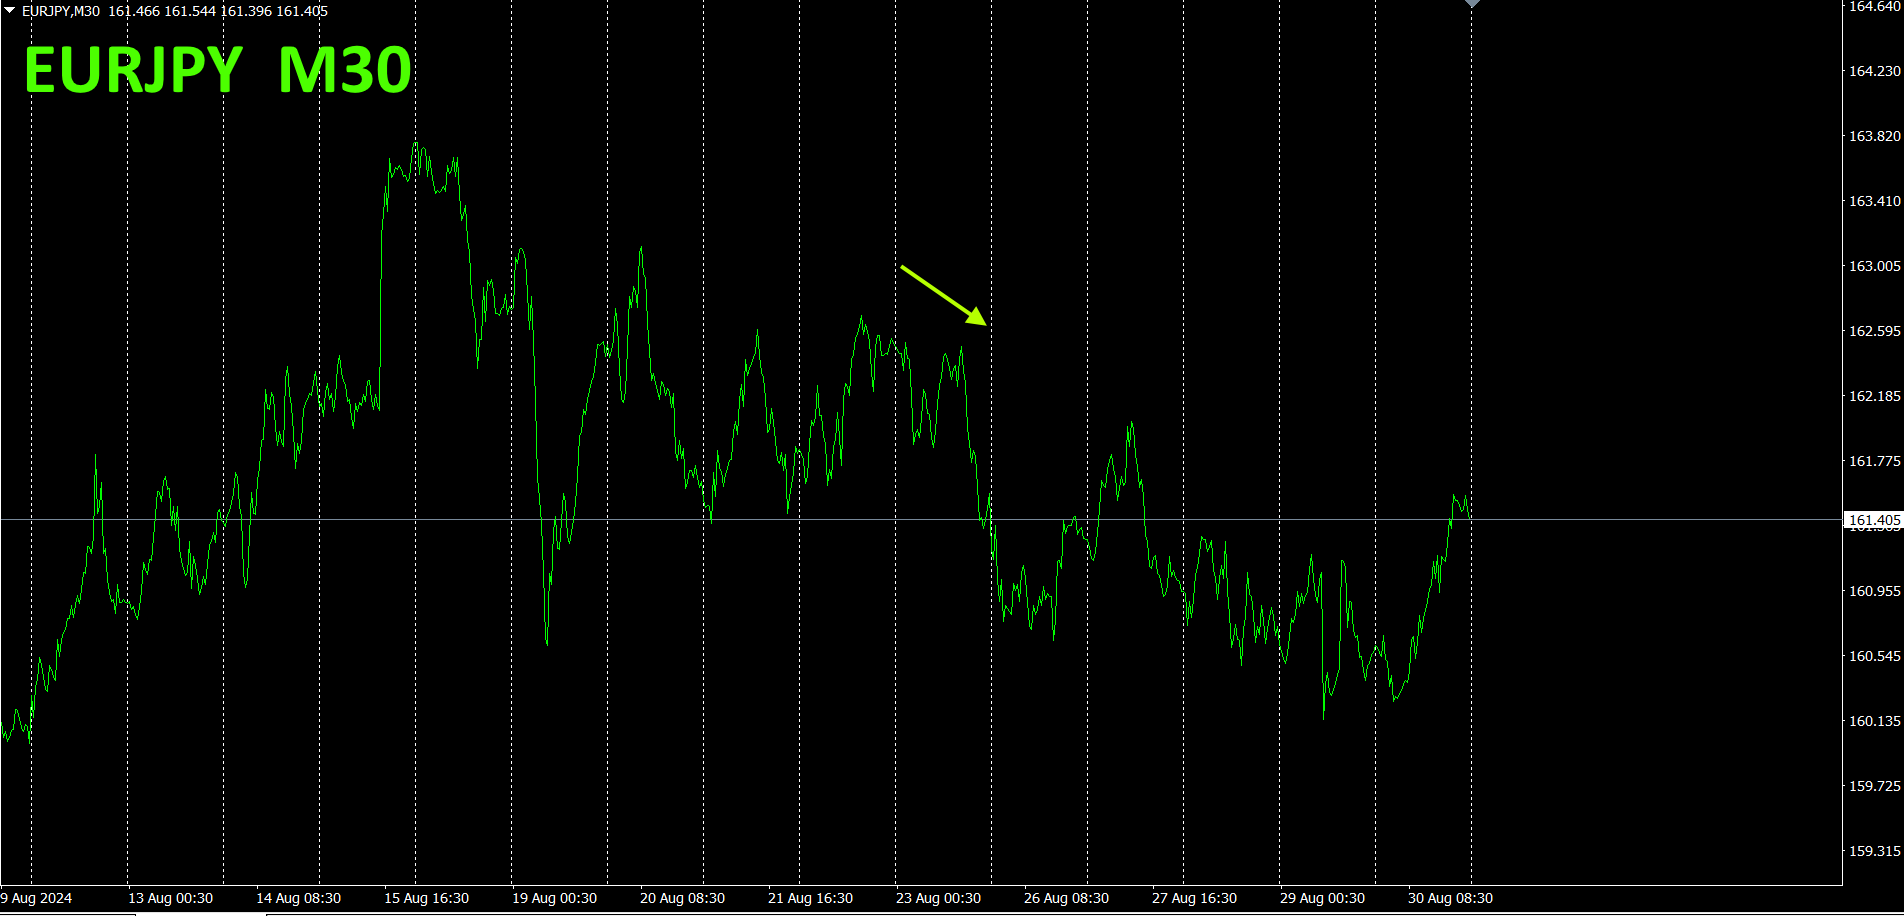
To view the overall trend, I have drawn about the last-minute chart.3 weeks on a
Last time, I wrote as follows:
JPY is rising,EUR is somewhat declining. Therefore,EURJPY is expected to continue with limited upside and a downward tendency.
As expected.
Indeed, following currency strength is likely how the market moves in FX.FX essence.
-minute currency strength chart.
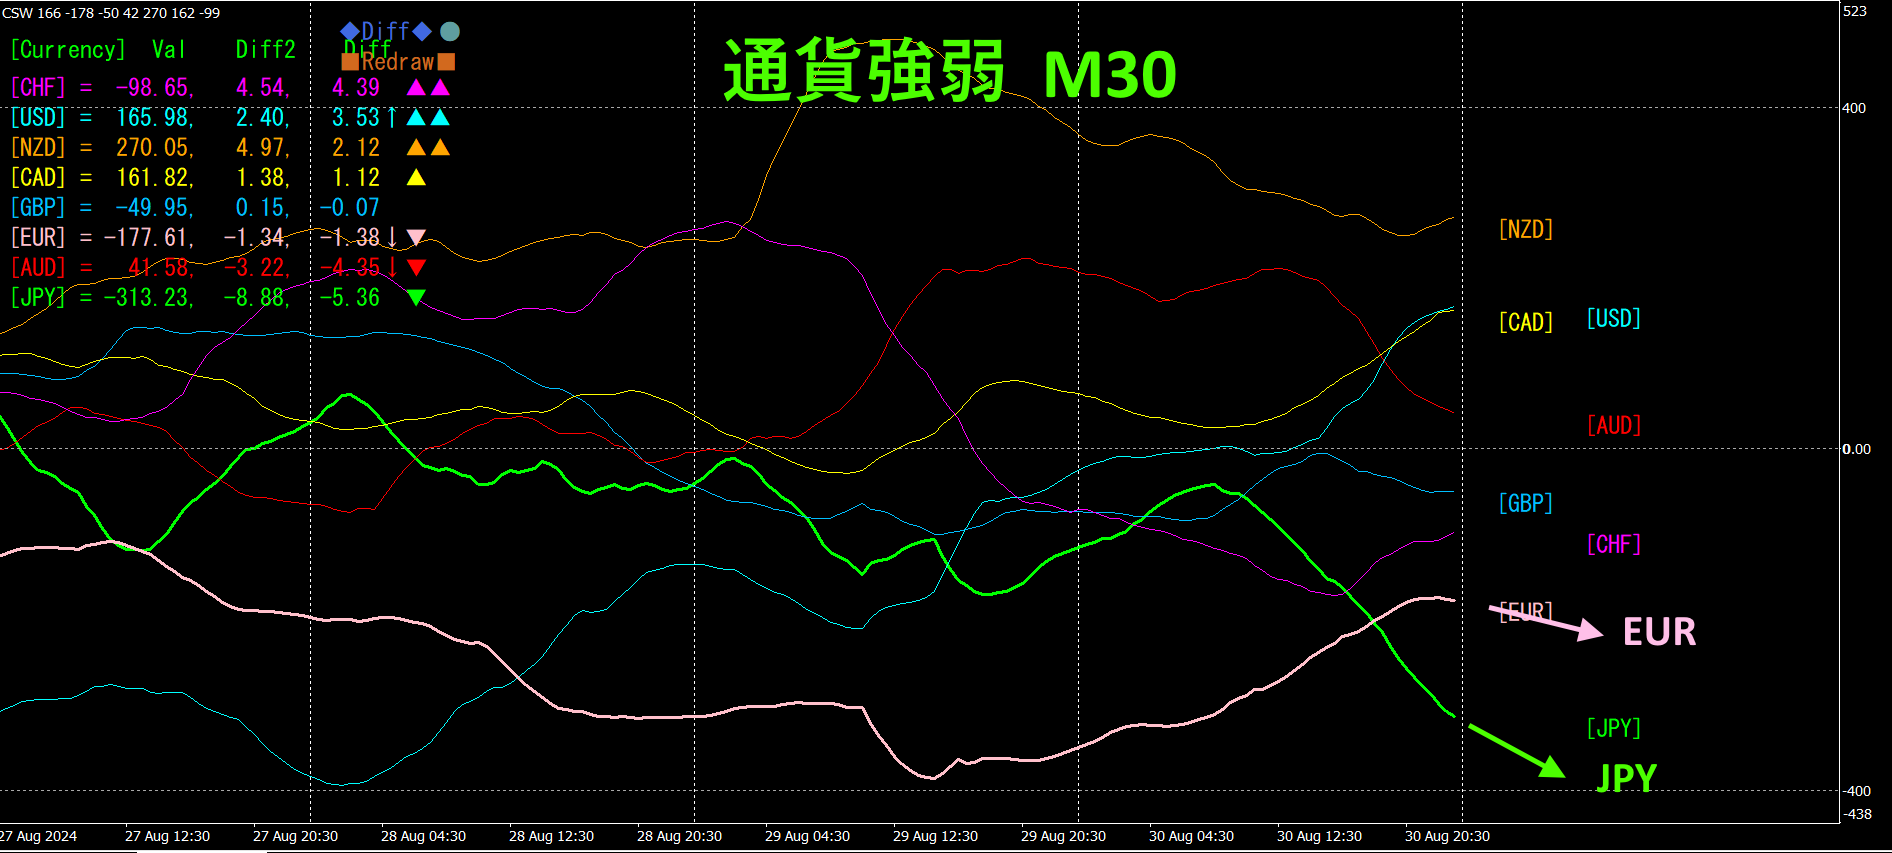
Pink isEUR, green isJPY.JPY andEUR is expected to trend slightly higher.
4. New EA Single FishingMT4/MT5) is on sale.
“ Single Fishing” uses to analyze the market, and is a “billion-dollar EA” that is 90% developed by AI. It operates without martingale or averaging down, aiming to catch profits when volatility is present, like a “single fishing” in a vast ocean of the market.
In the most recent forward test, it again enters drawdown.MT5 version shows
81,563,MT4 version shows loss. The losses are considerable, but within expectations, so I will monitor future movements.

https://www.gogojungle.co.jp/systemtrade/fx/51292
https://www.gogojungle.co.jp/systemtrade/fx/51393

5.
Developer’s Anecdote
I updated the “Toretore Indicator.” Added alert function and arrows. Also added several usage examples. See the product page for details.
6.
Recommended Indicators
“Toretore Indicator”
https://www.gogojungle.co.jp/tools/indicators/50115
“TrendLine-EX”
https://www.gogojungle.co.jp/tools/indicators/42257

“8C Currency Strength Visualization Indicator” is described on the following page.

MT4 version https://www.gogojungle.co.jp/tools/indicators/39150
MT5 version https://www.gogojungle.co.jp/tools/indicators/39159
【My items for sale】


