

The use of "Visualization Indicators" (Part 160)
“Visualization indicators” usage (its160)
1. Further evolve the “28 Currency Pairs List Indicator” into an indicator
“8CPVisualization Indicator”to drawCADJPY.
The “8CPVisualization Indicator” includesOceania version,London version,NewYork version,AnyCP version. This time, I used theNewYork version.
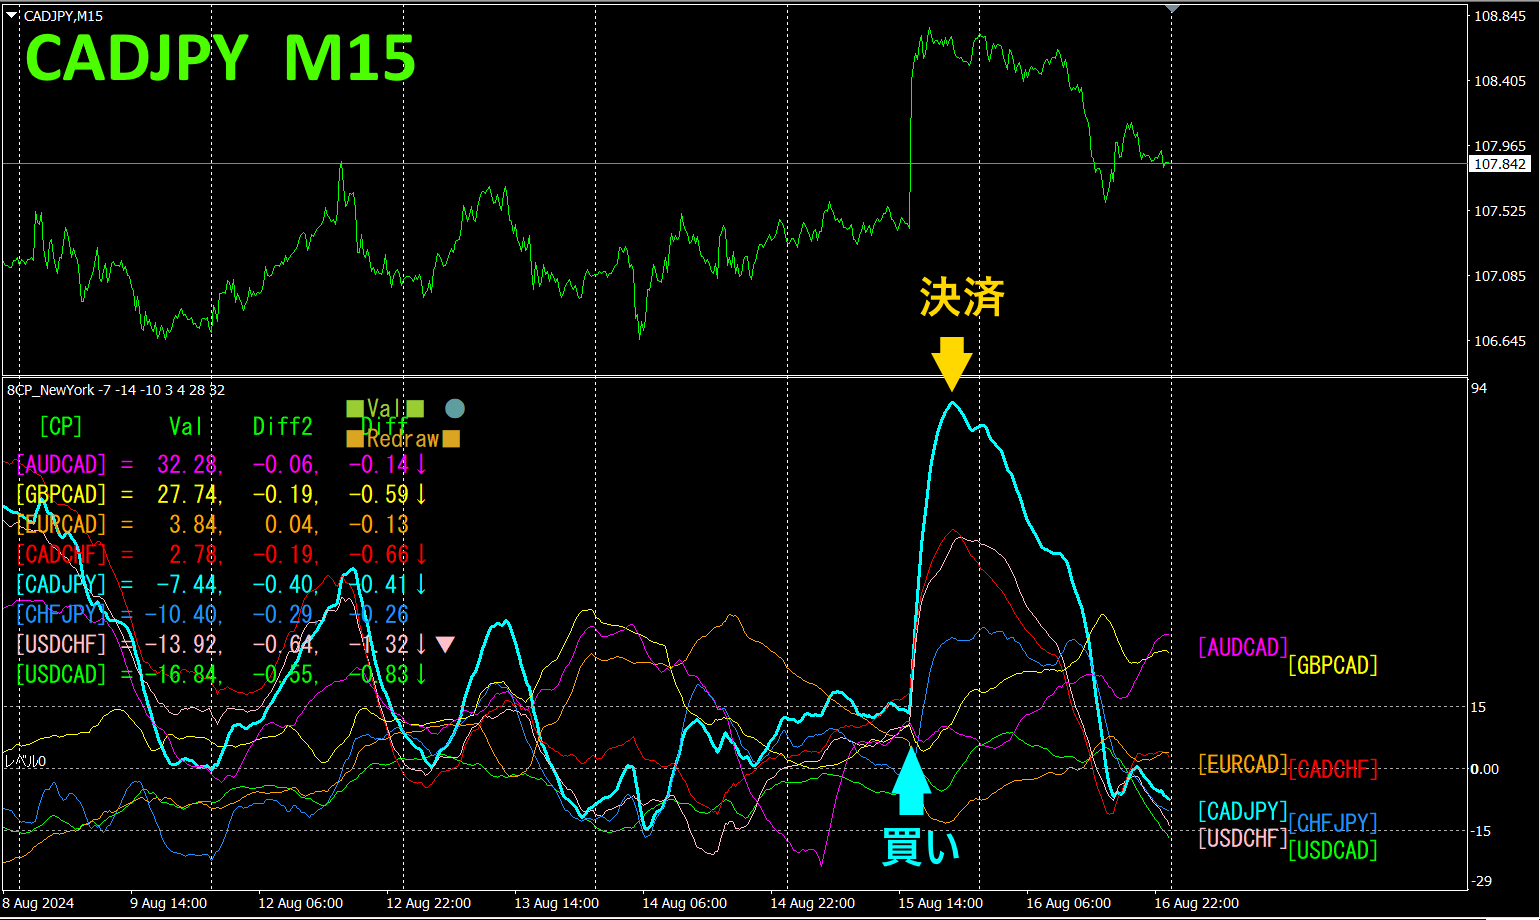
The top half is theCADJPY 15-minute chart. The bottom half is from the “8CPVisualization Indicator”; the light blue thick line graph corresponds toCADJPY.
On Thursday, the CADJPY chart moved up through the other charts, so I entered a buy. I exited near the top. Profit of about120pips was earned.
If you use the “TrendLine-EX,” you can automate entries and exits when a diagonal trend line is breached. You can leave it as is for easy trading. The “TrendLine-EX is a semi-automatic EA that sells when the trend line breaks below and automatically closes when the trend line breaks above.
2. Best Select indicator try
The figure below is a screenshot taken on2024 year8 month14 day21:57
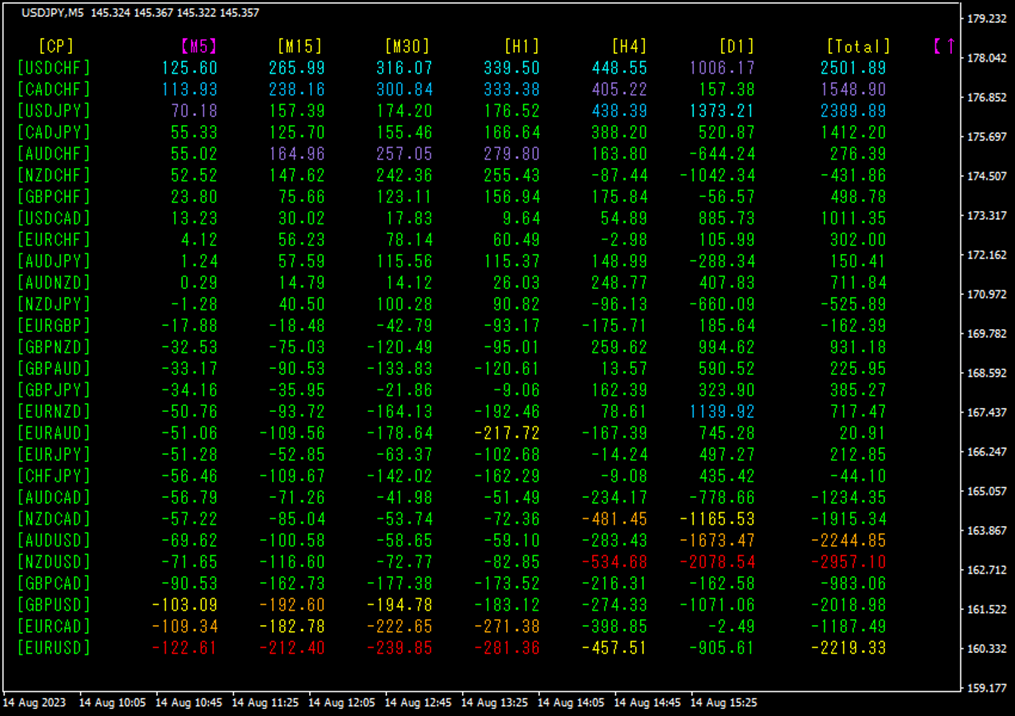
[M5]The numbers are arranged in descending order. The top rowUSDCHF shows blue color across all timeframes. Moreover, theTotal value is2501.89, a notably large positive number.USDCHF indicates an upward trend is present.
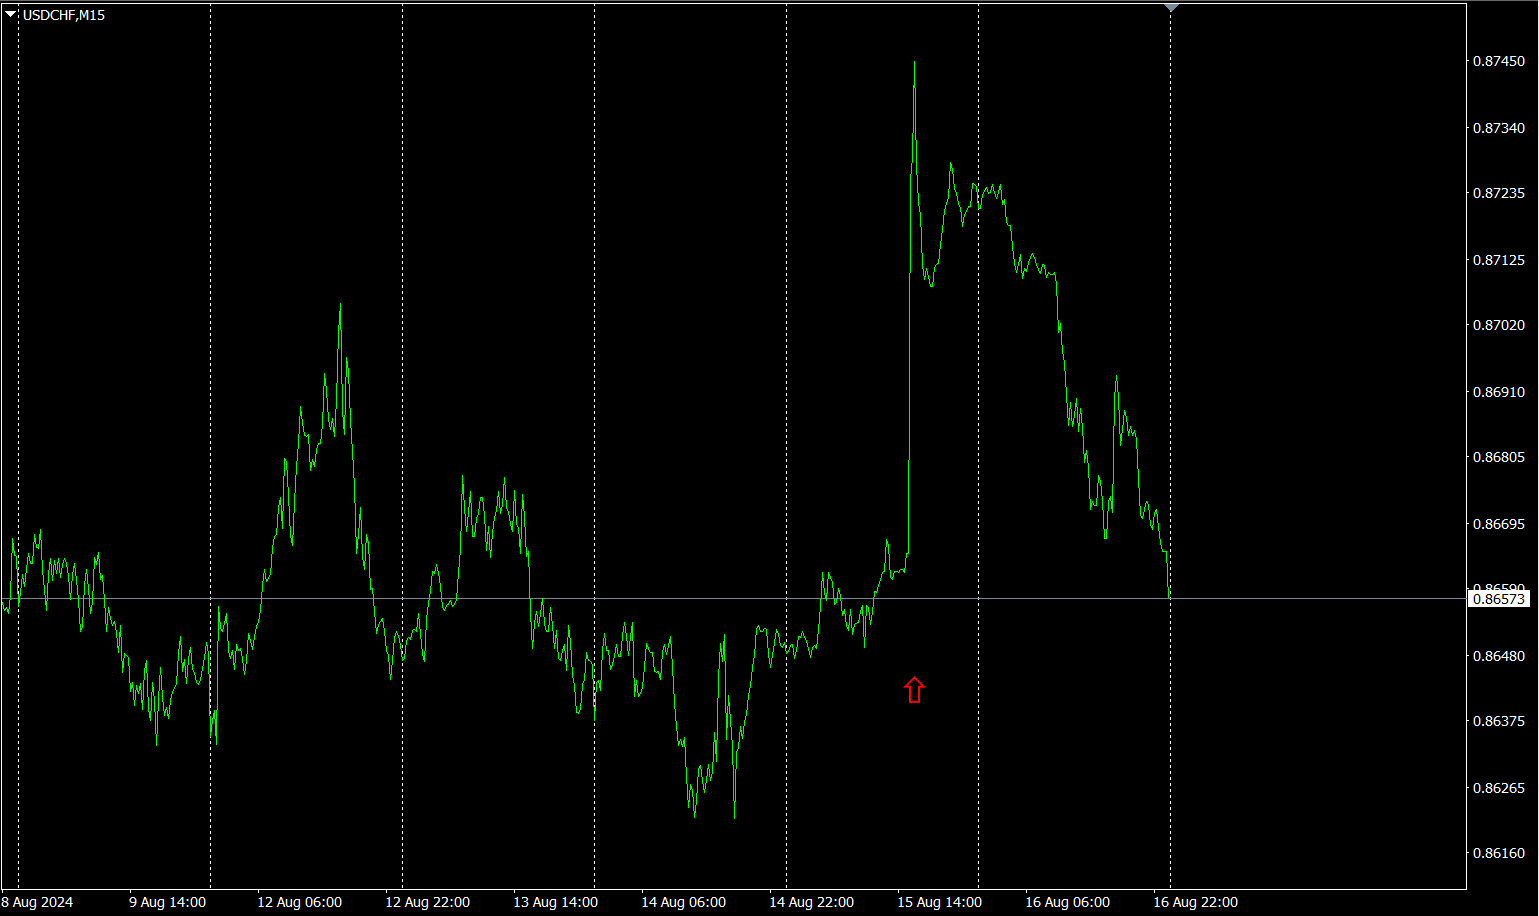
Now, let's look at theUSDCHF chart.
The red arrows mark where the screenshot was taken. It captures a sharp rise. If you had triggered theTrendLine-EX, you could have earned profits.
“28 currency pairsBest Select indicator”
https://www.gogojungle.co.jp/tools/indicators/35128

3. 2021 year5 month has been tracking movement?
2021 year5 month since movement is being tracked.
To view the overall trend, a30 minute chart of the last about3 weeks is drawn.
Last time I wrote the following.
JPY is rising,EUR is slightly falling. Therefore,EURJPY is expected to trend slightly downward going forward.
The forecast was wrong. It rose slightly instead.
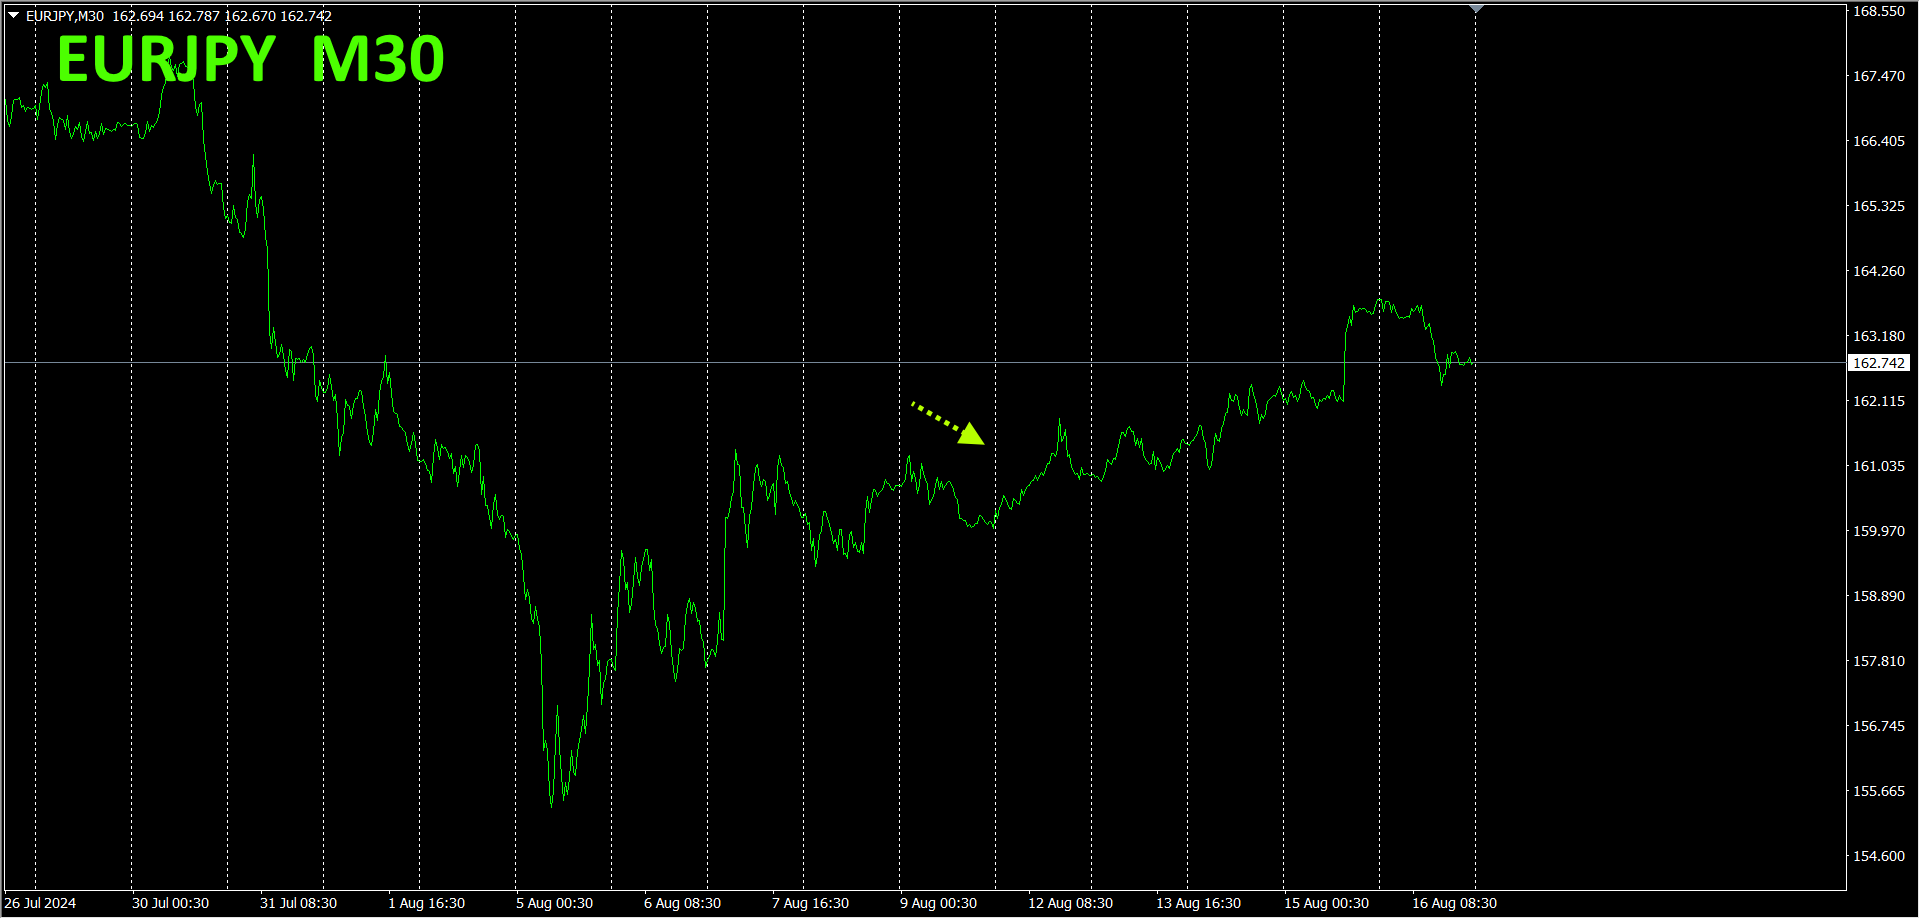
30 minute currency strength chart.
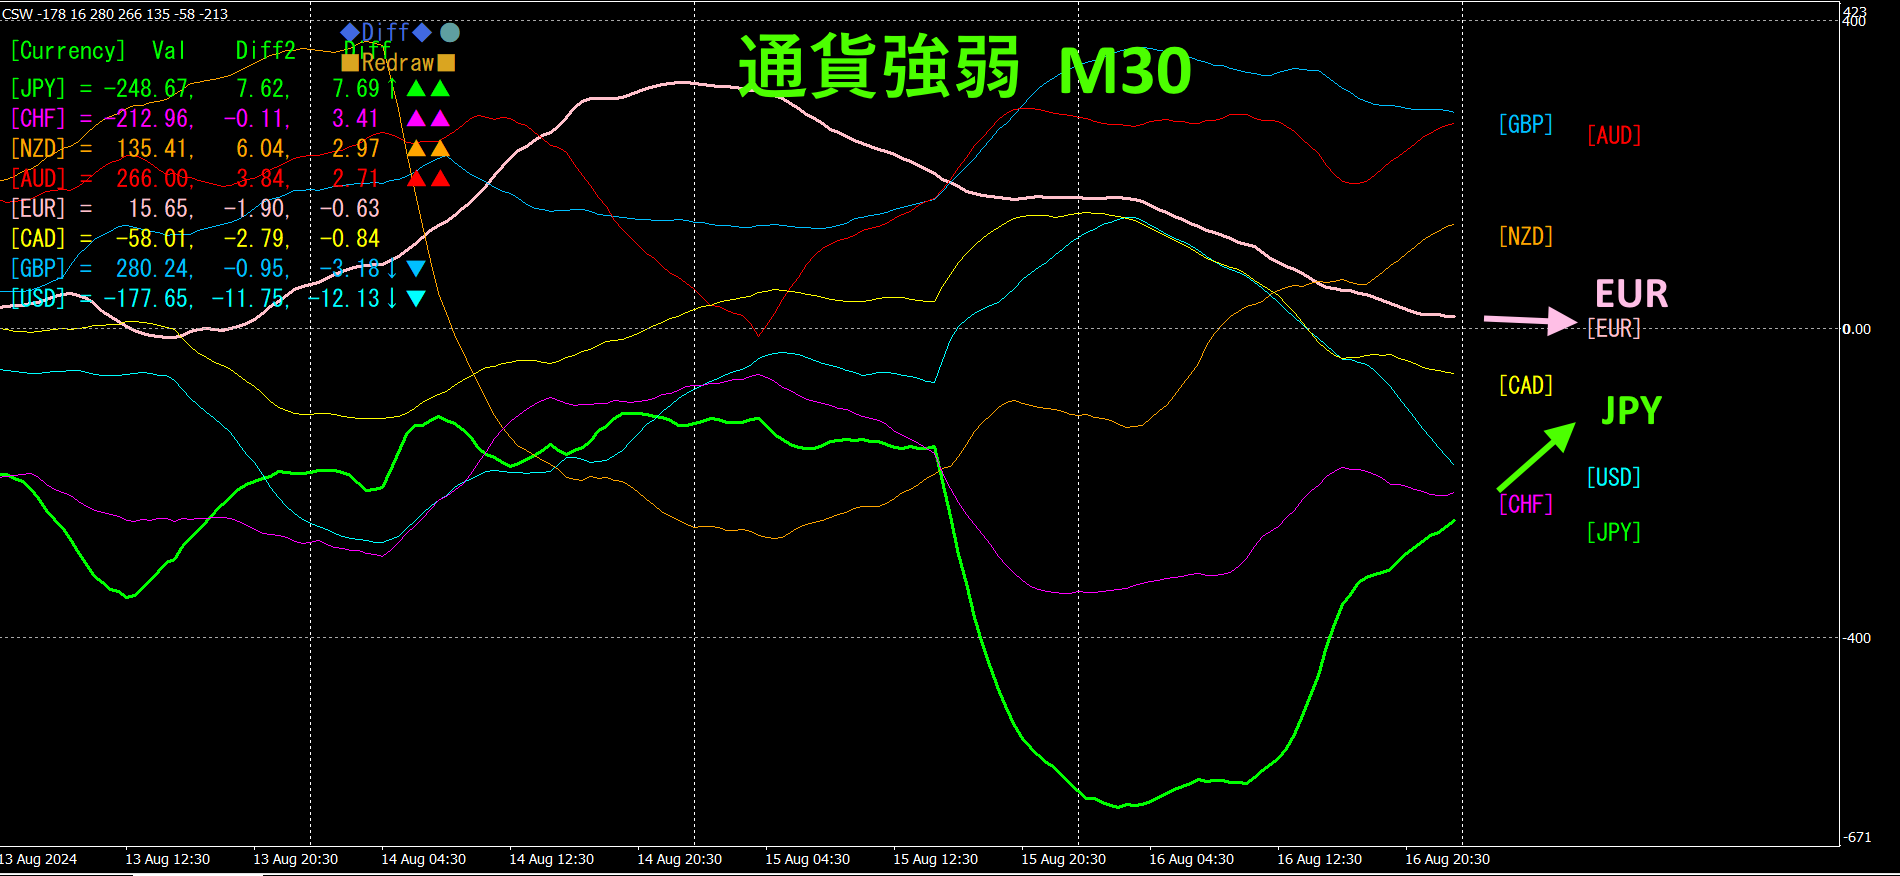
Pink isEUR, green isJPYJPY is rising,EUR is slightly falling. Therefore,EURJPY is expected to trend slightly downward going forward.
4. NewEA“AISingle-PickEURJPYMT4/MT5) is on sale.
“AISingle-PickEURJPY” usesAI to analyze the market,AI has developed 90% of it into a “billion-yen EA”EA. It avoids averaging down and martingale, targets only high-volatility moments, and effectively fishes profits from the vast sea like a single-pick fishing method.
In the most recent forward test, it is still in drawdown. MT5 version shows
10,209, version shows 27,477


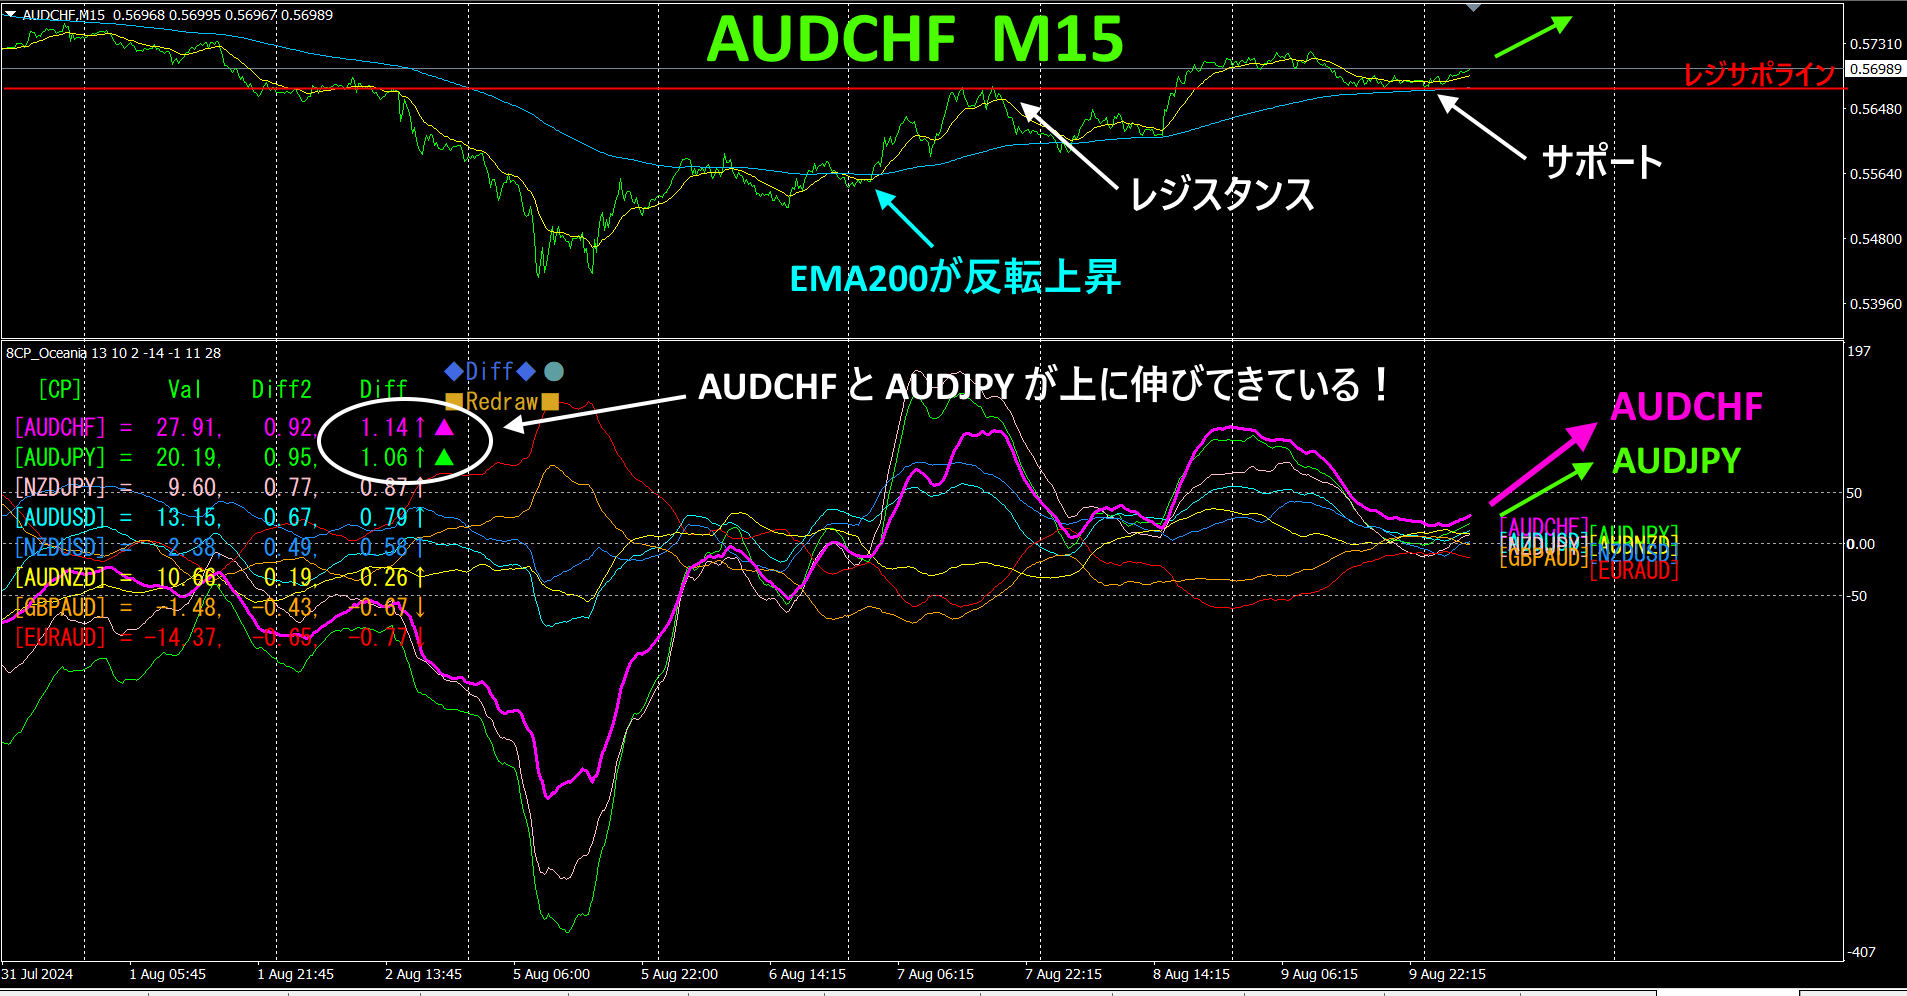
In August 20248 month day chart shows EMA200 turning upward and being supported by a resistance-turned-support line. In the bottom half, the “8CP Visualization Indicator Oceania shows that AUDCHF is rising at the steepest angle. In such market conditions, the issue of “buying leads to a drop” does not occur.
Indeed, I opened a buy position on AUDCHF and it quickly moved into profit, allowing comfortable trading.
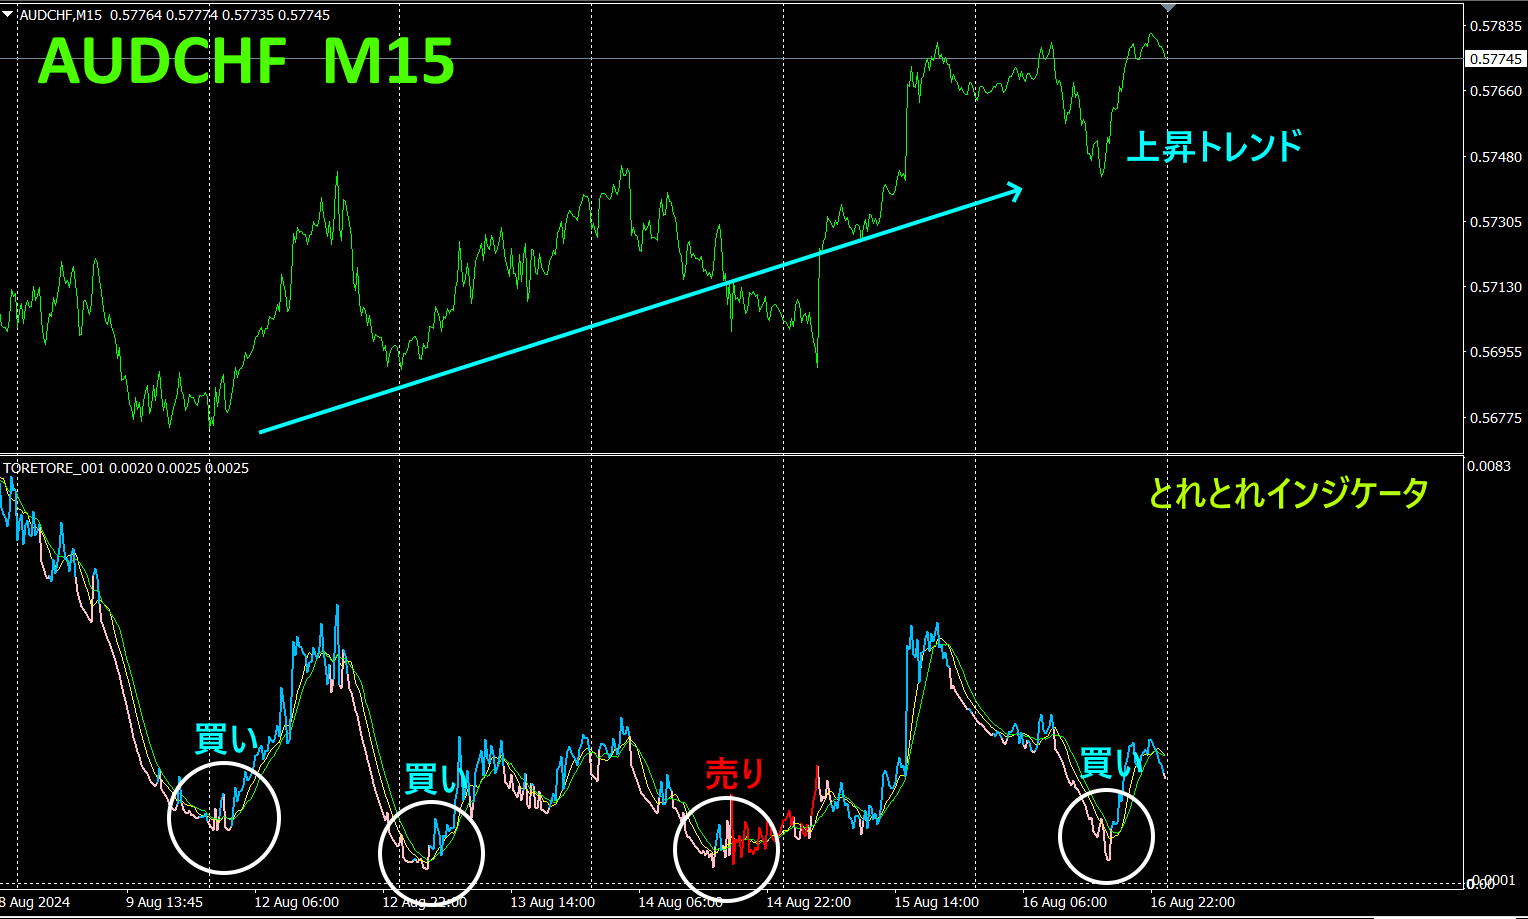
Next,AUDCHF 15-minute chart with the “Tore-Tore Indicator” introduced. How to use the “Tore-Tore Indicator” is to wait for the indicator graph to come close to the zero line, reverse, and then, according to the indicator color, place a sell position if red, buy if blue.
The chart includes white circles for illustration. The position of the white circle is an excellent point for a dip-buy. Since the trend is upward, you do not need to sell at the third sell signal. The “Tore-Tore Indicator” faithfully reflects the chart state, so you can wait for the dip in an uptrend to enter properly.
6.
Recommended Indictors
“Tore-Tore Indicator”
https://www.gogojungle.co.jp/tools/indicators/50115
“TrendLine-EX”
https://www.gogojungle.co.jp/tools/indicators/42257

“8C currency strength visualization indicator” please refer to the following pages.

MT4 version https://www.gogojungle.co.jp/tools/indicators/39150
MT5 version https://www.gogojungle.co.jp/tools/indicators/39159
【My listed items】


