

Bitcoin (BTC) remains in a range-bound market; how will the price move next? — Chart analysis on October 23
Since the plunge on October 19, Bitcoin (BTC) has continued to move without a clear sense of direction, and the range-bound trading continues today, October 23. As October comes to an end, what kind of price movement might Bitcoin show from today onward? We will check the charts.
Bitcoin (BTC) remains unclear on both upside and downside; using the long-term moving average as one metric
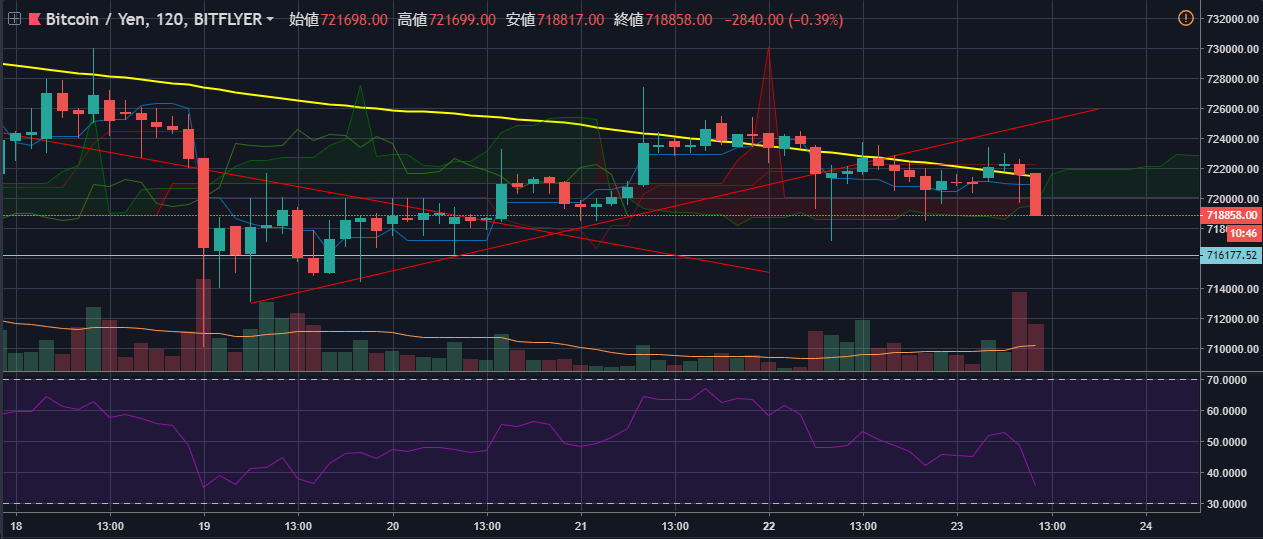
Additionally, since October 22, the chart shows several instances of downward price movement. Yet these declines have been followed by rebounds, forming long lower wicks. Thus, BTC currently continues to exhibit a lack of a clear directional trend.
Although BTC lacks a clear direction, since October 21 the 2-hour chart has been moving with the 200-day moving average as a reference. Each touch or slight exceedance of the 200-day moving average has been followed by a decline. Therefore, going forward, it will be prudent to consider trading with awareness of the moving average when evaluating BTC’s upside potential.
× ![]()