

EA development procedure ~ Build logic using the edge of indicators ~⑤
So far, we have confirmed the superiority of the logic by breakout of the Bollinger Bands.
We did everything on the 5-minute chart, but let's also check how it behaves on other timeframes.
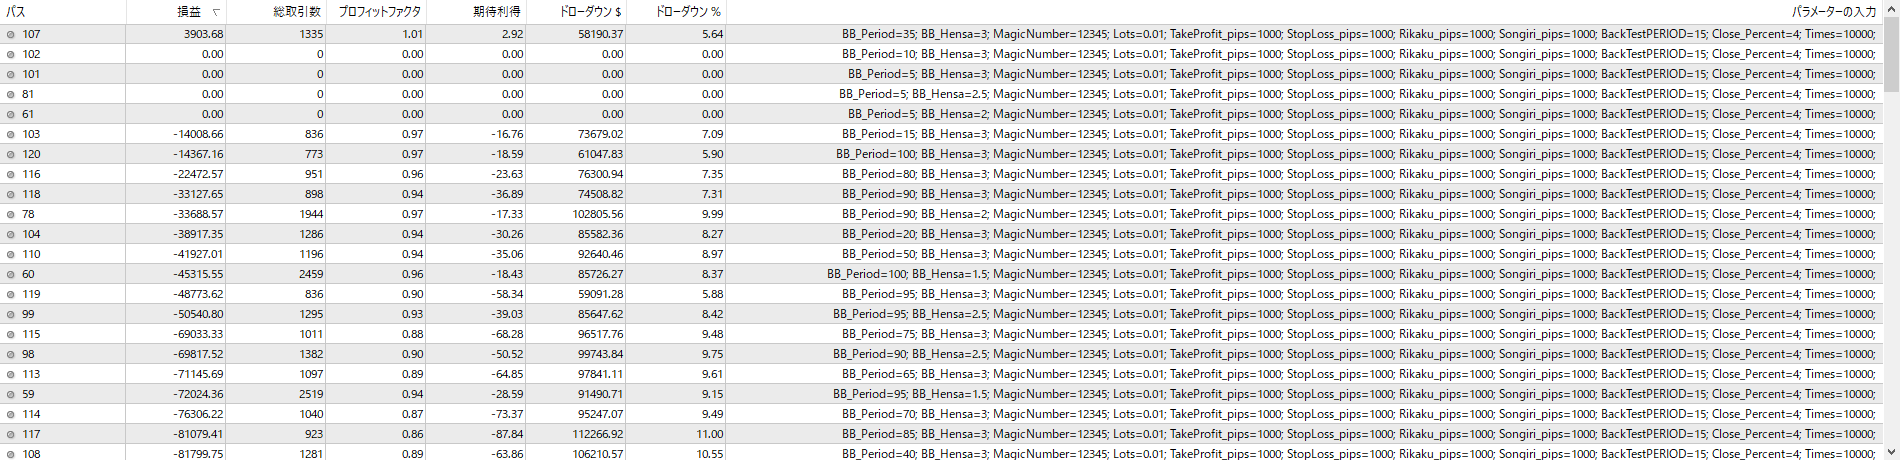
First, here are the results of testing under the same conditions on the 15-minute chart.
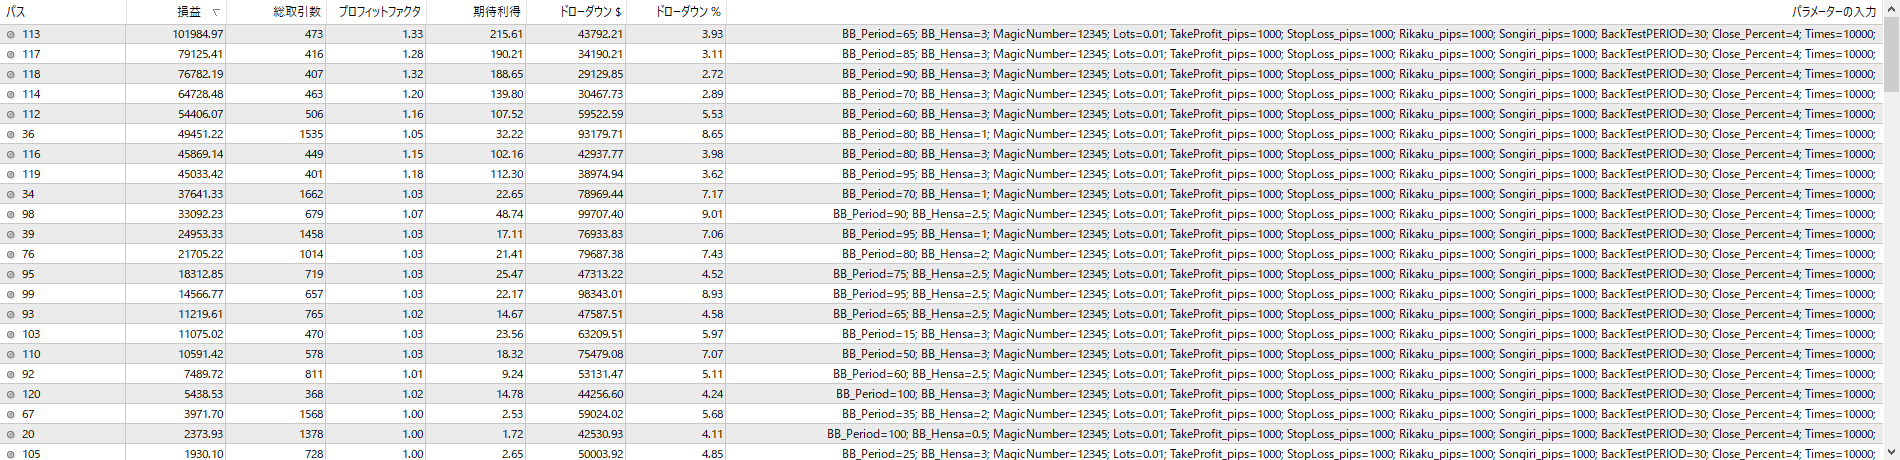
Next are the results of testing on the 30-minute chart.
Finally, here are the results of testing on the 1-hour chart.
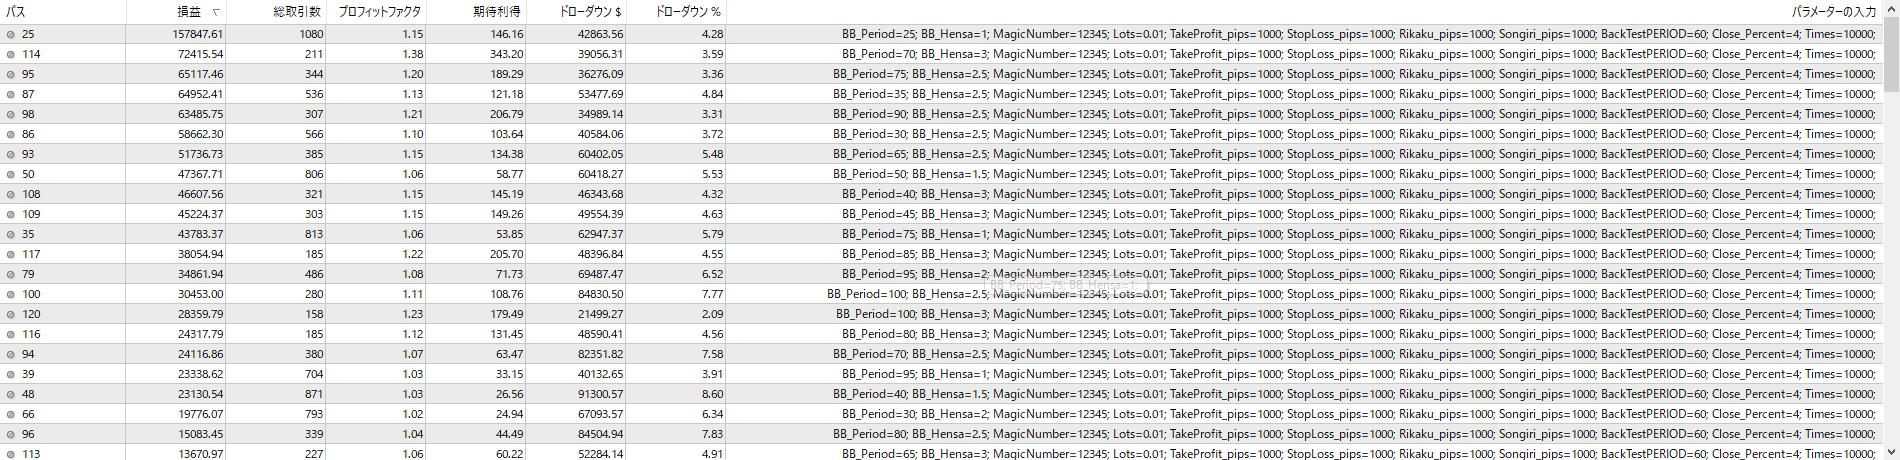
As the timeframe increases, the number of trades decreases, butthe number of parameters that can be profitable with the logic increasesappearing.
When comparing the three,the 30-minute chart seems to function relatively effectively in terms of losses and trade countbased on the impression.
If you observe the timing of trades in visual mode and add settlements and additional conditions, it starts to take shape to some extent.
We will consider developing on the 30-minute chart as well, along with the 5-minute chart parameters.