

EA development procedure ~ Build logic with the advantage of indicators ~ Part ③
We will narrow down to the numbers around the red-edged area and the numbers encircled in green, and confirm again with random settlements.
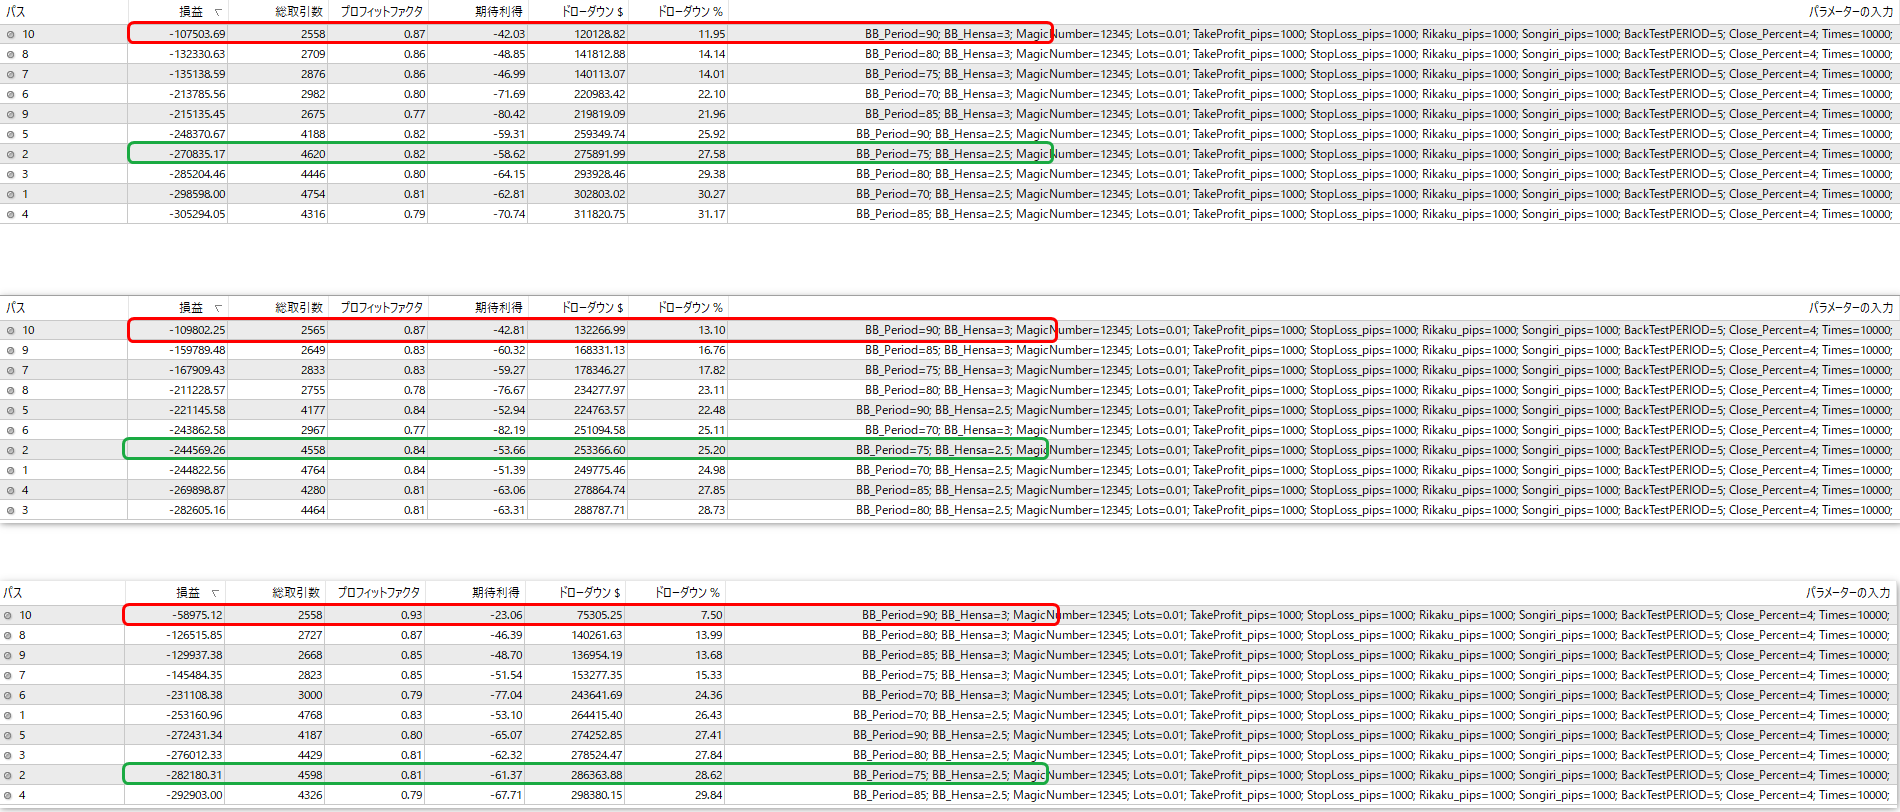
The relatively smaller losses and stable trend come from the 3-sigma break over 90 periods.
On the other hand, performing about 1,000 trades per year and not dropping PF below 0.8 comes from the 2.5-sigma break over 75 periods.
Now let's test with these two parameters.
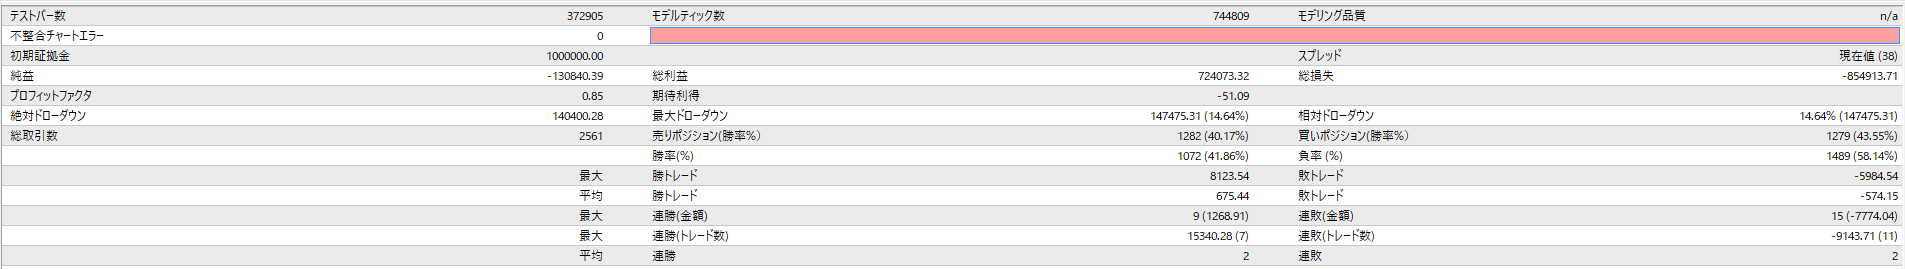
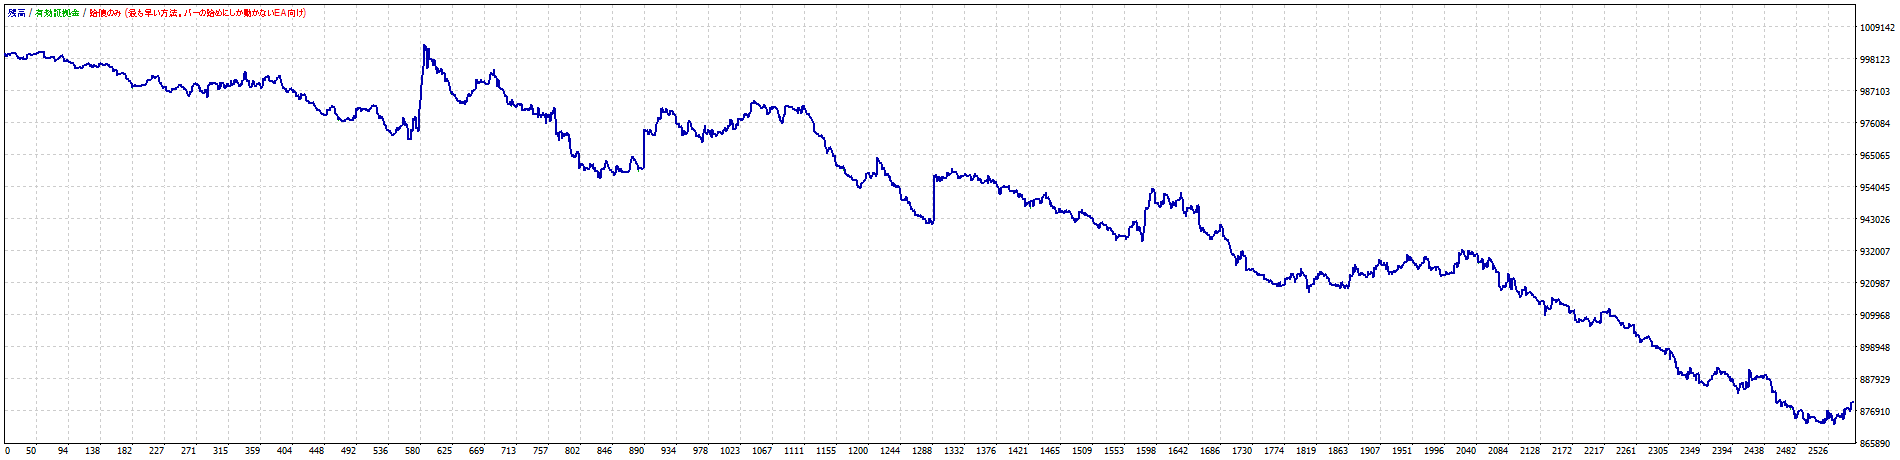
First, the 3-sigma break over 90 periods.
We will perform it a total of 3 times.
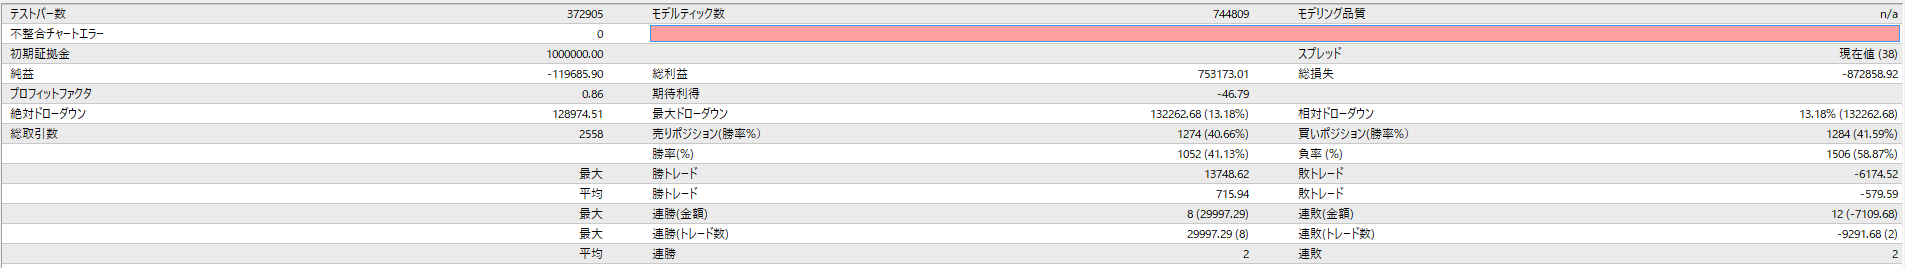
This is the second time.
Lastly, the third time.
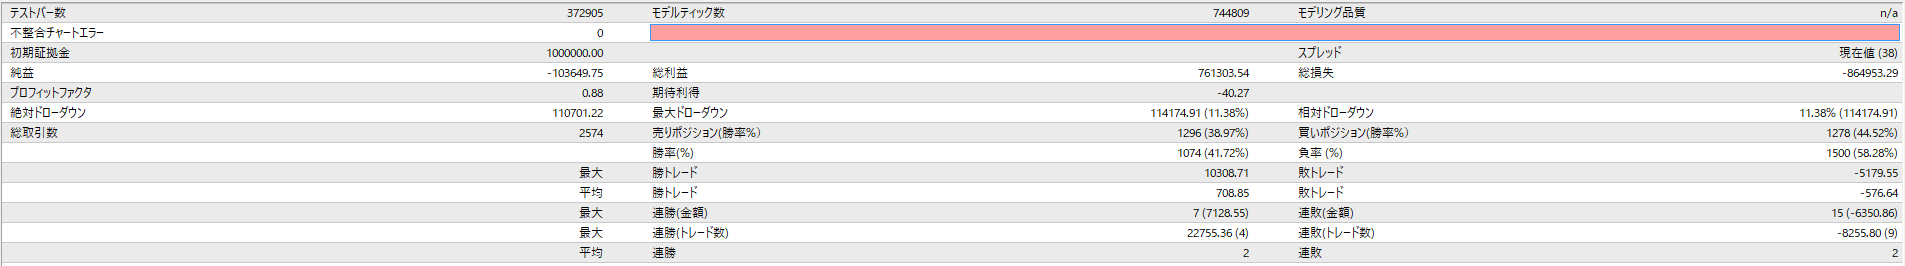
In each case, the settlement timing is not very different even if random, and there are parts where the results change significantly, but overall profit and loss do not change greatly, so
a certain degree of reproducibility is ensuredit seems.
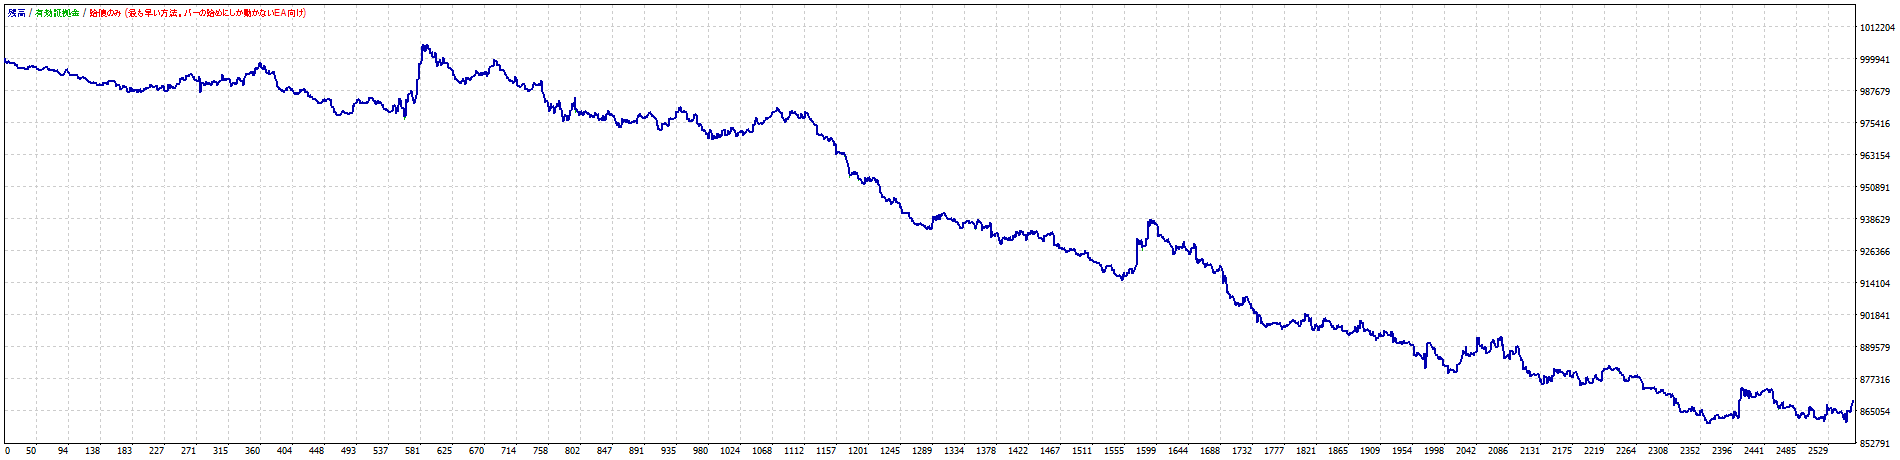
Below are the three graphs overlaid.
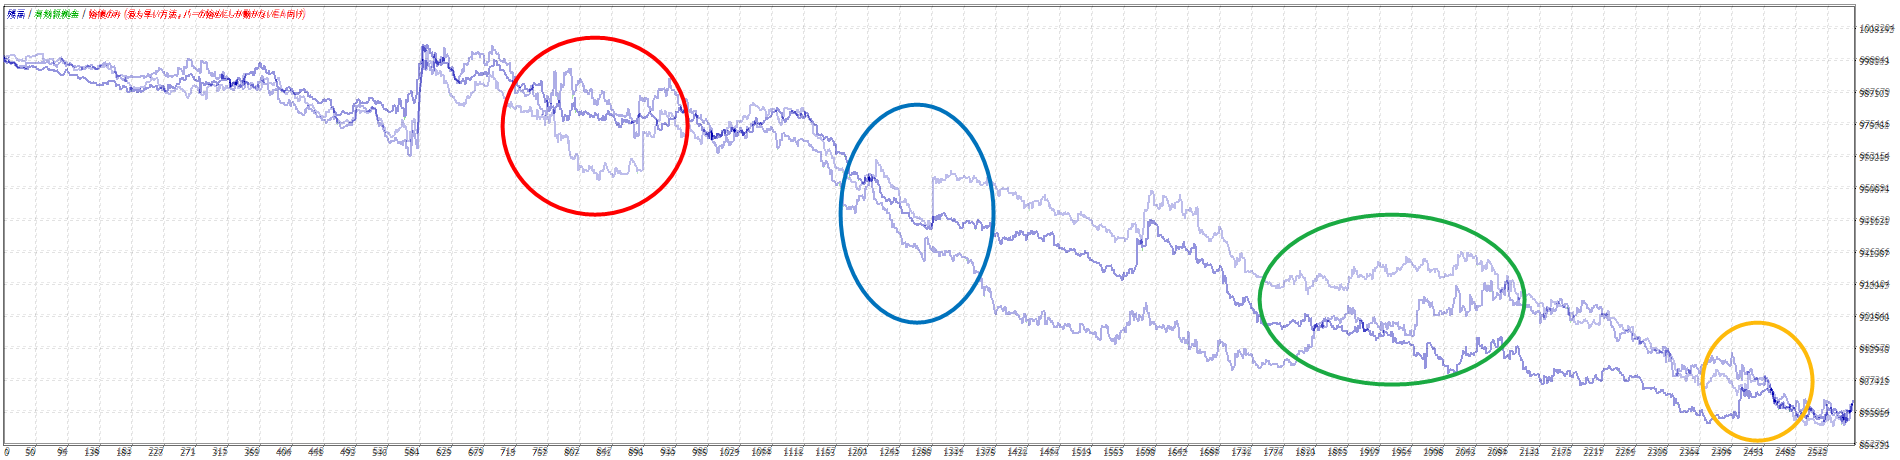
The parts in red circles include points where the result was positive depending on the settlement timing and also points where it became significantly negative.
These are areas where the settlement logic can be improved.
The parts in blue circles show where profits and losses differ greatly depending on whether held or settled.
This is an area where TP and trailing can bring great improvements.
The parts in green circles show movement that is flat, positive, or negative; the behavior is completely different.
This is also something that can be improved with the settlement logic.
The orange-circle parts are areas where movement is flat, positive, or negative in a different way.
This can also be improved with the settlement logic.
Next time, we will test the 2.5-sigma break over 75 periods.