

Nikkei Stock Average posts the largest drop in history, surpassing Black Monday! (August 5)
Today (8/5)
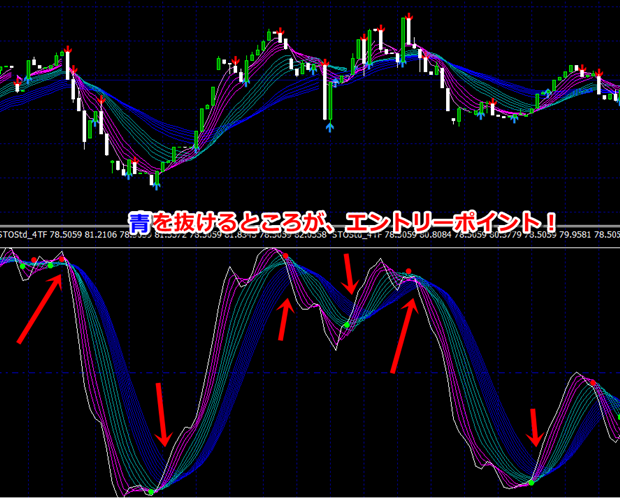
[Winning Pattern] to capture and enter only!
(Nikkei 225 5-minute chart)

★ Point where pink breaks above blue (Click image to enlarge)
(Nikkei 225 5-minute chart)
★ Point where pink breaks above blue (Click image to enlarge)
Tendencies Chart •Mebius Series Latest indicator
Tendencies Chart •Mebius Series Latest indicator
'3 Layers •3 color waveform indicator'
Even clearer entry opportunities than before
【3 Layers •3 color waveform Winning Pattern】
What is it?!

The main feature of this indicator is,
“3 layers •3 color waveform indicator.”

The indicator bands arepink・green・blue,3 layered structure, and the bands of the three layers repeatedly converge and diverge, so, when rising, from the toppink・green・blue align in order, andblue・green・pink alignment.

Therefore, for both uptrends and downtrends, the entry target is
“when pinkbreaks aboveblue.”
That is the target.
Details and purchase for the indicator are here!
1-minute interval indicator 3-layer, 3-color waveform indicator


Details and purchase for the indicator are here!
1-minute interval indicator 3-layer, 3-color waveform indicator


