Nikkei Stock Average falls over 2,200 yen since Black Monday! (August 2)
Today (8/2)
【Winning Shape】 only capture and enter!
Nikkei 225 1-minute chart)
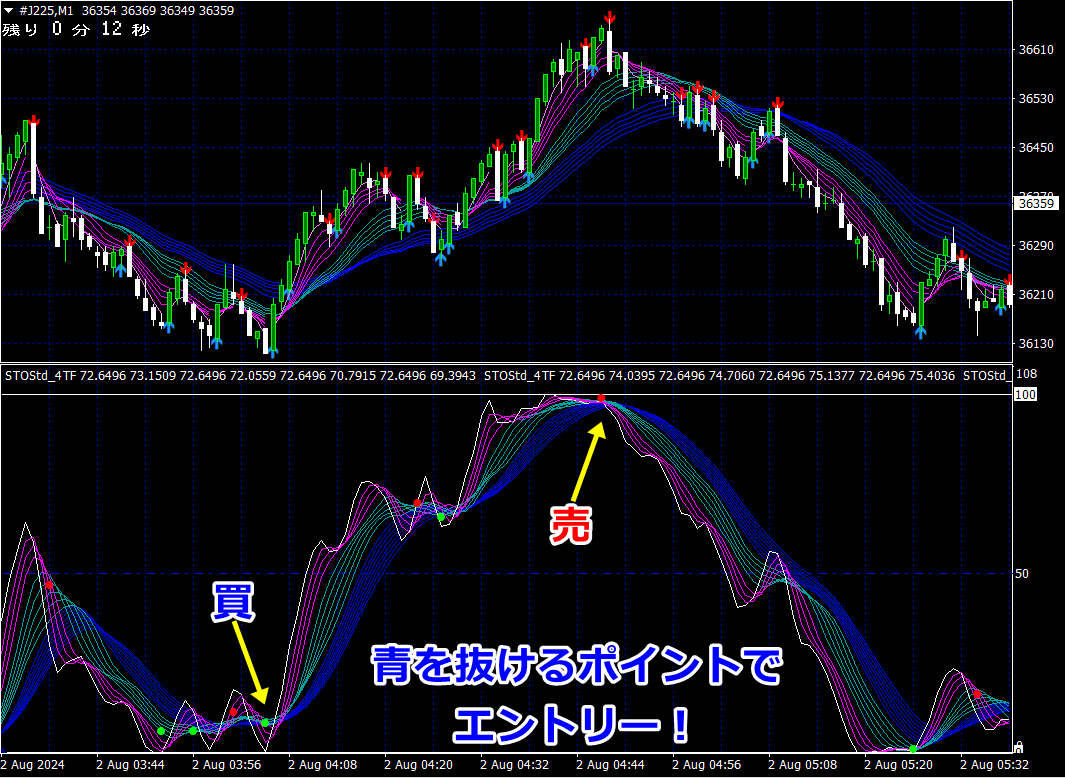
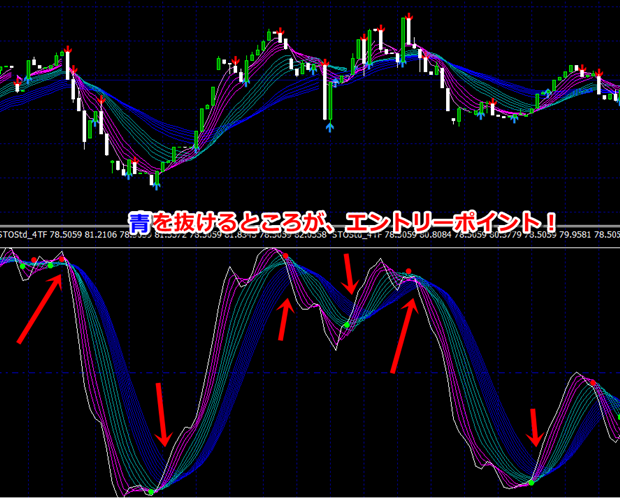
★ Point where pink breaks above blue (Click image to enlarge)
Nikkei 225 1-minute chart)
★ Point where pink breaks above blue (Click image to enlarge)
Tenkai (Bottom) chart・Mebius series Latest indicator
Tenkai (Bottom) chart・Mebius series Latest indicator
『3layers・layers・33color waveform indicator』color waveform indicator
Even clearer entry opportunities than ever
【3layers・3color waveformWinning Shape】
What is it?!

The main feature of this indicator is,
“3.

The indicator bands arepink・green・blue in3layer structure, and the bands across the 3 layers alternate between convergence and dispersion, so during uptrends, from the top the sequence ispink・green・blue, and during downtrends, the reverse occurs, from the topblue・.

Therefore, whether in up or down movement, entry target is
「the point where pinkpulls away fromblue
This is the target.