

リーマンショック前に似ていると言えば似ている流れ
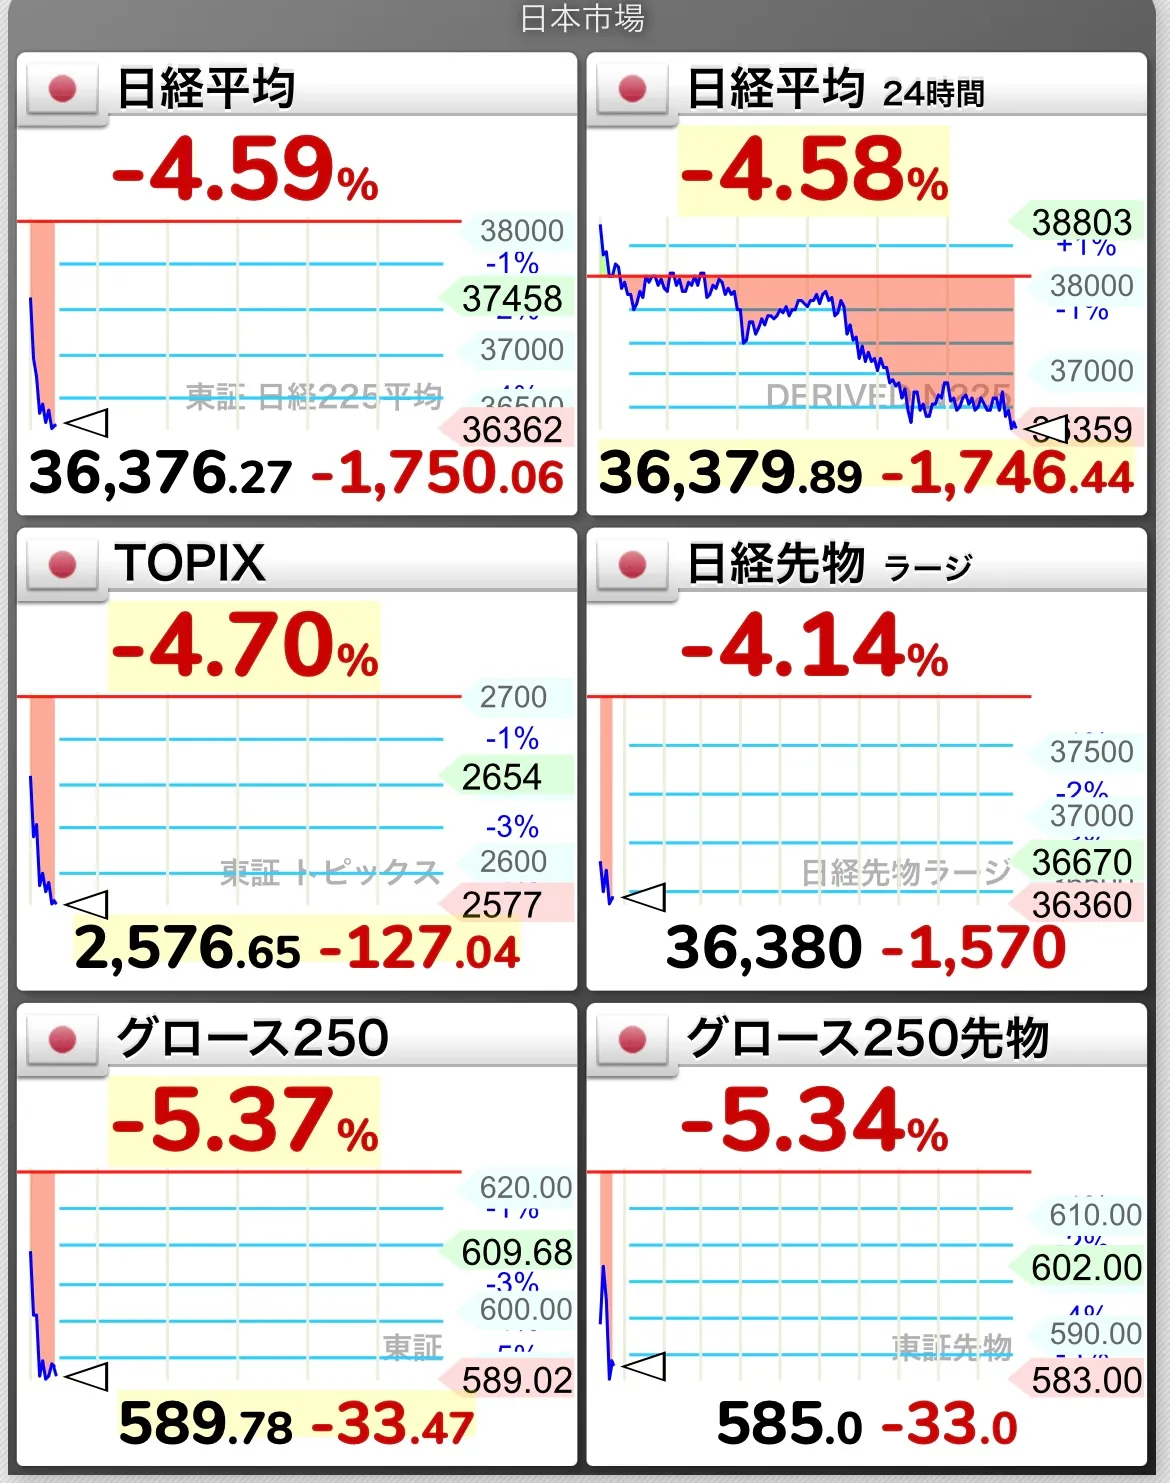
Good morning everyone.
The Nikkei average is in a plunge.
When something goes up, it will come down, so it’s not surprising at all.
The point is what's inside, what caused the rise.
Was it bought due to the Bank of Japan’s backing?
The Nikkei average has fallen by about 6,000 yen from recent highs.
Those who recently bought due to the NISA hype may be wondering why they bought at such a high price.
Well, it might be temporary, so those buying should wait and see.
However, this trend
reminds me of something before Lehman Brothers collapsed.
Just before the Lehman Shock, fake news of GM's collapse appeared around noon, and while I was watching the charts and eating a green panda pastry, the dollar-yen plummeted and I turned the panda over.
Dollar-Yen monthly chart
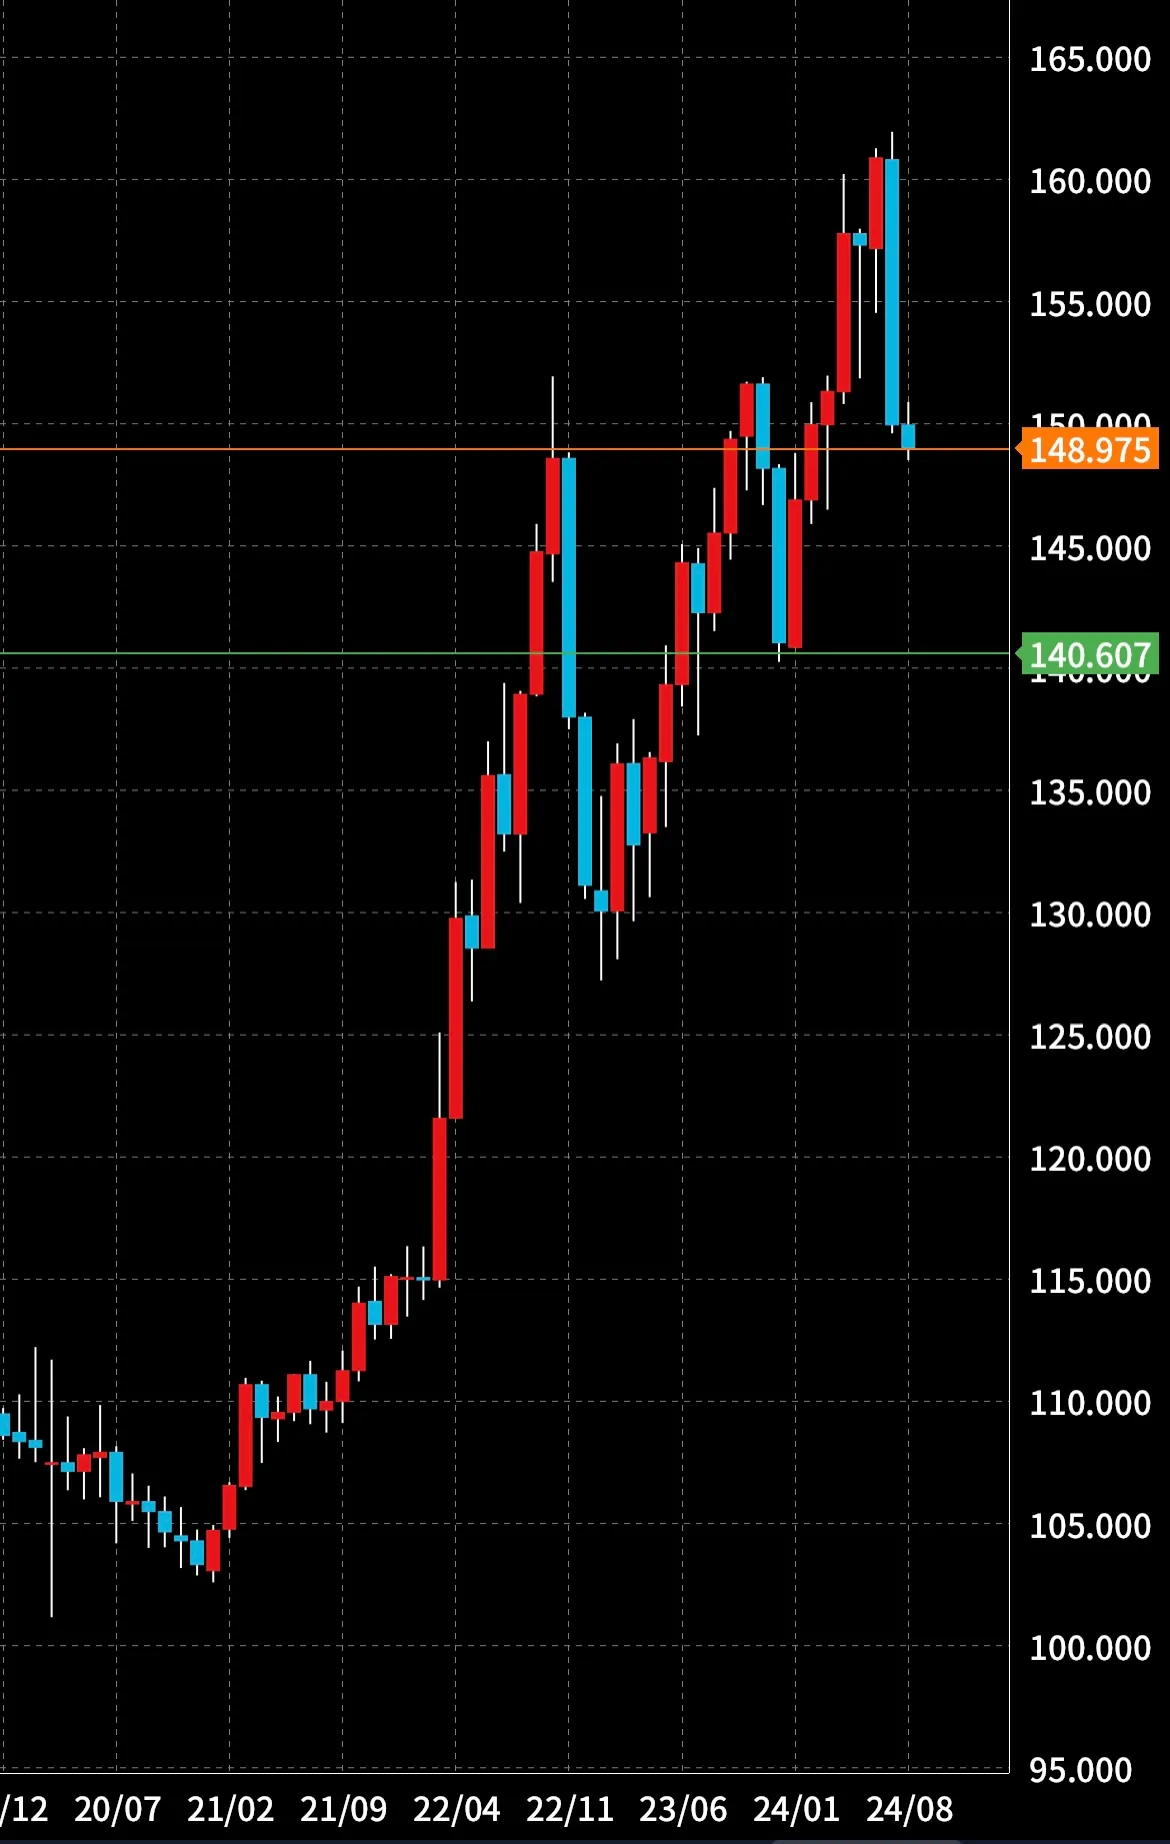
To all the billion-dollar traders using scalping, please switch your one-minute chart to a monthly chart to confirm.
Is this a good time for a pullback, or will the uptrend end below 140 and the support/resistance levels switch?
Isn't it such a moment?
If it continues to fall, the mid-126s would be a provisional target on the billions-trader monthly chart.
Looking back now, from the day of the Lehman Shock for about a year, if billion-dollar traders had scalped, we could have captured many small nearby trends without being whipped around.
If this lesson is applied and the crash continues this time, I plan to make small gains with billion-dollar traders’ scalping.
This is something I will share with the users.
The timing also resembles the Lehman Shock...
Am I overthinking…
Be cautious, be cautious