Nikkei Stock Average falls more than 1,300 yen at one point! (August 1)
Today (8/1)
【Winning Setup】 only capture and enter!
(Nikkei 225 15-minute chart)
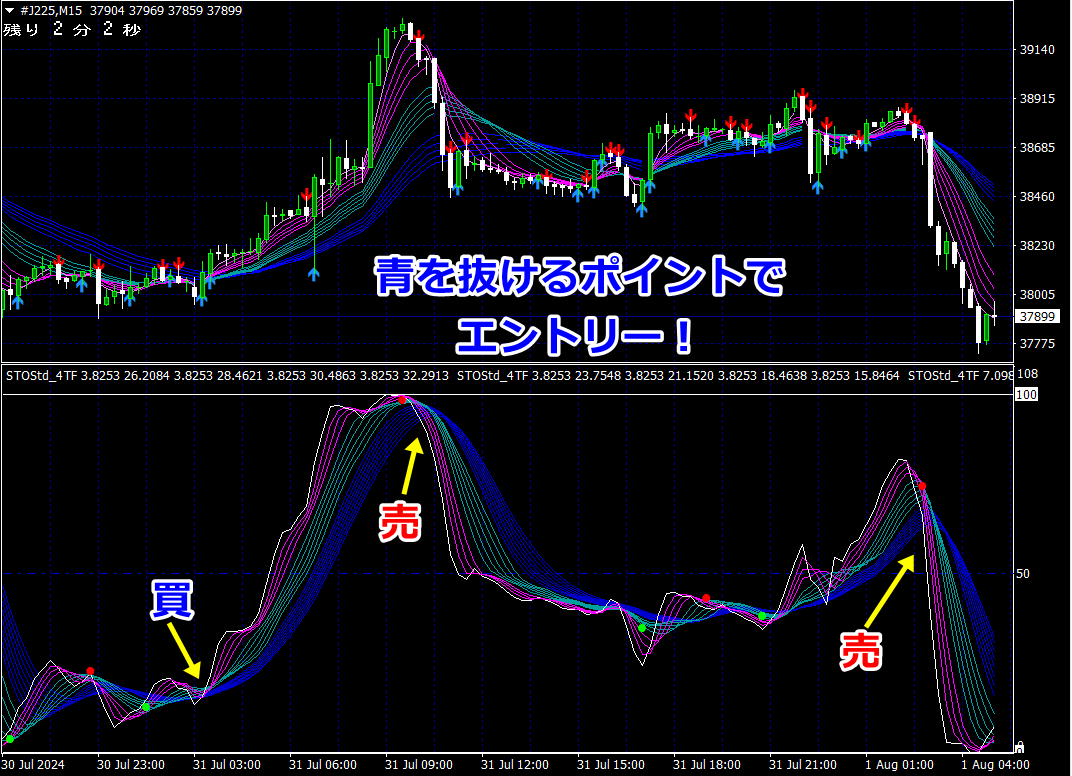
★ Point where pink breaks above blue (Click image to enlarge)
(Nikkei 225 15-minute chart)
★ Point where pink breaks above blue (Click image to enlarge)
Tenny bottom and top chart ・Mebius Series Latest indicator
Tenny bottom and top chart ・Mebius Series Latest indicator
『3 Layers ・3 Color waveform indicator』
More clearly identify entry opportunities than ever
【3 Layers・3 Color wave Winning Setup】
What is it?!

The biggest feature of this indicator is,
“3 Layers ・3 Color waveform indicator.”

The indicator bands are pink ・ green ・ blue, 3 layered structure, and the bands alternate as convergence and dispersion, so, when rising, from the top pink ・ green ・ blue order, when falling, the opposite order is from the top, blue・ green・ pink order.

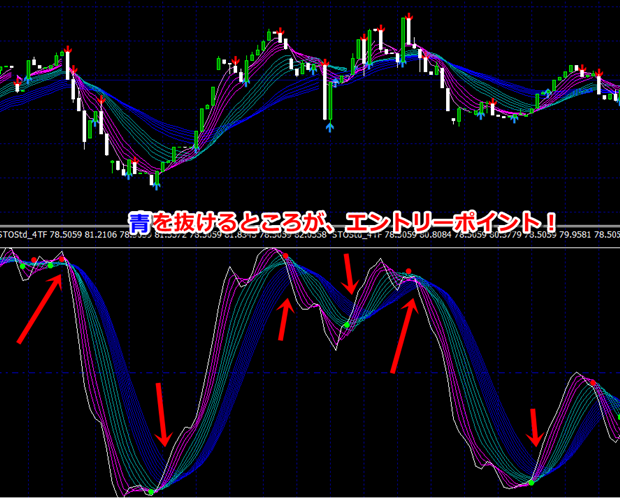
Therefore, whether rising or falling, the entry target is
「Pink breaks above Blue」
to become the entry point.