

Ripple (XRP) has a strong upper resistance functioning on multiple time-frame charts; what will happen to the price in the future? - October 19 Chart Analysis
From October 12, cryptocurrency Ripple (XRP) had been forming a gradual rising chart again, but since October 17, XRP has continued to stall. In the current XRP chart, strong resistance is observed on multiple timeframes. How will Ripple move in the future? We will check the chart.
Ripple (XRP), whose upward momentum has weakened, being held down by the long-term moving average
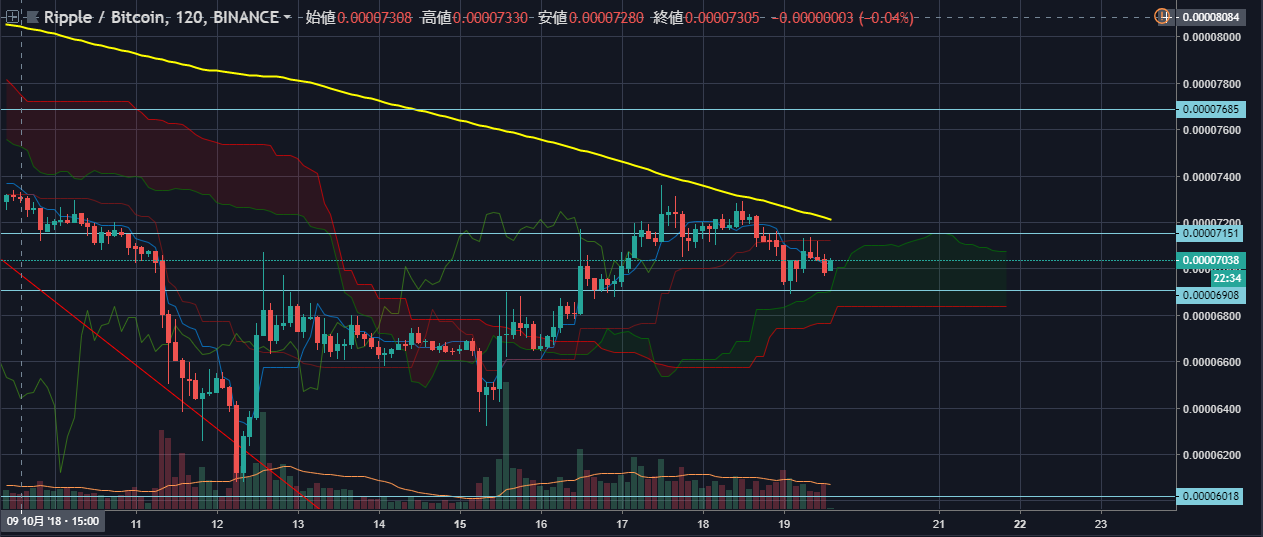
As XRP begins to pull back in line with the long-term moving average, today October 19 we see it touch the 0.000068 BTC range and then resume rising, indicating a lack of clear direction in price movement. While the upside is being restrained by the long-term moving average, the cloud of the Ichimoku Kinko Hyo on the downside is expected to widen from today onward, which could become one of the supporting factors.
× ![]()