

Bitcoin (BTC) breaks below the downward trend line and forms a “pullback selling” pattern. What will happen to the price going forward? — Chart analysis October 19
From October 16, Bitcoin (BTC), which shifted into a range market, continued to move without a clear direction until October 18. However, today on October 19, it once again breaks below the downward trend line that had been formed since early September after briefly breaking above it. The decline of Bitcoin, which showed selling rallies against the trend line, was sizable for a time and broke below the range market that had been in place since October 16. We will review Bitcoin's chart.
Bitcoin (BTC), which briefly broke through the downward trend line, then faced selling rallies and fell out of the range market
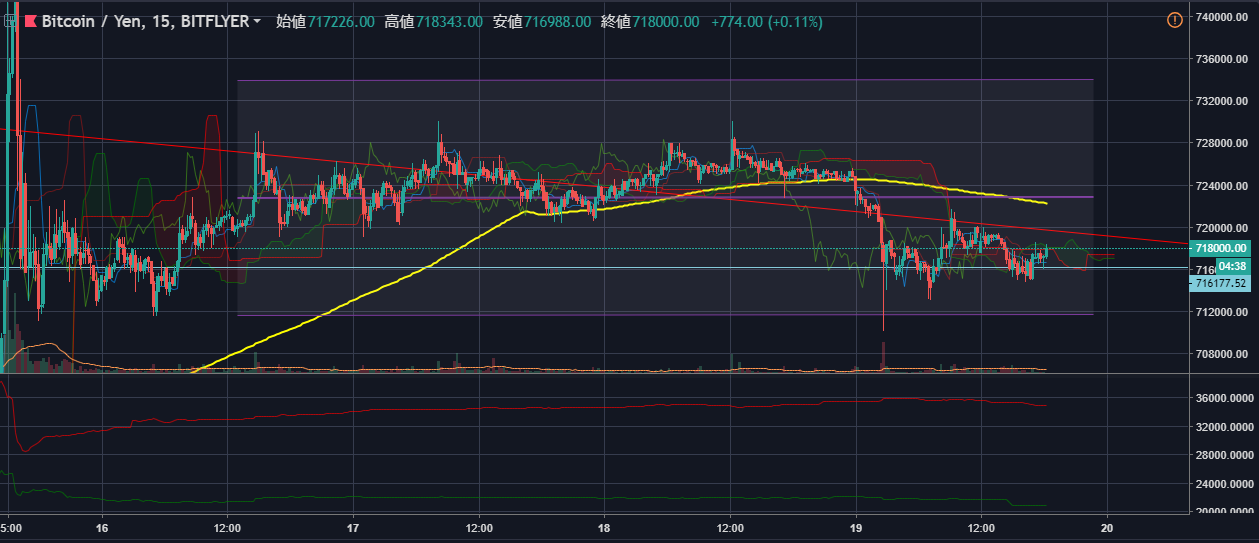
However, BTC could not break through the resistance line again and fell back, and after the decline, some movements appeared where the downward trend line acted as support, with several candles forming long lower wicks. Yet selling pressure remains strong, and today, October 19, it again breaks below the downward trend line.